. 2023 Jan;108(1):51-56.
doi: 10.1136/archdischild-2022-323900. Epub 2022 Jun 24.

Lung ultrasound of the dependent lung detects real-time changes in lung volume in the preterm lamb

Affiliations

Lung ultrasound of the dependent lung detects real-time changes in lung volume in the preterm lamb

Arun Sett et al. Arch Dis Child Fetal Neonatal Ed. 2023 Jan.

Abstract

Background: Effective lung protective ventilation requires reliable, real-time estimation of lung volume at the bedside. Neonatal clinicians lack a readily available imaging tool for this purpose.

Objective: To determine the ability of lung ultrasound (LUS) of the dependent region to detect real-time changes in lung volume, identify opening and closing pressures of the lung, and detect pulmonary hysteresis.

Methods: LUS was performed on preterm lambs (n=20) during in vivo mapping of the pressure-volume relationship of the respiratory system using the super-syringe method. Electrical impedance tomography was used to derive regional lung volumes. Images were blindly graded using an expanded scoring system. The scores were compared with total and regional lung volumes, and differences in LUS scores between pressure increments were calculated.

Results: Changes in LUS scores correlated moderately with changes in total lung volume (r=0.56, 95% CI 0.47-0.64, p<0.0001) and fairly with right whole (r=0.41, CI 0.30-0.51, p<0.0001), ventral (r=0.39, CI 0.28-0.49, p<0.0001), central (r=0.41, CI 0.31-0.52, p<0.0001) and dorsal (r=0.38, CI 0.27-0.49, p<0.0001) regional lung volumes. The pressure-volume relationship of the lung exhibited hysteresis in all lambs. LUS was able to detect hysteresis in 17 (85%) lambs. The greatest changes in LUS scores occurred at the opening and closing pressures.

Conclusion: LUS was able to detect large changes in total and regional lung volume in real time and correctly identified opening and closing pressures but lacked the precision to detect small changes in lung volume. Further work is needed to improve precision prior to translation to clinical practice.

Keywords: Neonatology; Respiratory Medicine.


Conflict of interest statement

Competing interests: None declared.

Figures

Figure 1
Figure 1
Expanded lung ultrasound (LUS) scoring system. Scores range from 0 to 5. The complete range of aeration is represented. A lines; Strong reverberation artefacts that form horizontal echogenic lines that are equidistant between the pleural line and ultrasound transducer. B lines; Tight reverberation artefacts that form continuous vertical echogenic lines that originate from the pleura and extend through the image. Speckling; Discrete echogenic foci which represent air in the small airways. Hepatisation; Complete loss of aeration allowing true imaging of lung tissue. This image is similar to the sonographic appearance of liver tissue.
Figure 2
Figure 2
(A) Static pressure-volume (PV) curve derived from the super-syringe method (circles, grey dashed line) and LUS (squares, solid black line). All data are represented as median (IQR). X-axis; pressure (cm H2O), Y-axis; total lung volume (ml/kg). Open symbols represent the inflation limb and closed symbols the deflation limb. (B) Correlation between change in LUS scores and total lung volume. X-axis; LUS score, Y-axis; total lung volume (ml/kg). LUS, lung ultrasound.
Figure 3
Figure 3
Distribution of LUS scores versus total lung volume. Individual dots represent LUS scores from each lamb. Of the scores 97% were distributed between 0 and 3. LUS, lung ultrasound.
Figure 4
Figure 4
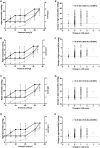
Static regional PV curves derived from EIT (circles, grey dashed line) and LUS (squares, black solid line) of the right whole lung (A), ventral (B), central (C) and dorsal (D) regions. All data median (IQR). Open symbols represent the inflation limb and closed symbols the deflation limb. (E–H) Correlation between change in LUS scores and regional lung volume for the corresponding lung regions in Panels A–D. EELV, end expiratory lung volume, LUS, lung ultrasound; PV, pressure-volume.

References

    1. Dargaville PA, Tingay DG. Lung protective ventilation in extremely preterm infants. J Paediatr Child Health 2012;48:740–6. 10.1111/j.1440-1754.2012.02532.x - DOI - PubMed
    1. Thome U, Töpfer A, Schaller P, et al. . Comparison of lung volume measurements by antero-posterior chest X-ray and the SF6 washout technique in mechanically ventilated infants. Pediatr Pulmonol 1998;26:265–72. 10.1002/(SICI)1099-0496(199810)26:4&lt;265::AID-PPUL6&gt;3.0.CO;2-G - DOI - PubMed
    1. De Jaegere A, van Veenendaal MB, Michiels A, et al. . Lung recruitment using oxygenation during open lung high-frequency ventilation in preterm infants. Am J Respir Crit Care Med 2006;174:639–45. 10.1164/rccm.200603-351OC - DOI - PubMed
    1. Tingay DG, Mills JF, Morley CJ, et al. . Indicators of optimal lung volume during high-frequency oscillatory ventilation in infants. Crit Care Med 2013;41:237–44. 10.1097/CCM.0b013e31826a427a - DOI - PubMed
    1. Doyle LW, Carse E, Adams A-M, et al. . Ventilation in extremely preterm infants and respiratory function at 8 years. N Engl J Med 2017;377:329–37. 10.1056/NEJMoa1700827 - DOI - PubMed