. 2022 Oct;127(6):1162-1171.
doi: 10.1038/s41416-022-01875-7. Epub 2022 Jun 24.

Tumour immune microenvironment in resected thymic carcinomas as a predictor of clinical outcome

Affiliations

Tumour immune microenvironment in resected thymic carcinomas as a predictor of clinical outcome

Giovanni Bocchialini et al. Br J Cancer. 2022 Oct.

Abstract

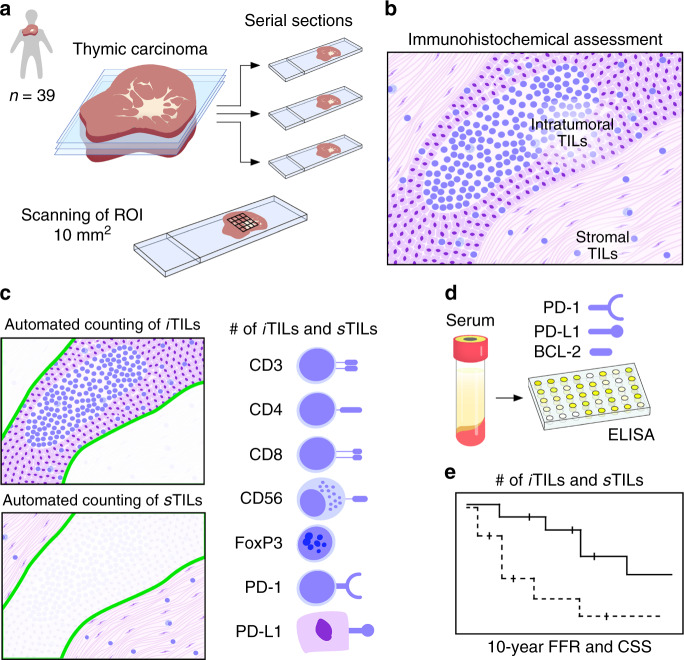
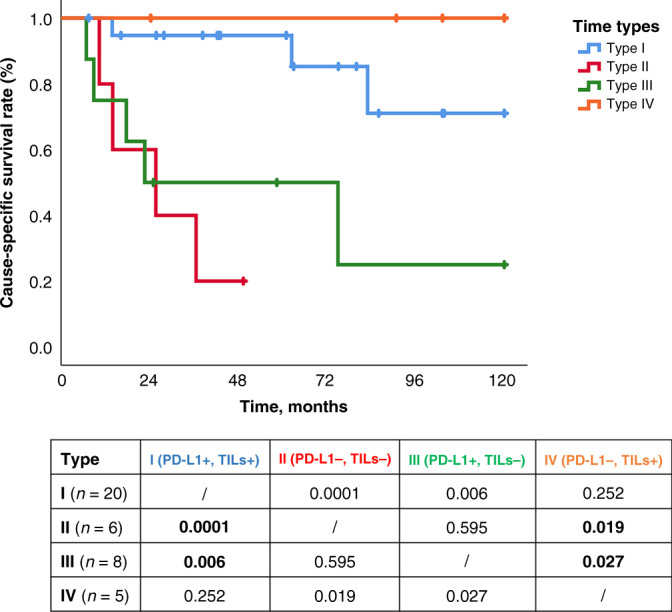
Background: The spatial distribution of tumour-infiltrating lymphocytes (TILs) is a novel descriptor characterising the tumour immune microenvironment (TIME). The aim of our study was to assess whether a specific TIME of surgically resected thymic carcinoma (TC) can predict tumour invasiveness, recurrence or survival.

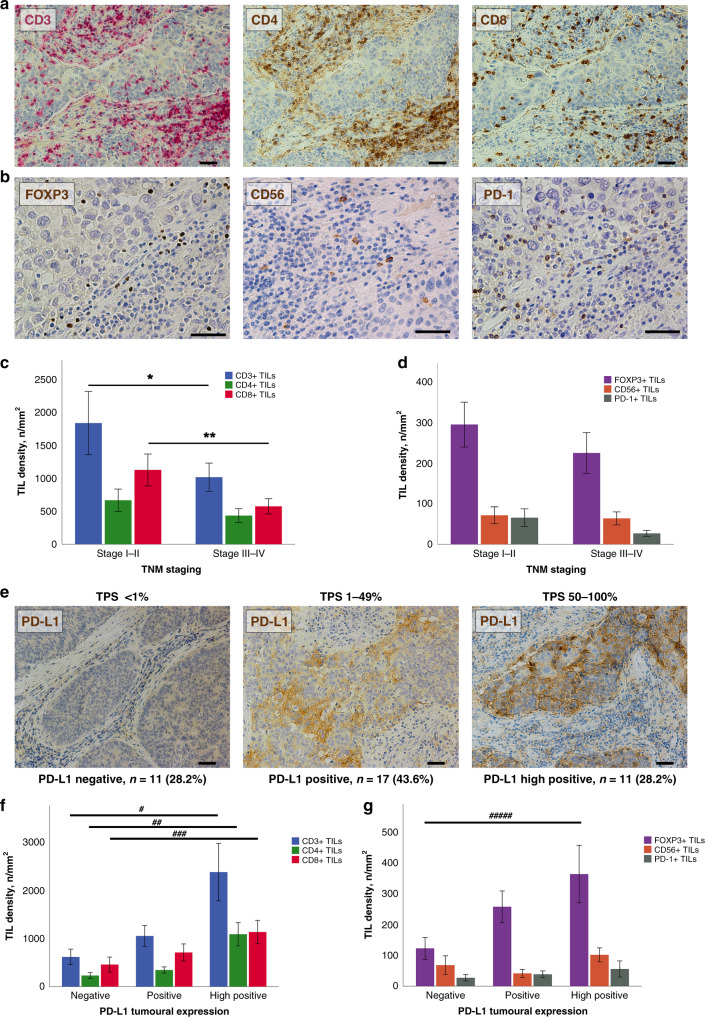
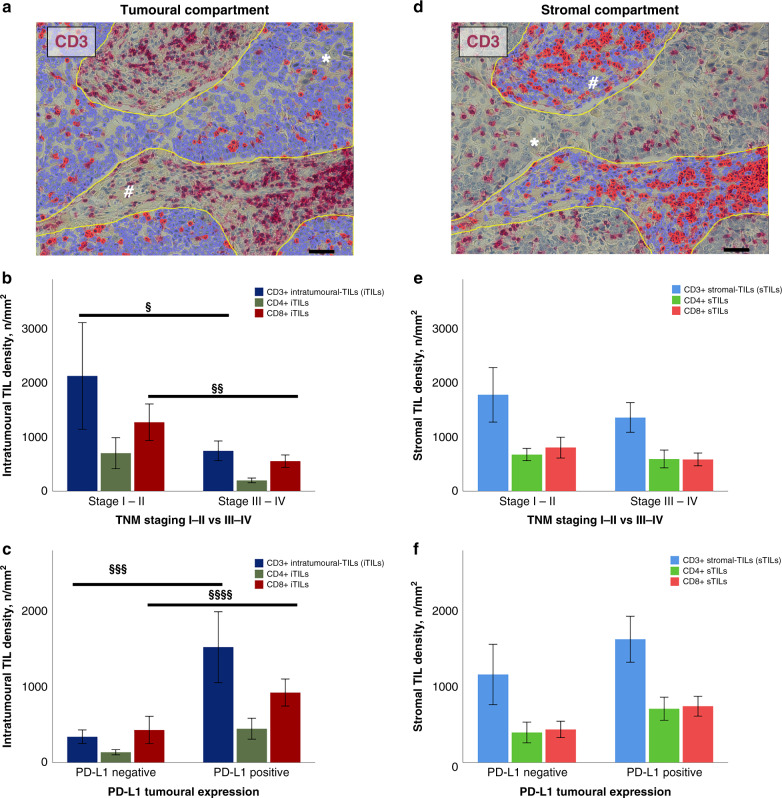
Methods: Digital microscopy was performed on 39 TCs immunohistochemically stained to investigate the activation of the immune checkpoint pathway (PD-L1/PD-1), along with density and spatial distribution of TILs phenotypes (CD3+, CD4+, CD8+, FOXP3+, CD56+). The impact of PD-L1 and TIL density considering the intratumoural (iTILs) and stromal (sTILs) distribution on pathological characteristics and clinical outcomes were analysed.

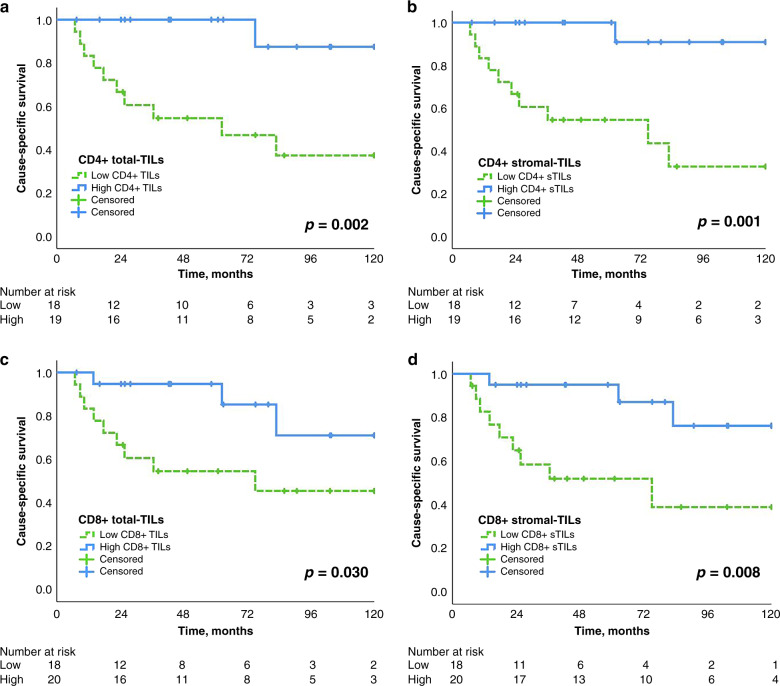
Results: In early TC stages, we observed a higher total density of CD3+ (p = 0.05) and CD8+ (p = 0.02) TILs. PD-L1 was expressed in 71.8% of TCs. In advanced TC stages, we observed a lower density of CD3+ (p = 0.04) and CD8+ (p = 0.01) iTILs compared to early stages. Serum concentrations of PD-L1 were significantly higher in TCs compared to healthy controls: 134.43 ± 18.51 vs. 82.01 ± 6.34 pg/ml (p = 0.001), respectively. High densities of stromal CD4+ TILs (54 vs. 32%, p = 0.043) and CD8+ TILs (65 vs. 17%, p = 0.048) were associated with improved freedom from recurrence (FFR) and cause-specific survival (CSS). High density of FoxP3+ TILs were associated with improved FFR (p = 0.03) and CSS (p = 0.003).

Discussion: Mapping TIL subpopulations complement the armamentarium for prognostication of TC outcomes. The improved outcome in patients with high density of TILs supports the use of immune checkpoint inhibitors in TC patients.


Conflict of interest statement

The authors declare no competing interests.

Figures

Fig. 1
Fig. 1. Graphical overview of study design.
Serial sectioning of TC specimens. Tumour tissues of 39 donors were included and an average area of 10 mm2 of stained tissue sections was analysed (a). Scheme of TILs residing within the tumour or stroma (b). Tissue sections were stained for CD3, CD4, CD8, CD56, FoxP3, PD-1 and PD-L1. Numbers of iTILs and sTILs were automatically computed by high-volume scanning and digital microscopy (c). Serum levels of PD-1, PD-L1 and BCL2 were quantified in TC patients and healthy controls (d). Dichotomised numbers of TILs were analysed for recurrence and survival (e). CSS cause-specific survival, FFR freedom from recurrence, iTIL intratumoural tumour-infiltrating lymphocyte, sTIL stromal tumour-infiltrating lymphocyte, PD-1 programmed death 1 receptor, PD-L1 programmed death ligand 1, ROI region of interest, TIL tumour-infiltrating lymphocyte.
Fig. 2
Fig. 2. Tumour-infiltrating lymphocytes and programmed death ligand 1 in thymic carcinoma.
Immunohistochemistry on serial sections of a thymic SCC is displayed. Immunoperoxidase staining of CD3+ (red), CD4+ and CD8+ (brown) lymphocytes of a TC sample (a). Detection with brown peroxidase of FOXP3+, CD56+ and PD-1+ TILs in another area of the same case (b). Bar graphs showing a significantly decreased density of CD3+ and CD8+ TILs as well as decreased densities of CD4+, FOXP3+, CD56+ and PD-1+ TILs in advanced TNM stages (*p = 0.05, **p = 0.02) (c, d). Immunohistochemical detection of PD-L1 in TCs revealed different levels of expression. Representative micrographs are shown: no expression with TPS <1%, PD-L1 expression with TPS from 1 to 49% and high PD-L1 expression with TPS from 50 to 100% (e). Bar diagrams illustrating the increased density of TILs concomitant to high PD-L1 expression (#p = 0.006, ##p = 0.01, ###p = 0.02, ####p = 0.009) (f, g). Scale bars: 100 µm (a, e) and 50 µm (b). TIL tumour infiltrating lymphocytes, PD-L1 programmed death ligand 1, TPS Tumour Proportional Score, TC thymic carcinoma, SCC squamous cell carcinoma, TNM tumour–node–metastasis staging system.
Fig. 3
Fig. 3. Assessment of the spatial architecture of TILs using digital system.
Region of interest (ROI) corresponding to tumour area and automated detection of CD3-positive infiltrating lymphocytes (red dots, iTILs) (a). Stromal area selected within the ROI and following automated detection of CD3-positive infiltrating lymphocytes (red dots, sTILs) (d). Bar graphs showing the different spatial distribution of TILs according to TNM stage (§p = 0.04, §§p = 0.01) (be) and PD-L1 expression (§§§p = 0.006, §§§§p = 0.04) (cf). Asterisks (*) indicate tumour cells. Hashes (#) indicate stromal tissue. Scale bars: 100 µm. iTIL intratumoural-infiltrating lymphocyte, PD-L1 programmed death ligand 1, ROI region of interest, sTIL stromal-infiltrating lymphocyte.
Fig. 4
Fig. 4. Outcome analysis.
Kaplan–Meier survival curves showing the impact of density and localisation of CD4+, CD8+ CSS (ad) in thymic carcinoma patients. The median of respective TIL density was used to dichotomise into high and low groups. Log-rank test p values as well as the number of patients at risk are indicated. CSS cause-specific survival.
Fig. 5
Fig. 5. Survival analysis according to TIME types.
Cause-specific survival according to the four tumour microenvironment types based on PD-L1 and TILs. Kaplan–Meier curves for each type: type I (PD-L1+/TILs+) adaptive immune resistance, type II (PD-L1−/TILs−) immunological ignorance, type III (PD-L1+/TILs−) intrinsic induction, and type IV (PD-L1−/TILs+) tolerance. At the bottom, the table shows the log-rank test between groups. PD-L1 programmed death ligand 1, TILs tumour infiltrating lymphocyte.

References

    1. de Jong WK, Blaauwgeers JL, Schaapveld M, Timens W, Klinkenberg TJ, Groen HJ. Thymic epithelial tumours: a population-based study of the incidence, diagnostic procedures and therapy. Eur J Cancer. 2008;44:123–30. doi: 10.1016/j.ejca.2007.11.004. - DOI - PubMed
    1. Marx A, Ströbel P, Badve SS, Chalabreysse L, Chan JK, Chen G, et al. ITMIG consensus statement on the use of the WHO histological classification of thymoma and thymic carcinoma: refined definitions, histological criteria, and reporting. J Thorac Oncol. 2014;9:596–611. doi: 10.1097/JTO.0000000000000154. - DOI - PubMed
    1. Detterbeck FC, Nicholson AG, Kondo K, Van Schil P, Moran C. The Masaoka-Koga stage classification for thymic malignancies: clarification and definition of terms. J Thorac Oncol. 2011;6:S1710–6. doi: 10.1097/JTO.0b013e31821e8cff. - DOI - PubMed
    1. Detterbeck FC, Stratton K, Giroux D, Asamura H, Crowley J, Falkson C, et al. The IASLC/ITMIG Thymic Epithelial Tumors Staging Project: proposal for an evidence-based stage classification system for the forthcoming (8th) edition of the TNM classification of malignant tumors. J Thorac Oncol. 2014;9:S65–72. doi: 10.1097/JTO.0000000000000290. - DOI - PubMed
    1. Girard N, Ruffini E, Marx A, Faivre-Finn C, Peters S, on behalf of the ESMO Guidelines Committee. Thymic epithelial tumours: ESMO Clinical Practice Guidelines for diagnosis, treatment and follow-up. Ann Oncol. 2015;26:v40–55. doi: 10.1093/annonc/mdv277. - DOI - PubMed

Publication types

Substances