. 2022 Jun 24;7(1):67.
doi: 10.1038/s41541-022-00490-0.

Seasonal influenza vaccination expands hemagglutinin-specific antibody breadth to older and future A/H3N2 viruses

Affiliations

Seasonal influenza vaccination expands hemagglutinin-specific antibody breadth to older and future A/H3N2 viruses

Nina Urke Ertesvåg et al. NPJ Vaccines. .

Abstract

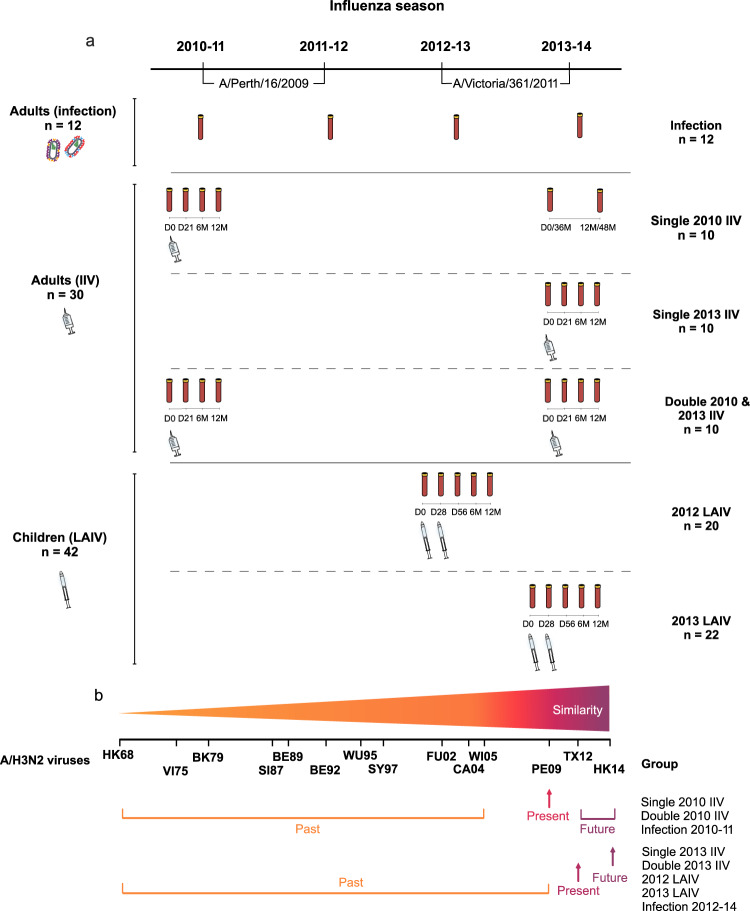
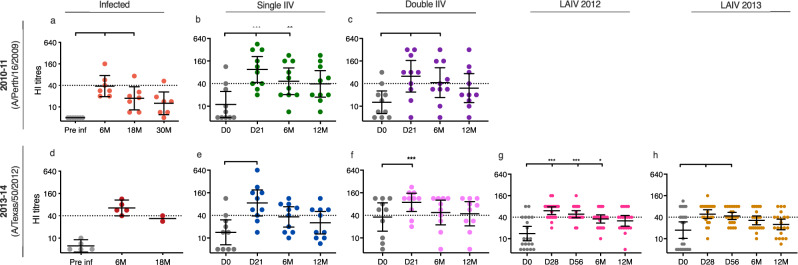
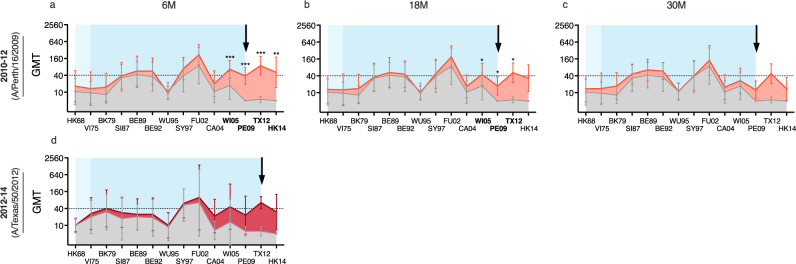
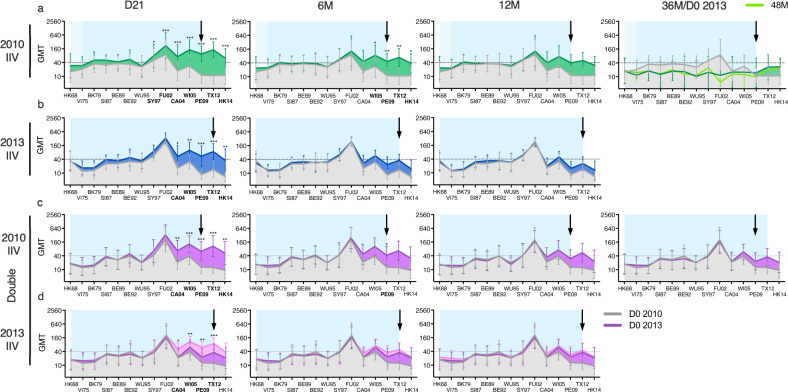
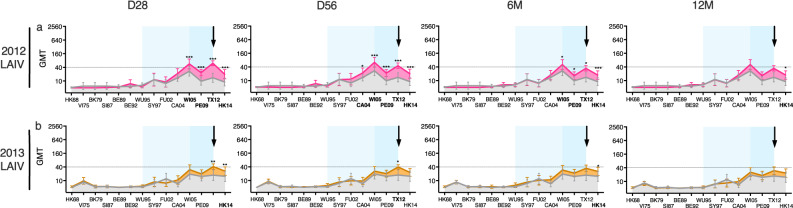
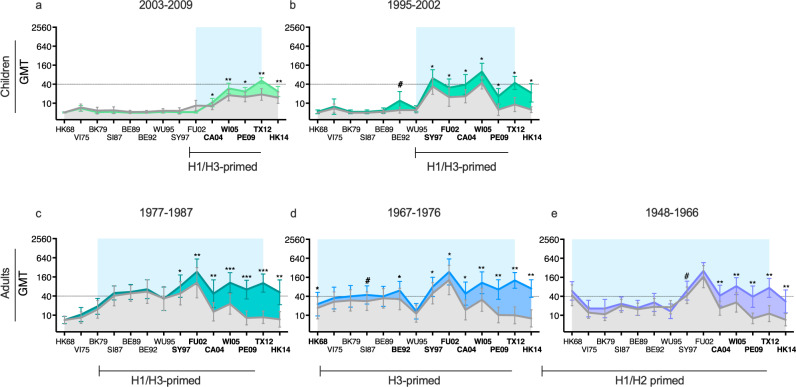
History of influenza A/H3N2 exposure, especially childhood infection, shape antibody responses after influenza vaccination and infection, but have not been extensively studied. We investigated the breadth and durability of influenza A/H3N2-specific hemagglutinin-inhibition antibodies after live-attenuated influenza vaccine in children (aged 3-17 years, n = 42), and after inactivated influenza vaccine or infection in adults (aged 22-61 years, n = 42) using 14 antigenically distinct A/H3N2 viruses circulating from 1968 to 2018. We found that vaccination and infection elicited cross-reactive antibody responses, predominantly directed against newer or future strains. Childhood H3-priming increased the breadth and magnitude of back-boosted A/H3N2-specific antibodies in adults. Broader and more durable A/H3N2-specific antibodies were observed in repeatedly vaccinated adults than in children and previously unvaccinated adults. Our findings suggest that early A/H3N2 exposure and frequent seasonal vaccination could increase the breadth and seropositivity of antibody responses, which may improve vaccine protection against future viruses.


Conflict of interest statement

All authors declare that they have no known competing financial interests or personal relationships that could have appeared to influence the work reported in this paper.

Figures

Fig. 1
Fig. 1. Study design.
During the influenza seasons 2010-14, the A/H3N2 component in the seasonal vaccine changed from A/Perth/16/2009 in 2010-12 seasons to A/Victoria/361/2011 in 2012-14 seasons. a A group of unvaccinated adults were infected with circulating influenza A/H3N2 viruses, defined as a fourfold seroconversion in HI titres between pre- and post-season blood samples (infection, n = 12). Thirty adults were vaccinated with IIV during the study period, generating three different vaccination groups (n = 10 each): single 2010 IIV, single 2013 IIV and double 2010 and 2013 IIV. Five individuals from the single 2010 IIV group provided long-term follow-up blood samples 36 and 48 months after vaccination (equivalent to day 0 and 12 months in the 2013-14 season). The children’s cohort were vaccinated with either one (≥9 years old) or two doses (<9 years old) of a live-attenuated influenza vaccine (LAIV) in two different influenza seasons (2012 LAIV (n = 20) and 2013 LAIV (n = 22)). Blood samples were collected in all vaccinated individuals at day 0 (D0) and post-vaccination day 21/28 (D21/D28), day 56 (D56, only in children), 6 and 12 months (6 M, 12 M). (b) Timeline of A/H3N2 viruses circulated from 1968 to 2018 and the different groups’ perspective of past, present and future viruses according to the timeline. Adults vaccinated or infected in 2010-12 with the A/Perth/16/2009 (PE09) had not yet been exposed to A/Texas/50/2012 (TX12) or A/HongKong/4801/2014 (HK14), defined as future strains for these subjects. Vaccinated or infected adults, and vaccinated children, in 2012-14 had not been exposed to the future strain HK14 which circulated from 2015-18.
Fig. 2
Fig. 2. Homologous hemagglutination inhibition (HI) titres after influenza A/H3N2 infection and vaccination in adults and children.
Adults were either infected or vaccinated with seasonal inactivated influenza vaccines (IIVs) and children were vaccinated with seasonal live-attenuated influenza vaccines (LAIV). Serum samples were collected once a year before the start of influenza season in infected adults (September/October) and time post-infection was calculated from the season seroconversion occurred. HI titres against homologous A/Perth/16/2009 (H3N2) or A/Texas/50/2012 (H3N2) are shown in adults pre- and post-infection (n = 7 or 5, respectively) (a, b) and in adults pre- (day 0 (DO)) and post-IIV (day 21 (D21), 6 (6 M) and 12 months (12 M)) (n = 10 each) (c–f). LAIV was not licensed in Europe and Norway until 2012, therefore we do not have vaccination responses against A/Perth/16/2009 in children. HI responses to the homologous A/Texas/50/2012 (H3N2) vaccine strain pre- (day 0) and post-LAIV (day 21, 56, 6, and 12 months) in 2012 (n = 20) (g) and 2013 (n = 22) (h). Each symbol represents an individual HI titre. The horizontal lines show geometric mean HI titres with 95% confidence interval. The dotted line indicates an HI titre of 40. Pre- and post-vaccination HI titres were compared using nonparametric repeated measure Friedman test with Dunn’s multiple comparison correction for each vaccination group, except the TX12 infected group due to missing sample for long-term follow-up, which was analysed using non-parametric Wilcoxon matched-pairs signed-rank test for pre- and 6 M post-infection time points. *P < 0.05, **P < 0.01, ***P = < 0.001.
Fig. 3
Fig. 3. Hemagglutination inhibition (HI) antibody landscapes after A/H3N2 infection in adults.
Antibody landscapes were generated with geometric mean HI titres (GMTs) against 14 historical and future influenza A/H3N2 viruses (see Table 1 for the strains used). Error bars represent the 95% confidence intervals of the GMTs. In Norway, the influenza season usually starts at the end of October and peaks between December and March. Blood samples were collected annually in September/October from 2010 to 2014 from unvaccinated adults. Seroconversion (four-fold increase in HI titres) between two time points against the predominantly circulating A/H3N2 viruses were defined as infection. The time post-infection was calculated from the season seroconversion occurred. All individual landscapes are shown in Supplementary Figure 2a. HI antibody landscapes are shown pre-infection (grey) and at 6-9 months (6 M) (a), 18–21 months (18 M) (b) and 30-33 months (30 M) (c) post-infection with PE09, n = 7, and at 6-9 months post-infection with TX12, n = 5 (d). No landscape was generated at 18-21 months post-TX12 infection because only 2 individuals provided serum samples. The viral exposure period is shown in blue based on the group’s median age, and in light blue indicating the oldest individual in the group. Pre- and post-infection HI titres were compared using non-parametric repeated measure Friedman test with Dunn’s multiple comparison correction for each infected group. *P < 0.05, **P < 0.01, ***P = < 0.001.
Fig. 4
Fig. 4. The A/H3N2-specific hemagglutination inhibition (HI) antibody landscapes after vaccination with inactivated influenza vaccines (IIV) in adults.
Antibody landscapes were generated using the groups’ geometric mean HI titre (GMT) against 14 antigenically distinct influenza A/H3N2 viruses (see Table 1 for the strains used). Error bars represent the 95% confidence intervals of the GMTs. The pre-vaccination GMTs at day (D)0 are displayed in grey. a Antibody landscapes of adults vaccinated with single IIV in 2010, n = 10 (single 2010 IIV) at D21, 6 months (M), 12 M, 36 M (equivalent to D0 in 2013) (dark green), and 48 M (equivalent to 12 M in 2013) (light green) post-IIV. b Antibody landscapes of adults vaccinated in 2013, n = 10 (single 2013 IIV) at D21, 6 M and 12 M post-IIV (dark blue). (c–d): Antibody landscapes of adults vaccinated in both 2010 and 2013 (double IIV), n = 10, at D21, 6 M, 12 M and 36 M after 2010 IIV (dark purple) (c) or after 2013 IIV (light purple) (d). The individual vaccinee landscapes can be found in Supplementary Figure 2b–d. The black arrow indicates the vaccination virus, and the dotted line indicates the HI titre of 40. The viral exposure period is shown in blue based on the group’s median age, and light blue indicating the oldest individual in the group. Pre- and post-IIV titres were compared using nonparametric repeated measure Friedman test with Dunn’s multiple comparison correction for each vaccination group. *P < 0.05, **P < 0.01, ***P = < 0.001.
Fig. 5
Fig. 5. The A/H3N2-specific hemagglutination inhibition (HI) antibody landscapes after vaccination with live-attenuated influenza vaccines (LAIV) in children.
Antibody landscapes were generated using the groups’ geometric mean HI titre (GMT) against 14 antigenically distinct influenza A/H3N2 viruses (see Table 1 for the strains used). Error bars represent the 95% confidence intervals of the GMTs. The pre-vaccination GMTs at day (D)0 are displayed in grey. Antibody landscapes of children vaccinated with LAIV in 2012 (2012 LAIV, n = 20) (pink) (a) or in 2013 (2013 LAIV, n = 22) (brown) (b) at D28, D56, 6 months (M) and 12 M post-LAIV are shown. Individual landscapes can be found in Supplementary Figure 3. The black arrow indicates the vaccination virus, and the dotted line indicates the HI titre of 40. The viral exposure period is shown in blue based on the group’s median age, and light blue indicating the oldest individual in the group. Pre- and post-LAIV titres were compared using non-parametric repeated measure Friedman test with Dunn’s multiple comparison correction for each vaccination group. *P < 0.05, **P < 0.01, ***P = < 0.001.
Fig. 6
Fig. 6. The A/H3N2-specific hemagglutination inhibition (HI) antibody landscapes by birth-year in adults and children.
Antibody landscapes were generated using the groups’ geometric mean HI titre (GMT) against 14 antigenically distinct influenza A/H3N2 viruses (see Table 1 for the strains used). Error bars represent the 95% confidence intervals of the GMTs. Children and adults were grouped by their birth year regardless of the year they were vaccinated or infected. The pre-existing HI titres are displayed in grey. Peak titres after vaccination or infection were used (21/28 days post-vaccination or 6 months post-infection). Antibody landscapes post-vaccination of children born between 2003 and 2009 (n = 31) in light green (a) and children born between 1995 and 2002 (n = 11) in dark green (b). Antibody landscapes post-vaccination or infection of adults born 1977-1987 (n = 14) in ocean green (c), adults born 1967-1976 (n = 14) in blue (d), and adults born 1948-1966 (n = 14) in lavender (e). The dotted line indicates the HI titre of 40 and the period of viral exposure is highlighted by a light blue background. Pre- and post-vaccination or infection HI titres were compared using non-parametric Wilcoxon matched-pairs signed-rank test with individual ranks computed for each comparison, and Holm-Šídák method for multiple comparisons. #P < 0.1, *P < 0.05, **P < 0.01, ***P = < 0.001.
Fig. 7
Fig. 7. The impact of priming and previous vaccination on the breadth of hemagglutination inhibition (HI) A/H3N2-specific antibody responses.
The cumulative seroprotection rates (cumulative percentages of individuals with HI titres ≥40) against a range of influenza A/H3N2 viruses (total 14 viruses) regardless of the viruses’ circulation time pre-exposure (pre-vaccination or infection) (n = 84) (a), peak responses post-exposure (day 21/28 post-vaccination or 6 months post-infection) (n = 84) (b), and long-term post-exposure (6 months post-vaccination or 18 months post-infection) (n = 79) (c). Subjects were stratified by their birth year based on the likelihood of priming with different influenza A subtypes (a–c). Children were divided into two birth cohorts: 2003-2009 and 1995-2002 (both H1/H3 primed) and adults were divided into 3 birth cohorts: 1977-1987 (H1/H3 primed), 1967-1976 (H3 primed) and 1948-1966 (H1/H2 primed). The cumulative seroprotection rates against the numbers of influenza A/H3N2 viruses in adults pre-exposure (n = 42) (d), peak post-exposure (n = 42) (e), and long-term post-exposure (n = 37) (f) were stratified by previous vaccination history and compared to the infection group.

References

    1. World Health Organization. Influenza (Seasonal), https://www.who.int/news-room/fact-sheets/detail/influenza-(seasonal) (2018).
    1. Paules C, Subbarao K. Influenza. Lancet. 2017;390:697–708. doi: 10.1016/S0140-6736(17)30129-0. - DOI - PubMed
    1. Avadhanula V, Piedra PA. The Prevention of Common Respiratory Virus Epidemics in 2020-21 during the Severe Acute Respiratory Syndrome Coronavirus 2 (SARS-CoV-2) Pandemic: An Unexpected Benefit of the Implementation of Public Health Measures. Lancet Reg. Health Am. 2021;2:100043. - PMC - PubMed
    1. Stowe J, et al. Interactions between SARS-CoV-2 and influenza, and the impact of coinfection on disease severity: a test-negative design. Int J. Epidemiol. 2021;50:1124–1133. doi: 10.1093/ije/dyab081. - DOI - PMC - PubMed
    1. Bai L, et al. Coinfection with influenza A virus enhances SARS-CoV-2 infectivity. Cell Res. 2021;31:395–403. doi: 10.1038/s41422-021-00473-1. - DOI - PMC - PubMed