

Modeling net ecosystem carbon balance and loss in coastal wetlands exposed to sea-level rise and saltwater intrusion
- PMID: 35751522
- PMCID: PMC10078618
- DOI: 10.1002/eap.2702
Modeling net ecosystem carbon balance and loss in coastal wetlands exposed to sea-level rise and saltwater intrusion
Abstract
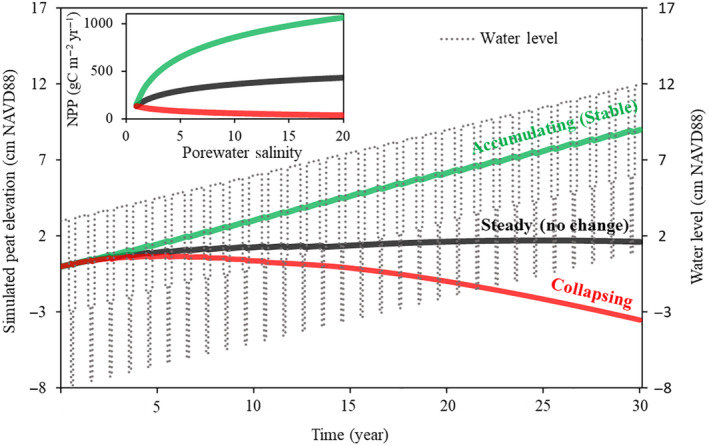
Coastal wetlands are globally important stores of carbon (C). However, accelerated sea-level rise (SLR), increased saltwater intrusion, and modified freshwater discharge can contribute to the collapse of peat marshes, converting coastal peatlands into open water. Applying results from multiple experiments from sawgrass (Cladium jamaicense)-dominated freshwater and brackish water marshes in the Florida Coastal Everglades, we developed a system-level mechanistic peat elevation model (EvPEM). We applied the model to simulate net ecosystem C balance (NECB) and peat elevation in response to elevated salinity under inundation and drought exposure. Using a mass C balance approach, we estimated net gain in C and corresponding export of aquatic fluxes ( ) in the freshwater marsh under ambient conditions (NECB = 1119 ± 229 gC m-2 year-1 ; FAQ = 317 ± 186 gC m-2 year-1 ). In contrast, the brackish water marsh exhibited substantial peat loss and aquatic C export with ambient (NECB = -366 ± 15 gC m-2 year-1 ; FAQ = 311 ± 30 gC m-2 year-1 ) and elevated salinity (NECB = -594 ± 94 gC m-2 year-1 ; FAQ = 729 ± 142 gC m-2 year-1 ) under extended exposed conditions. Further, mass balance suggests a considerable decline in soil C and corresponding elevation loss with elevated salinity and seasonal dry-down. Applying EvPEM, we developed critical marsh net primary productivity (NPP) thresholds as a function of salinity to simulate accumulating, steady-state, and collapsing peat elevations. The optimization showed that ~150-1070 gC m-2 year-1 NPP could support a stable peat elevation (elevation change ≈ SLR), with the corresponding salinity ranging from 1 to 20 ppt under increasing inundation levels. The C budgeting and modeling illustrate the impacts of saltwater intrusion, inundation, and seasonal dry-down and reduce uncertainties in understanding the fate of coastal peat wetlands with SLR and freshwater restoration. The modeling results provide management targets for hydrologic restoration based on the ecological conditions needed to reduce the vulnerability of the Everglades' peat marshes to collapse. The approach can be extended to other coastal peatlands to quantify C loss and improve understanding of the influence of the biological controls on wetland C storage changes for coastal management.
Keywords: elevation change; net ecosystem C balance; peat collapse; saltwater intrusion; sea-level rise; wetland vulnerability.
© 2022 The Authors. Ecological Applications published by Wiley Periodicals LLC on behalf of The Ecological Society of America.
Conflict of interest statement
The authors declare no conflict of interest.
Figures


Similar articles
-
Salinity pulses interact with seasonal dry-down to increase ecosystem carbon loss in marshes of the Florida Everglades.Ecol Appl. 2018 Dec;28(8):2092-2108. doi: 10.1002/eap.1798. Epub 2018 Oct 30. Ecol Appl. 2018. PMID: 30376192
-
Phosphorus alleviation of salinity stress: effects of saltwater intrusion on an Everglades freshwater peat marsh.Ecology. 2019 May;100(5):e02672. doi: 10.1002/ecy.2672. Epub 2019 Apr 3. Ecology. 2019. PMID: 30942486
-
Sea-level rise will reduce net CO2 uptake in subtropical coastal marshes.Sci Total Environ. 2020 Dec 10;747:141214. doi: 10.1016/j.scitotenv.2020.141214. Epub 2020 Jul 28. Sci Total Environ. 2020. PMID: 32795794
-
Climate change projected effects on coastal foundation communities of the Greater Everglades using a 2060 scenario: need for a new management paradigm.Environ Manage. 2015 Apr;55(4):857-75. doi: 10.1007/s00267-014-0375-y. Epub 2014 Oct 14. Environ Manage. 2015. PMID: 25312295 Review.
-
Salinity tolerances and use of saline environments by freshwater turtles: implications of sea level rise.Biol Rev Camb Philos Soc. 2018 Aug;93(3):1634-1648. doi: 10.1111/brv.12410. Epub 2018 Mar 25. Biol Rev Camb Philos Soc. 2018. PMID: 29575680 Review.
References
-
- Aich, S. , McVoy C. W., Dreschel T. W., and Santamaria F.. 2013. “Estimating Soil Subsidence and Carbon Loss in the Everglades Agricultural Area, Florida Using Geospatial Techniques.” Agriculture Ecosystems & Environment 171: 124–33.
-
- Alizad, K. , Hagen S. C., Morris J. T., Bacopoulos P., Bilskie M. V., Weishampel J. F., and Medeiros S. C.. 2016. “A Coupled, Two‐Dimensional Hydrodynamic‐Marsh Model with Biological Feedback.” Ecological Modelling 327: 29–43.
-
- Alongi, D. M. 2020. “Carbon Balance in Salt Marsh and Mangrove Ecosystems: A Global Synthesis.” Journal of Marine Science and Engineering 7(10): 767.
-
- Belyea, L. R. , and Baird A. J.. 2006. “Beyond “The limits to peat bog growth”: Cross‐scale feedback in peatland development.” Ecological Monographs 76: 299–322.
Publication types
MeSH terms
Substances
LinkOut - more resources
Full Text Sources
Miscellaneous
