. 2022 Dec;227(9):2971-2989.
doi: 10.1007/s00429-022-02519-5. Epub 2022 Jun 25.

Functional connectivity correlates of reduced goal-directed behaviors in behavioural variant frontotemporal dementia

Affiliations

Functional connectivity correlates of reduced goal-directed behaviors in behavioural variant frontotemporal dementia

Valérie Godefroy et al. Brain Struct Funct. 2022 Dec.

Abstract

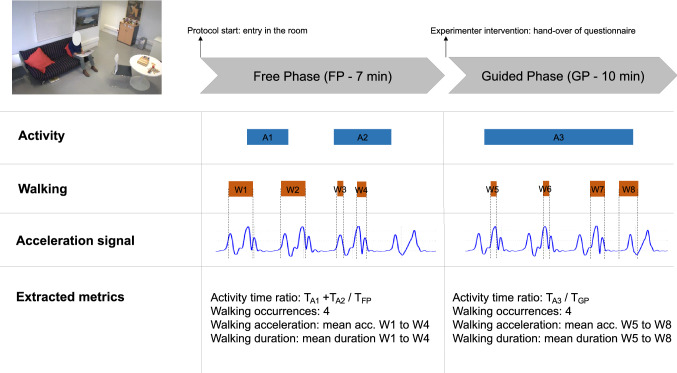
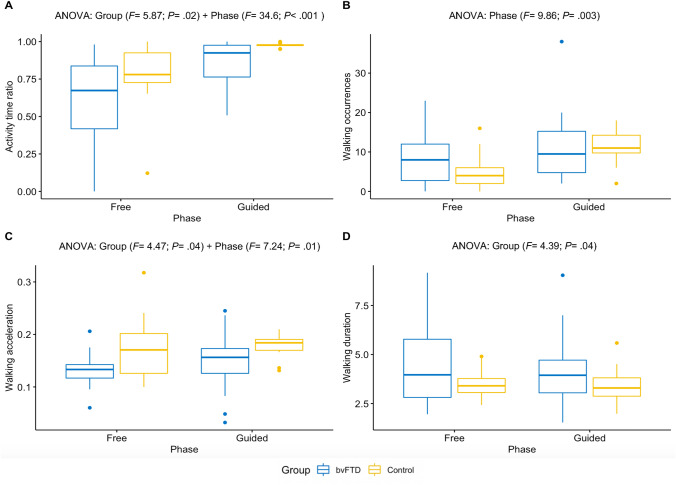
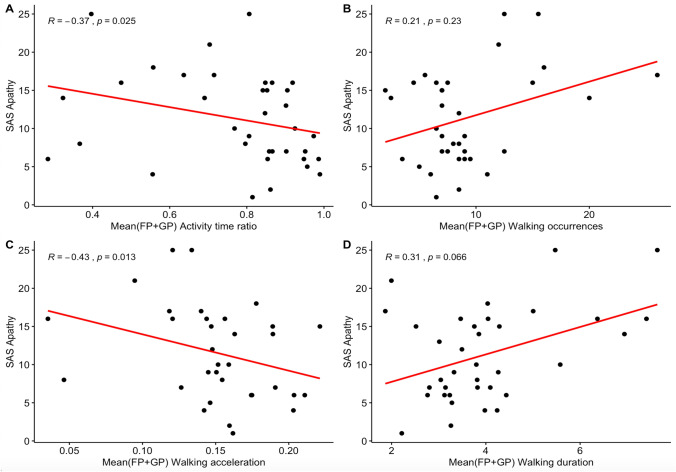
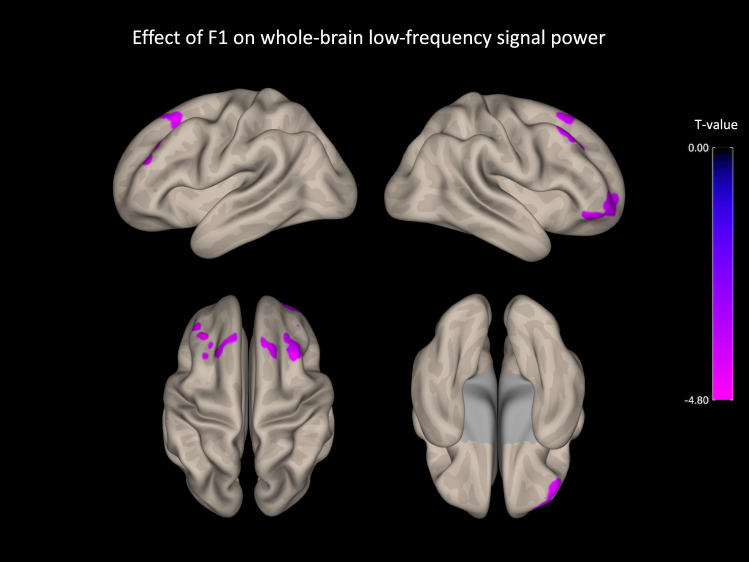
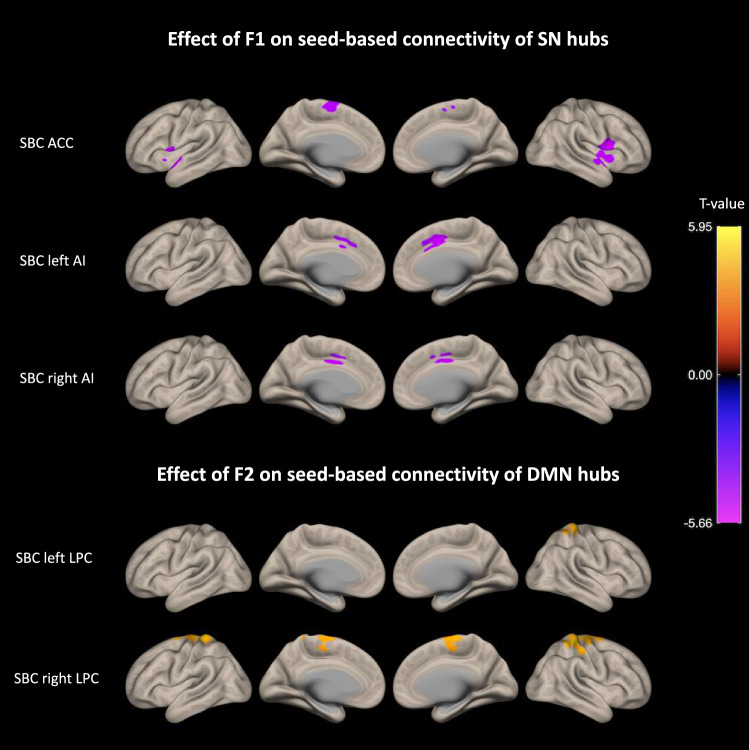
We explored the resting state functional connectivity correlates of apathy assessed as a multidimensional construct, using behavioral metrics, in behavioral variant frontotemporal dementia (bvFTD). We recorded the behavior of 20 bvFTD patients and 16 healthy controls in a close-to-real-life situation including a free phase (FP-in which actions were self-initiated) and a guided phase (GP-in which initiation of actions was facilitated by external guidance). We investigated the activity time and walking episode features as quantifiers of apathy. We used the means ((FP + GP)/2) and the differences (FP-GP) calculated for these metrics as well as measures by questionnaires to extract apathy dimensions by factor analysis. We assessed two types of fMRI-based resting state connectivity measures (local activity and seed-based connectivity) and explored their relationship with extracted apathy dimensions. Apathy in bvFTD was associated with lower time spent in activity combined with walking episodes of higher frequency, lower acceleration and higher duration. Using these behavioral metrics and apathy measures by questionnaires, we disentangled two dimensions: the global reduction of goal-directed behaviors and the specific deficit of self-initiation. Global apathy was associated with lower resting state activity within prefrontal cortex and lower connectivity of salience network hubs while the decrease in self-initiation was related to increased connectivity of parietal default-mode network hubs. Through a novel dimensional approach, we dissociated the functional connectivity correlates of global apathy and self-initiation deficit. We discussed in particular the role of the modified connectivity of lateral parietal cortex in the volitional process.

Keywords: Apathy; Ecological design; Frontotemporal dementia; Goal-directed behavior; Resting-state functional connectivity; fMRI.


Conflict of interest statement

The authors report no competing interests.

Figures

Fig. 1
Fig. 1
Summarized methodology of extraction of behavioral metrics. A1, A2, and A3 figure an example of a possible distribution across time of activity episodes for a participant, A1 and A2 being activity episodes in the free phase and A3 an activity episode in the guided phase. In this specific case, the computation of activity time ratio is described, for instance for the free phase, as the sum of the durations of A1 and A2 activity episodes divided by the total duration of the free phase. Similarly, W1–W8 figure a possible distribution across time of walking episodes for a participant. In this specific case, walking metrics, for instance for the free phase, are computed as follows: walking occurrences is the total number of walking episodes in the free phase (W1–W4), walking acceleration is the mean acceleration of walking episodes W1–W4, walking duration is the mean duration of walking episodes W1–W4
Fig. 2
Fig. 2
Effects of group and phase on four metrics quantifying goal-directed behaviors. A Activity time ratio. B Occurrences of walking episodes. C Mean acceleration of walking episodes. D Mean duration of walking episodes. BvFTD patients: N = 20; controls: N = 16. Only significant effects obtained from ANOVA tests are displayed for each of the four metrics. Extreme outlier measures were identified and removed: 3 measures of activity time ratio (1 control in free phase/2 controls in guided phase), 2 measures of walking acceleration (1 bvFTD in free phase/1 control in guided phase) and 1 measure of walking duration (1 control in free phase). In the boxplots: horizontal lines represent the first, second (median) and third quartiles of the distribution; vertical bars above and below the boxes figure the lowest 25% and the highest 25% of values, respectively; the dots indicate outliers (which were not identified as extreme outliers)
Fig. 3
Fig. 3
Correlations between apathy measured by the SAS and the four behavioral metrics. A Activity time ratio averaged on free and guided phases. B Occurrences of walking episodes averaged on free and guided phases. C Mean acceleration of walking episodes averaged on free and guided phases. D Mean duration of walking episodes averaged on free and guided phases. BvFTD patients: N = 20; Controls: N = 16. R is the Spearman’s rank correlation coefficient between the two variables; SAS, Starkstein Apathy Scale
Fig. 4
Fig. 4
Negative association between F1 and fALFF index of signal power in several regions of the prefrontal cortex. N = 34 (bvFTD: N = 18/controls: N = 16). Effects are corrected for age and sex, and for family-wise error at the level of individual clusters at P < 0.05. F1, global reduction of goal-directed behaviors
Fig. 5
Fig. 5
Associations found between F1/F2 and the connectivity of SN/DMN hubs. We observed a negative association between F1 and the seed-based connectivity of SN hubs and on the opposite, a positive association between F2 and the seed-based connectivity of two DMN hubs. N = 34 (bvFTD: N = 18/controls: N = 16). Effects are corrected for age and sex, and for family-wise error at the level of individual clusters at P < 0.05. SBC, seed-based connectivity; F1, global reduction of goal-directed behaviors; F2, specific deficit of self-initiation

References

    1. Ang Y-S, Lockwood P, Apps MAJ, et al. Distinct subtypes of apathy revealed by the apathy motivation index. PLoS ONE. 2017;12:e0169938. doi: 10.1371/journal.pone.0169938. - DOI - PMC - PubMed
    1. Batrancourt BM, Lecouturier K, Ferrand-Verdejo J, et al. Exploration deficits under ecological conditions as a marker of apathy in frontotemporal dementia. Front Neurol. 2019;10:941. doi: 10.3389/fneur.2019.00941. - DOI - PMC - PubMed
    1. Bonnelle V, Manohar S, Behrens T, Husain M. Individual differences in premotor brain systems underlie behavioral apathy. Cereb Cortex. 2016;26:807–819. - PMC - PubMed
    1. Cattell RB. The scree test for the number of factors. Multivar Behav Res. 1966;1:245–276. doi: 10.1207/s15327906mbr0102_10. - DOI - PubMed
    1. Chare L, Hodges JR, Leyton CE, et al. New criteria for frontotemporal dementia syndromes: clinical and pathological diagnostic implications. J Neurol Neurosurg Psychiatry. 2014;85:865–870. doi: 10.1136/jnnp-2013-306948. - DOI - PubMed

LinkOut - more resources