. 2022 Aug 18;82(16):3103-3118.e8.
doi: 10.1016/j.molcel.2022.06.001. Epub 2022 Jun 24.

Machine-learning-optimized Cas12a barcoding enables the recovery of single-cell lineages and transcriptional profiles

Affiliations

Machine-learning-optimized Cas12a barcoding enables the recovery of single-cell lineages and transcriptional profiles

Nicholas W Hughes et al. Mol Cell. .

Abstract

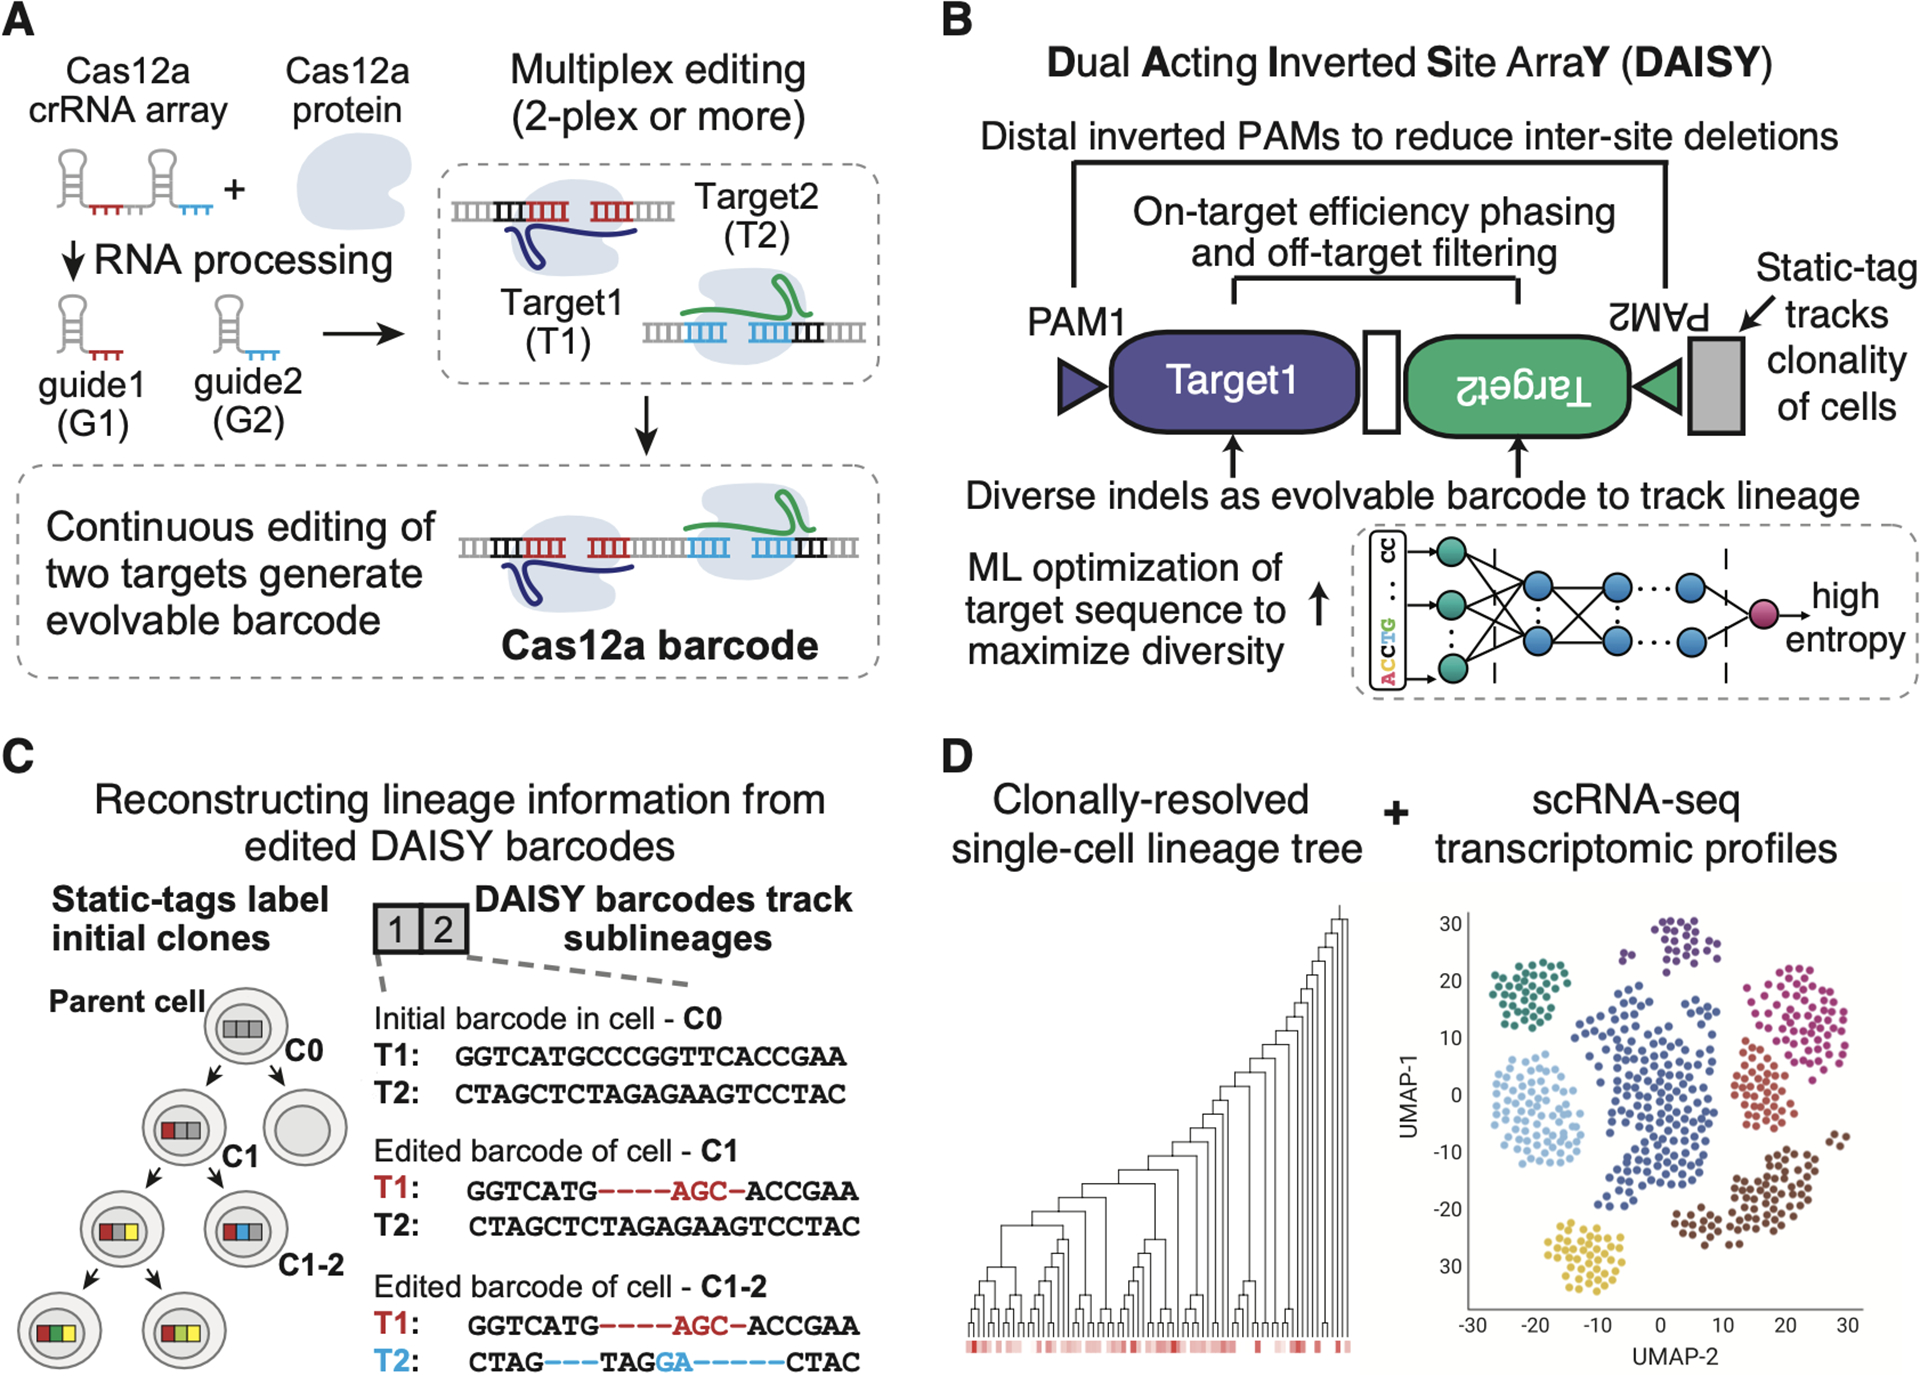
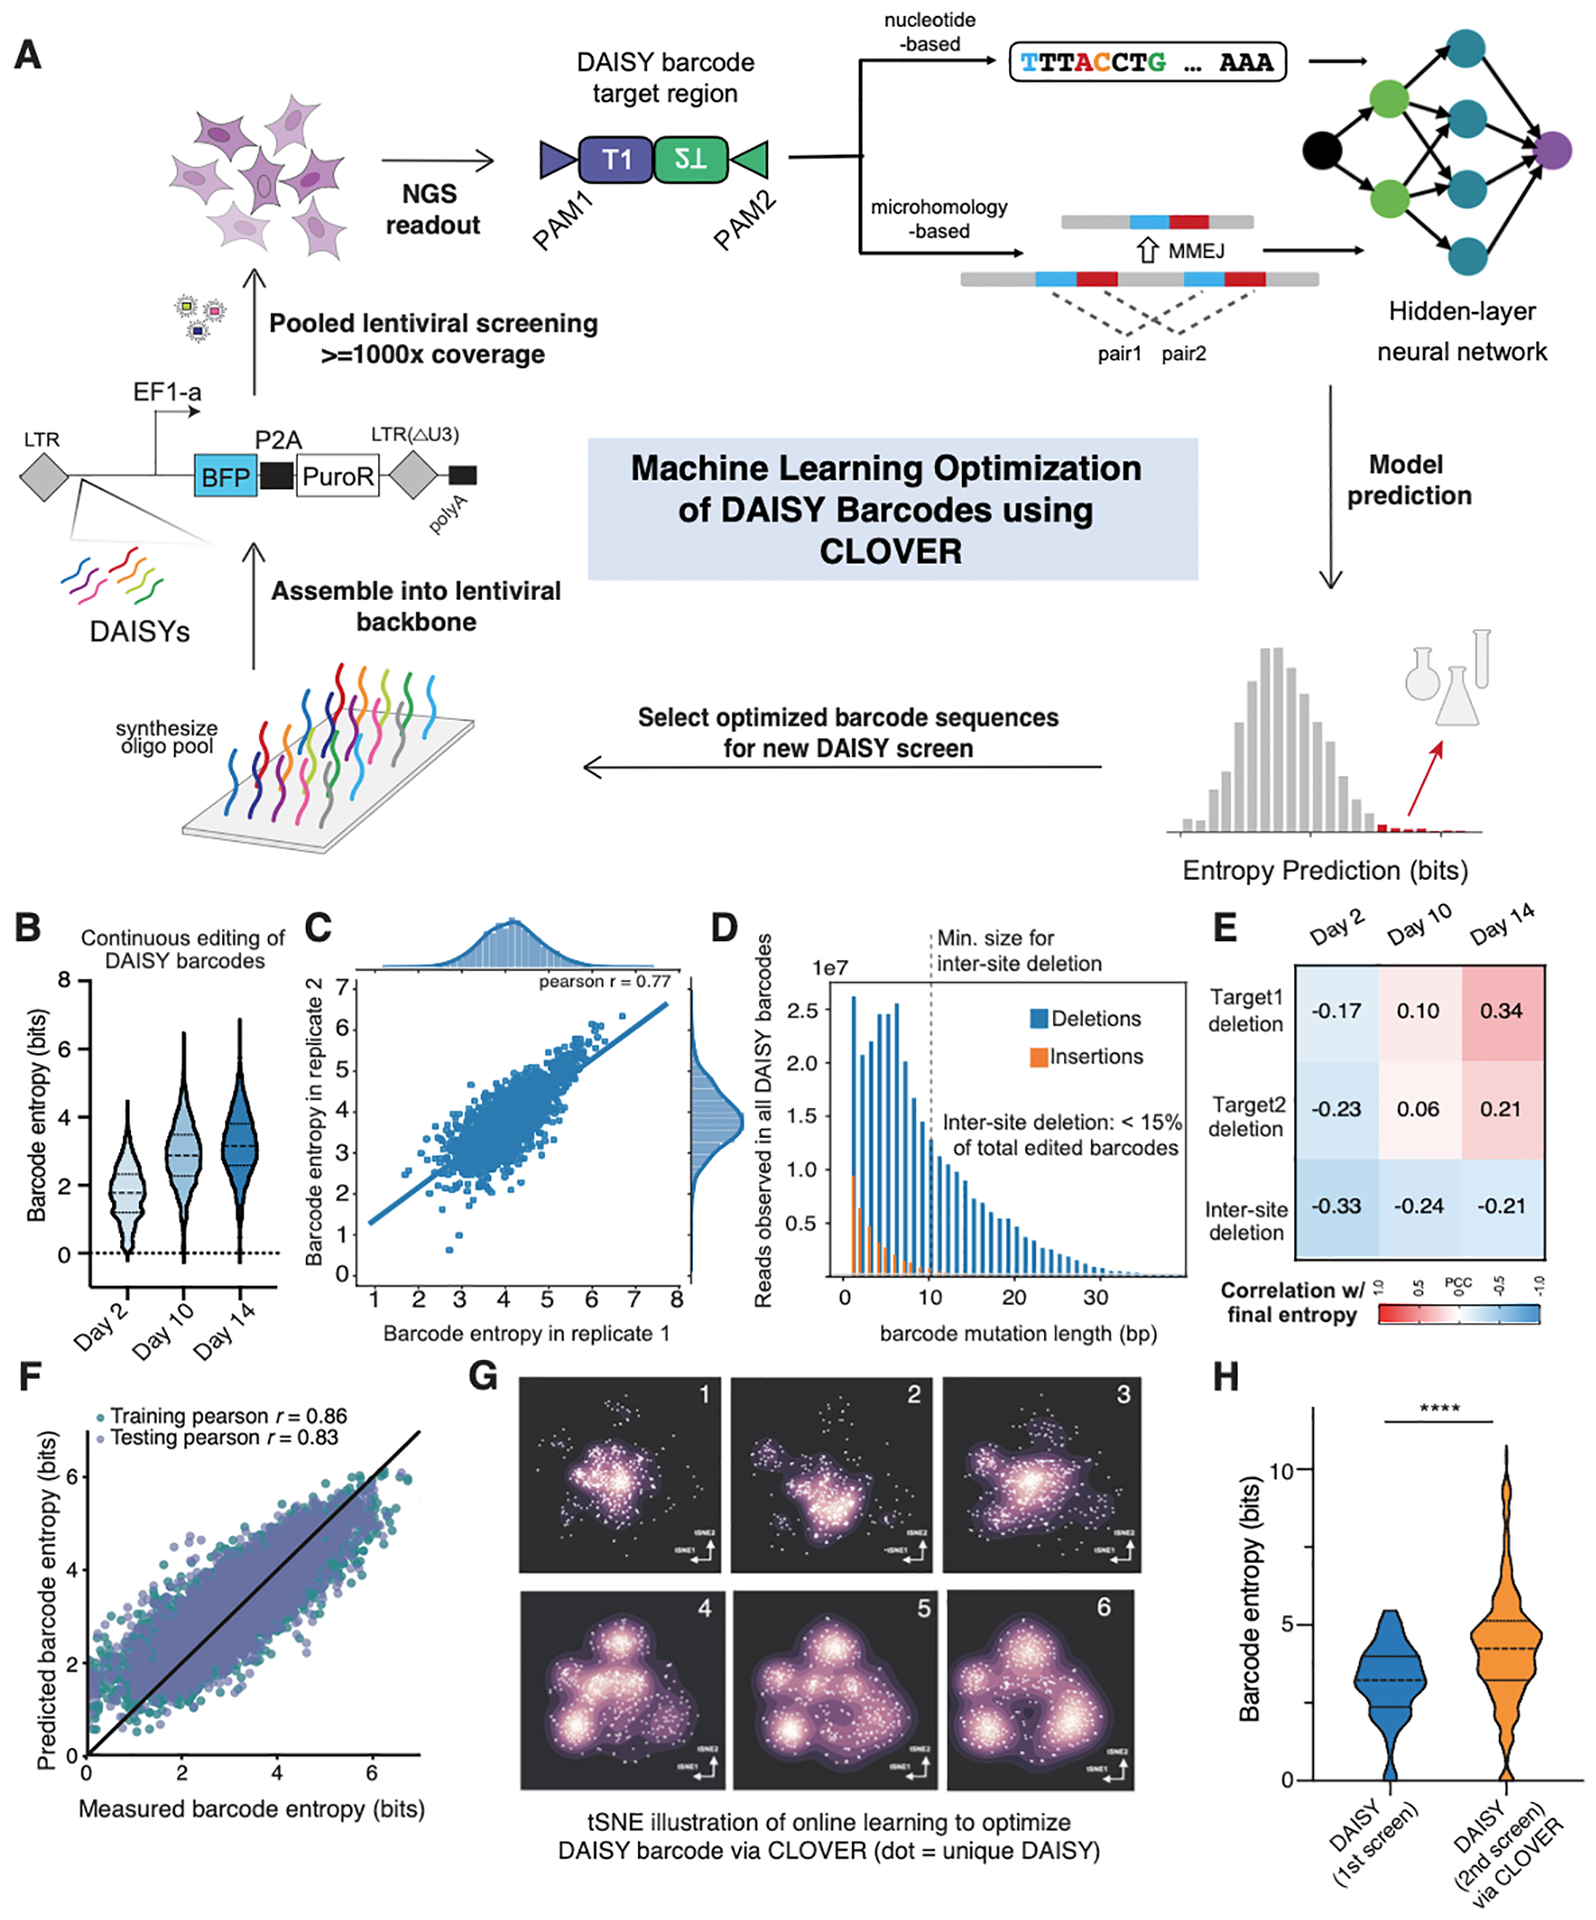
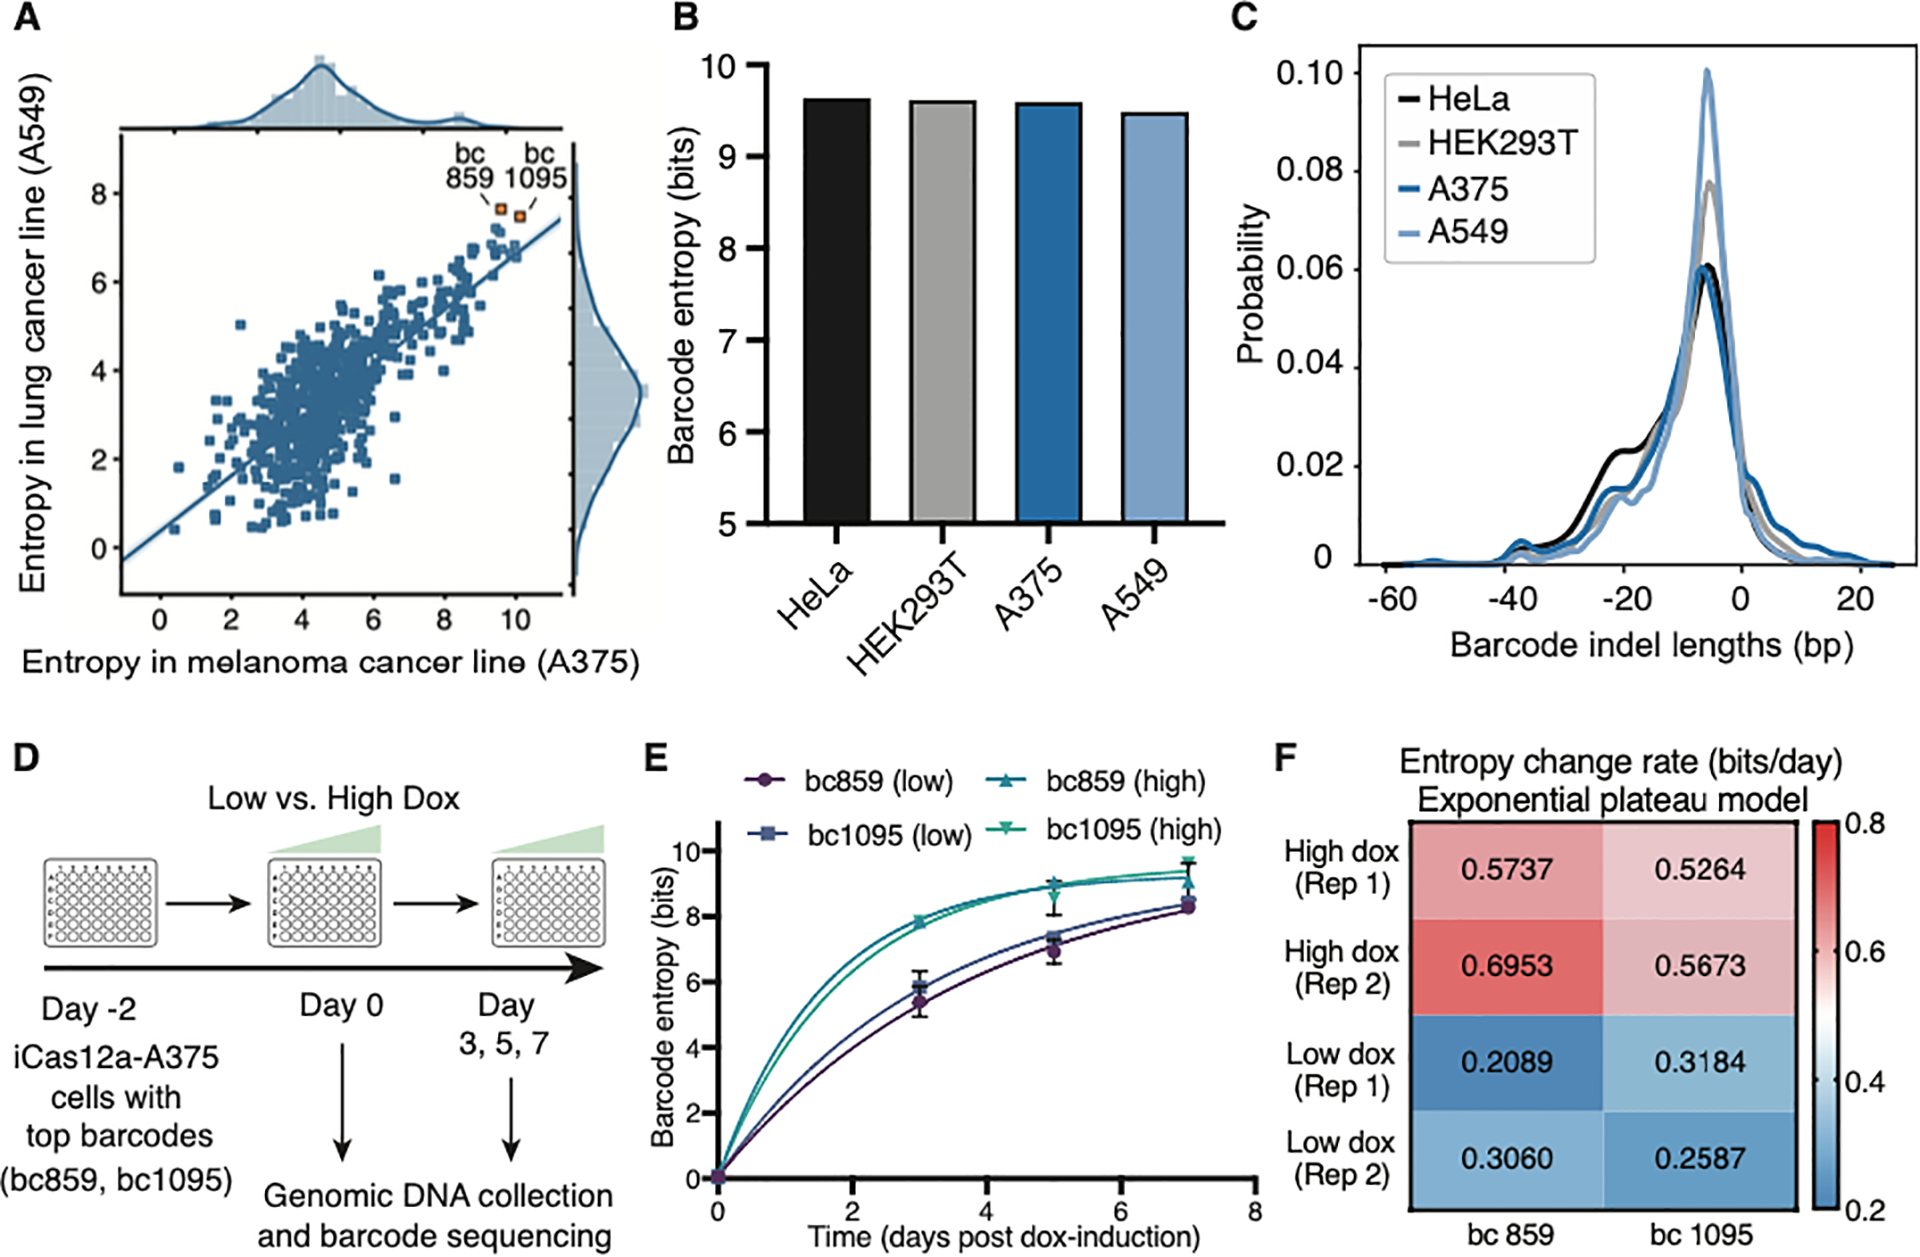
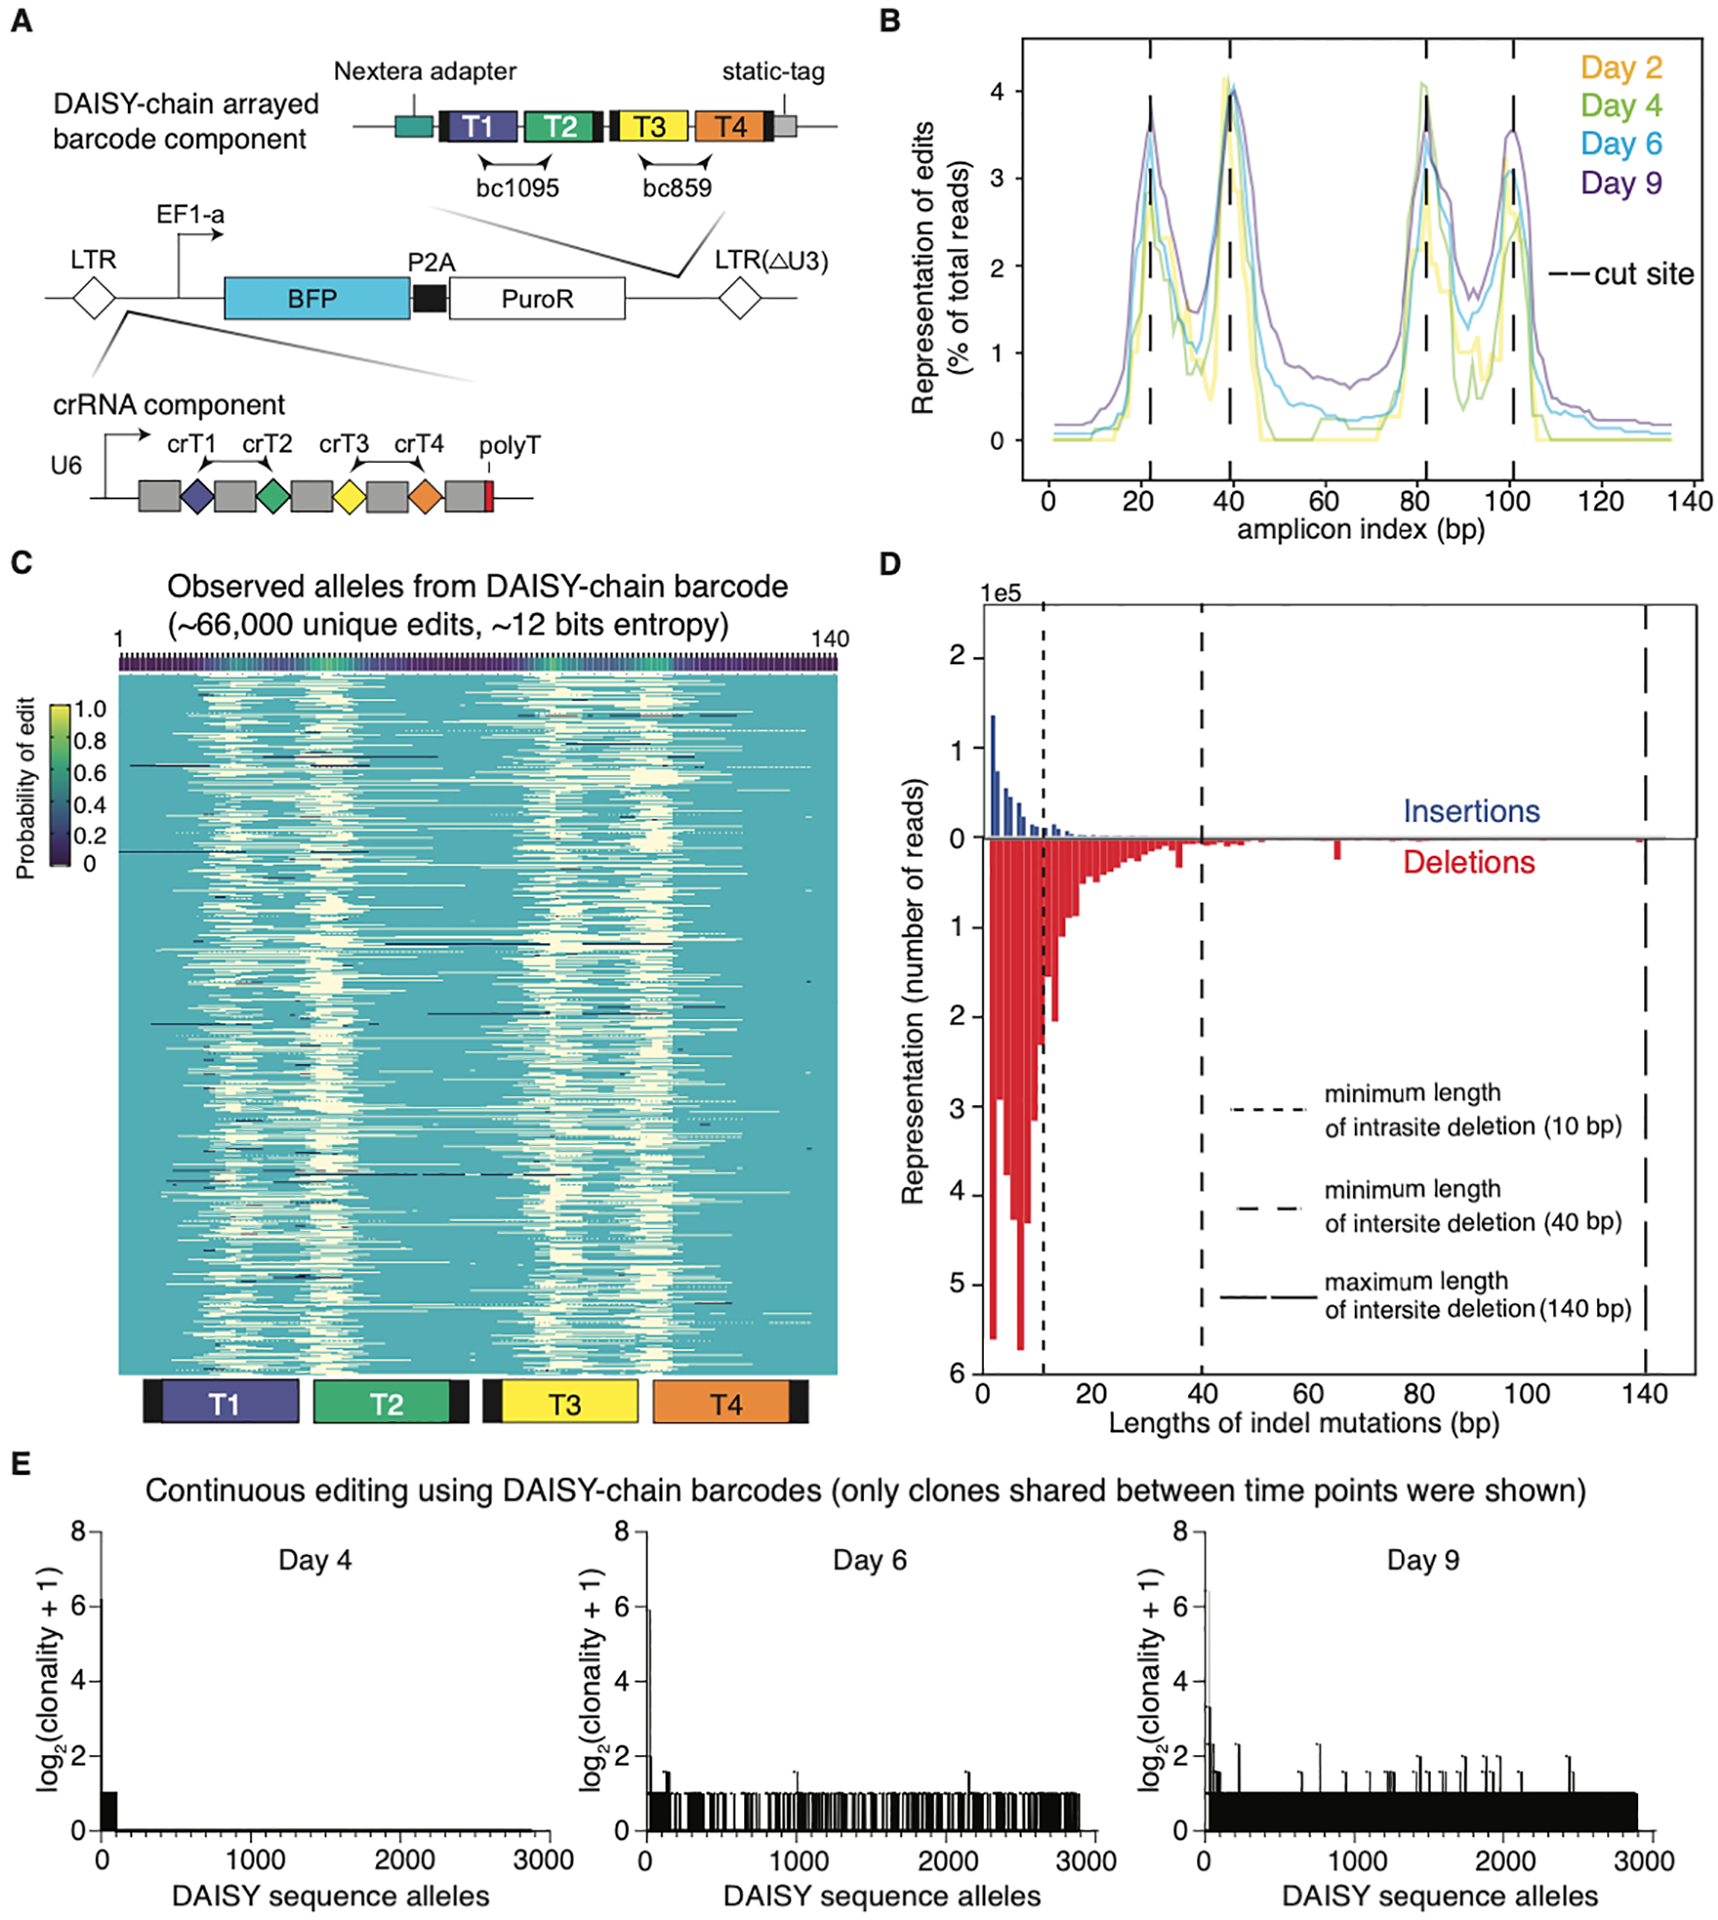
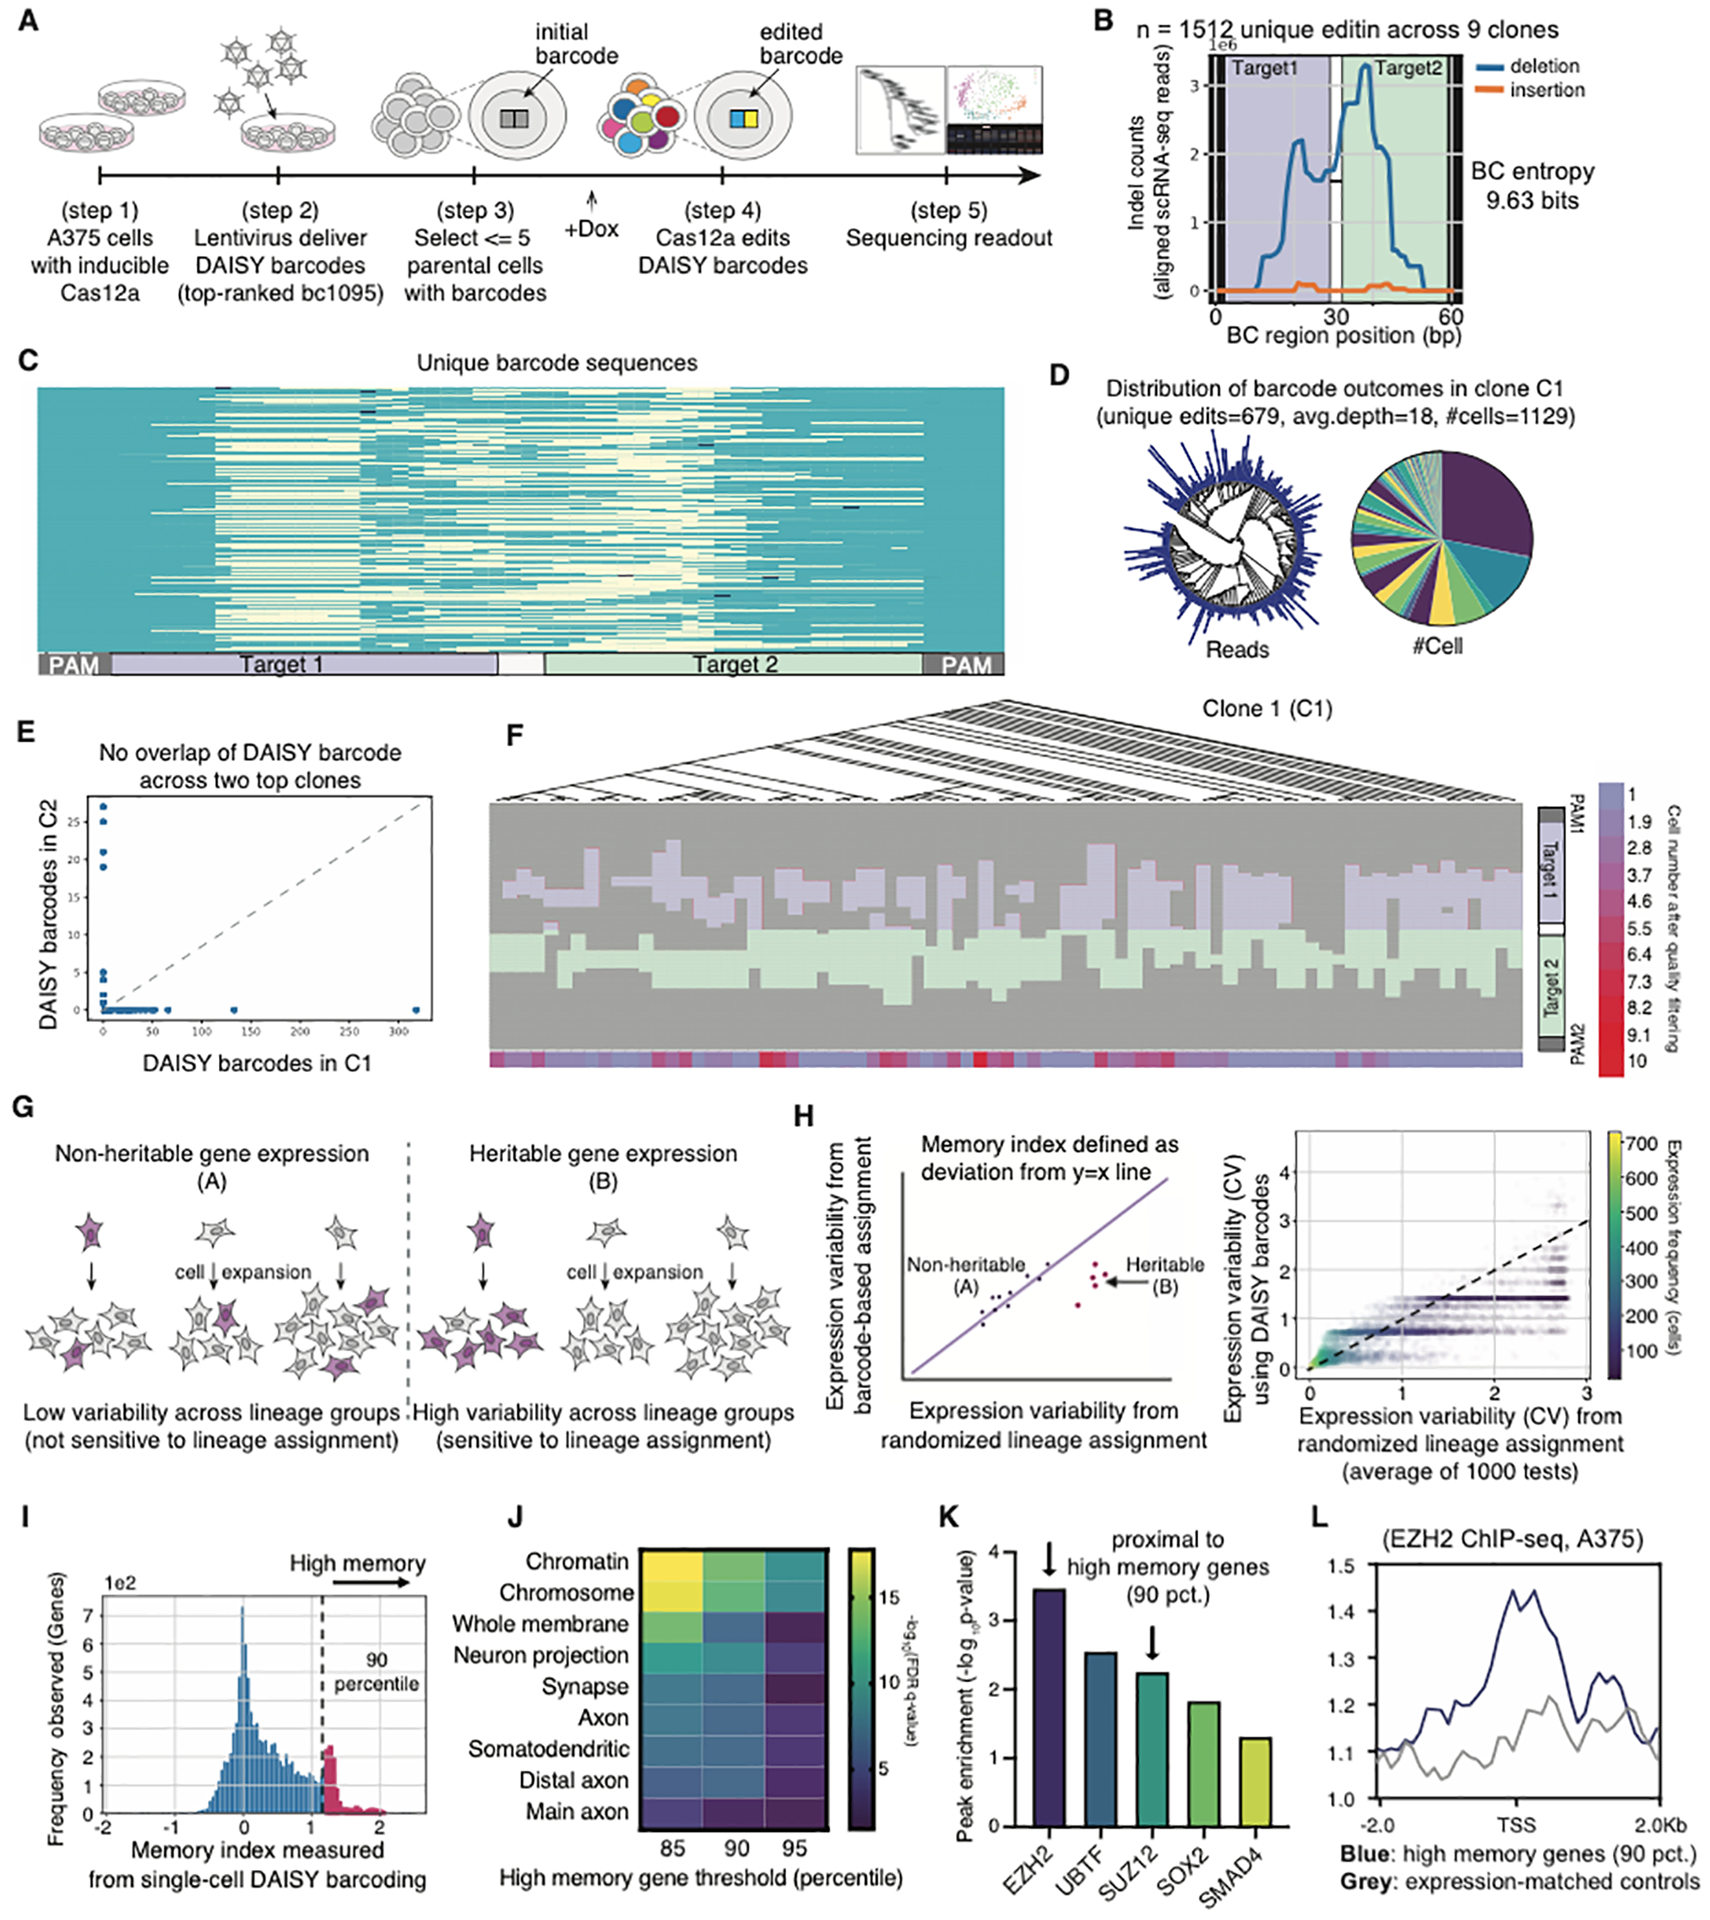
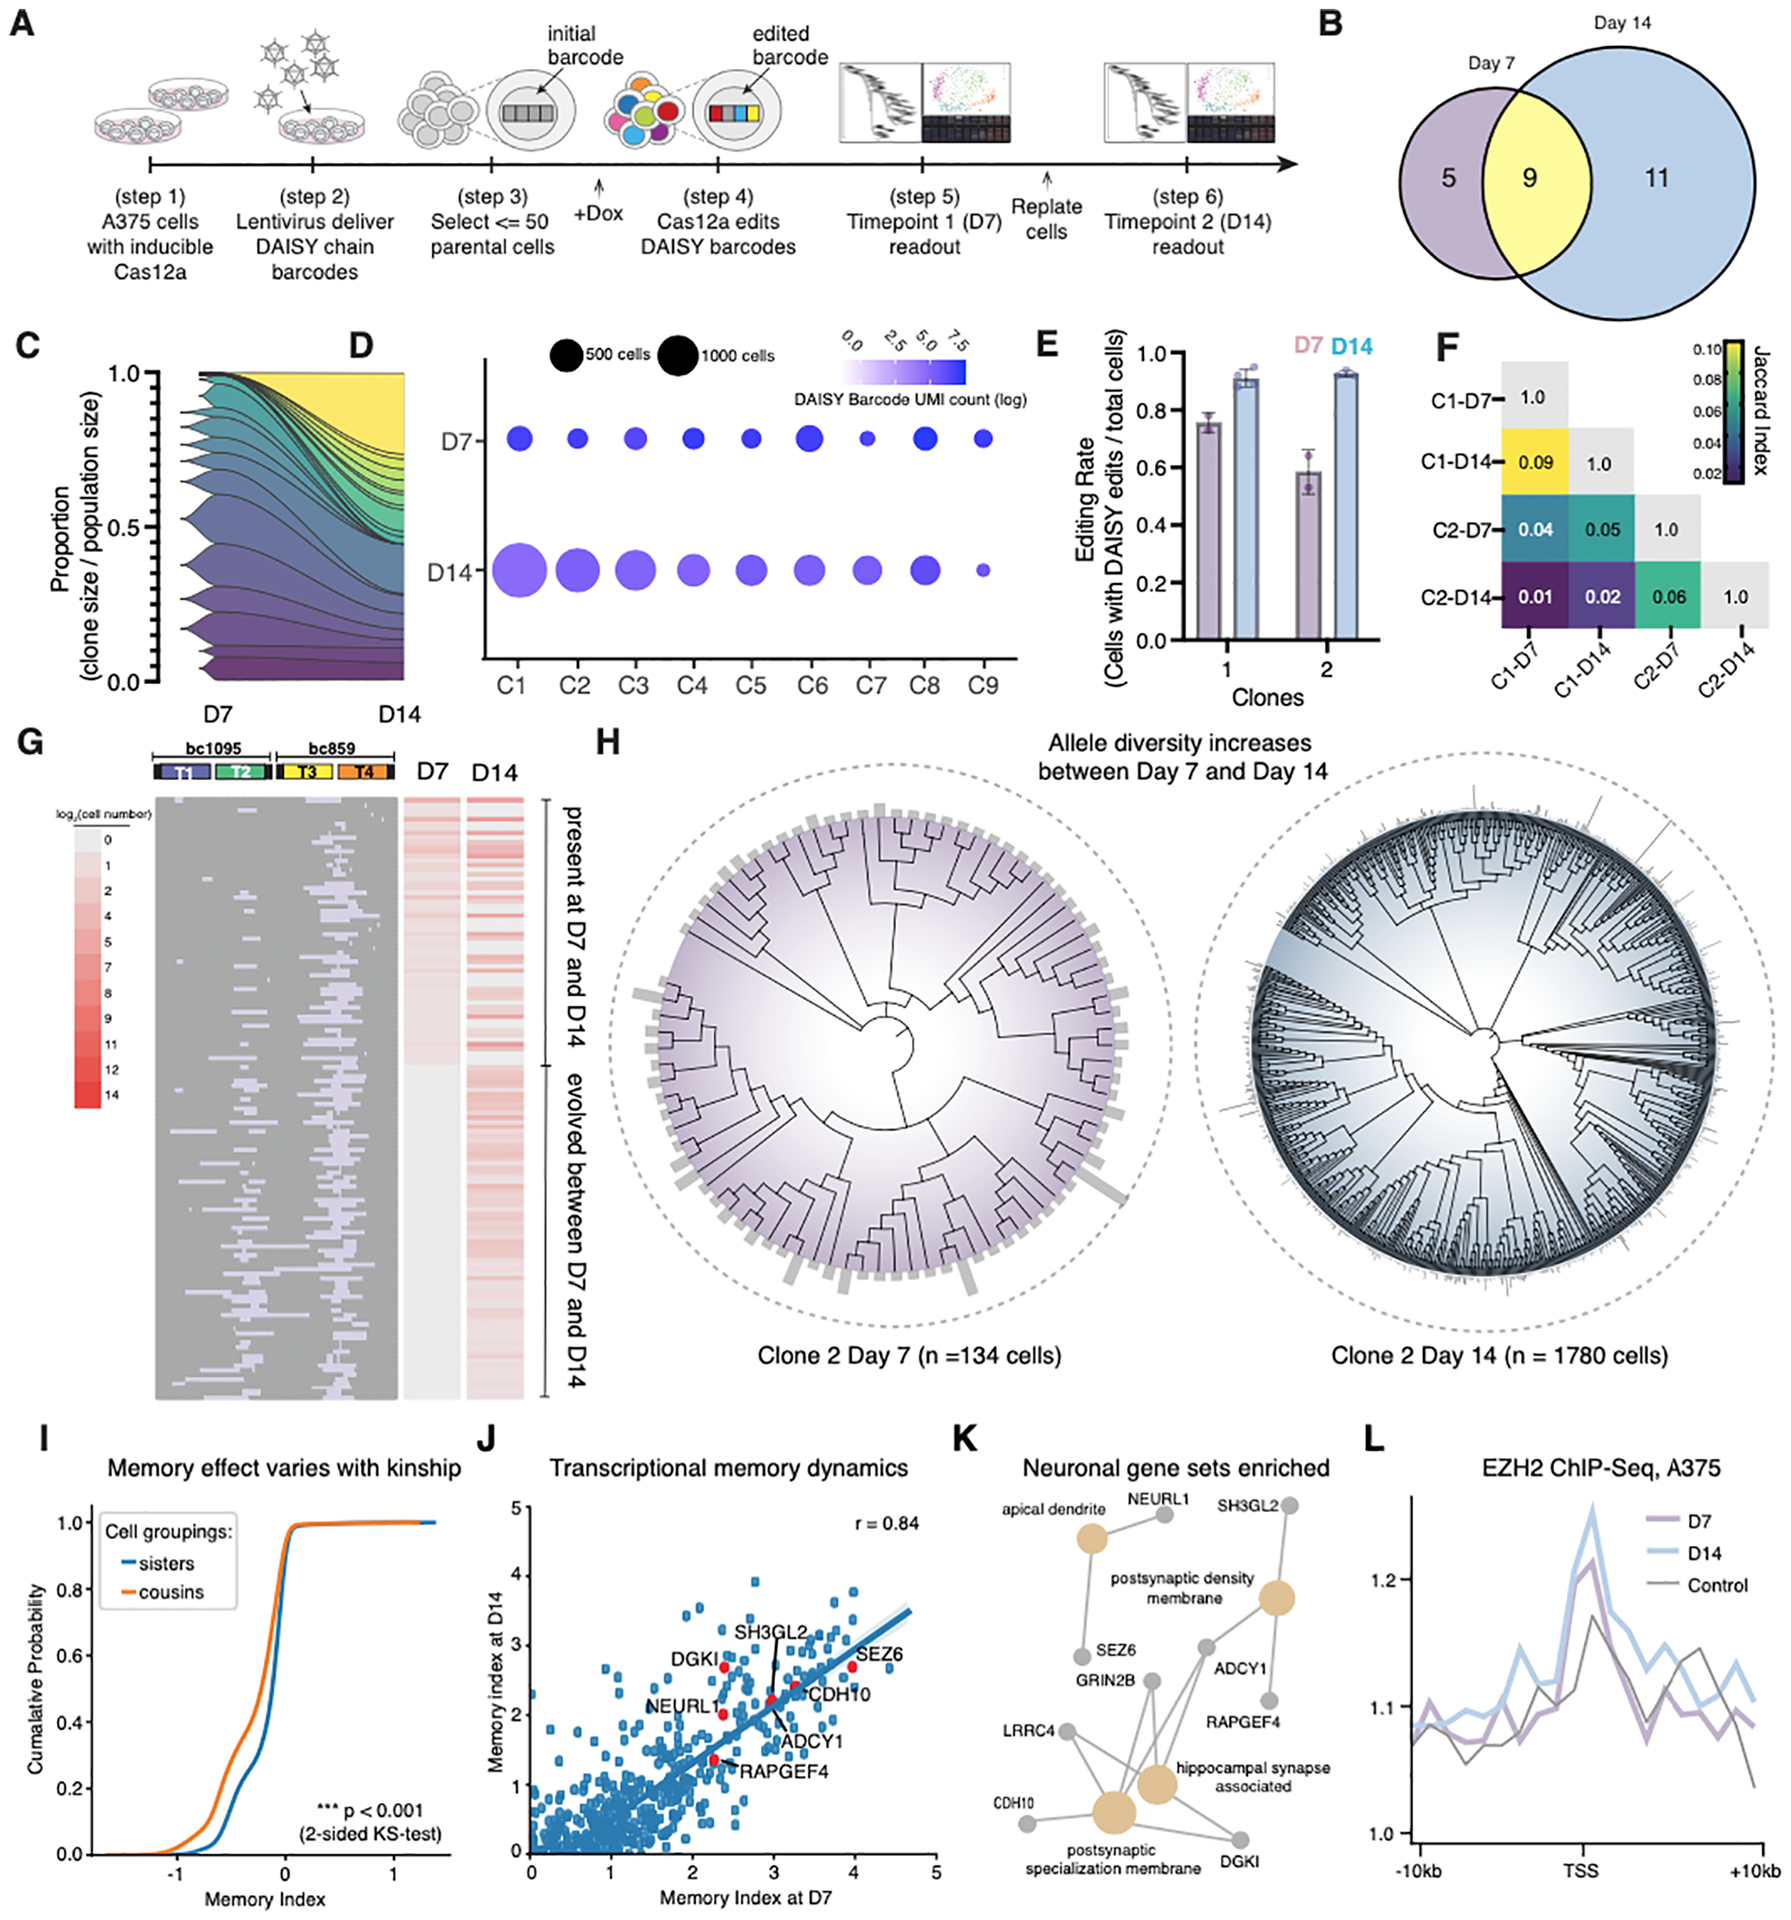
The development of CRISPR-based barcoding methods creates an exciting opportunity to understand cellular phylogenies. We present a compact, tunable, high-capacity Cas12a barcoding system called dual acting inverted site array (DAISY). We combined high-throughput screening and machine learning to predict and optimize the 60-bp DAISY barcode sequences. After optimization, top-performing barcodes had ∼10-fold increased capacity relative to the best random-screened designs and performed reliably across diverse cell types. DAISY barcode arrays generated ∼12 bits of entropy and ∼66,000 unique barcodes. Thus, DAISY barcodes-at a fraction of the size of Cas9 barcodes-achieved high-capacity barcoding. We coupled DAISY barcoding with single-cell RNA-seq to recover lineages and gene expression profiles from ∼47,000 human melanoma cells. A single DAISY barcode recovered up to ∼700 lineages from one parental cell. This analysis revealed heritable single-cell gene expression and potential epigenetic modulation of memory gene transcription. Overall, Cas12a DAISY barcoding is an efficient tool for investigating cell-state dynamics.

Keywords: CRISPR barcoding; Cas12a; PRC2; high throughput screening; lineage tracking; machine learning; melanoma; online learning optimization; single cell genomics; transcriptional memory.


Conflict of interest statement

Declaration of interests Stanford University has filed patent applications with L.C. and N.W.H. as inventors on the basis of this work. L.C. is a member of the scientific advisory board of Arbor Biotechnologies.

Figures

Figure 1.
Figure 1.. Overview of Cas12a-based DAISY barcodes and pipeline to couple lineage information with single-cell transcriptomic profiling.
(A) Design of Cas12a-based barcode system, in which a single crRNA array with two guides (G1/G2) could be processed to edit two target sites within a barcode. (B) Dual acting inverted site array (DAISY) barcode design with two crRNA-target pairs. The guide sequences were selected to have phased editing efficiency (Seq-deepCpf1) and low off-target scores (FlashFry), see Methods for details. (C) Editing outcomes at the target sites (T1/T2) within a barcode are used to place cells within a lineage tree. Here, an initial edit in T1 allows for grouping of descendent daughter cells that contain differentiating edits in T2. (D) Simultaneous recovery of the transcriptome of a cell and an expressed DAISY barcode enables lineage tracking and cell state classification.
Figure 2.
Figure 2.. Comparison of Cas9 and Cas12a for gene editing-based cell barcoding.
(A) Design of the endogenous editing experiment to compare Cas12a/Cas9 editing outcomes using transient transfection. (B) Gene-editing efficiencies across endogenous targets showing comparable levels of indel formation between Cas12a/Cas9. (C) Endogenous target sequences indicating the proximal PAM sequences (Cas12a in blue, Cas9 in purple). (D) Entropy of Cas12a and Cas9-based editing outcomes at endogenous targets. (E) Stacked bar chart comparing the editing outcome distribution of Cas12a- vs. Cas9-based editing outcomes. Bar areas correspond to the sequencing reads frequency of each unique indel outcome. (F) Design of synthetic barcode experiments to compare Cas12a/Cas9 using lentiviral vectors and doxycycline-inducible cell lines. (G) Vector designs for Cas12a editing (top) and Cas9 editing (middle) of a common two-target barcode (bottom). We picked 3 published barcodes from a published Cas9 study (Bowling et al., 2020). (H) Entropy of editing outcomes within each barcode after doxycycline-induced Cas12a/Cas9 expression. (I) Stacked bar chart comparing editing outcome distribution as in panel e. Unless otherwise noted, all statistical comparison in this and following figures were performed via a t-test with 1% false-discovery rate (FDR) using a two-stage step-up method of Benjamini, Krieger and Yekutieli, * (p < 0.05); ** (p < 0.01); *** (p < 0.001).
Figure 3.
Figure 3.. High-throughput screening with machine learning optimization to generate high-capacity DAISY barcodes.
(A) Overall design of CLOVER pipeline to optimize DAISY barcode sequences via iterative pooled screening and machine learning modeling. (B) Distribution of barcode entropies across all DAISY barcodes at each timepoint. (C) Barcode entropy measured at Day-14 from two biological replicates, showing consistent results from separate lentiviral transductions. (D) Indel length distribution across all barcodes where the minimum inter-site deletion length is indicated. (E) Pearson Correlation Coefficients (PCC) between indel outcome types at each timepoint and the final barcode entropy across all DAISY barcodes. (F) Neural network model accurately predicts entropy of DAISY barcodes. (G) 6 rounds of path-regularized online learning were performed (round indicated at top right of each panel). 96 designs are chosen through path regularization (see Methods) in each round (5 simulations total). Therefore, each plot contains 96×5 designs, where the Kernel Density Estimation (KDE) is based on the first two tSNE coordinates. The exploration converges on 4 local maxima as indicated by increased point density after 6 rounds. (H) Distributions of barcode entropy from DAISY barcodes in 1st screen (initial pool) and from 2nd screen (CLOVER-optimized) in A375 cells. * (p < 0.05); ** (p < 0.01); *** (p < 0.001), **** (p < 0.0001).
Figure 4.
Figure 4.. ML-optimized DAISY barcodes have robust performance across cell lines with doxycycline-controllable tunability.
(A) Comparison of barcode entropy demonstrating consistent performance of CLOVER-optimized DAISY barcodes in A375 melanoma and A549 lung adenocarcinoma cell lines. Top barcodes used in later experiments are highlighted. (B) Comparison of total barcode entropy across all clones within each indicated cell type. (C) Consistent indel mutation length distributions of editing outcomes within the DAISY barcode (bc859) across cell lines (D) Experiment design to measure doxycycline-dependent tunability of top DAISY barcodes in A375 cells. Low and High-dox were 40 and 1000 ng/mL. (E) Change in the barcode entropy over time using low and high-dox. (F) Rate kinetics of barcode entropy (based on the Exponential plateau model) across doxycycline dosages and biological replicates.
Figure 5.
Figure 5.. Concatenation of DAISY barcode into a high-capacity DAISY chain barcode array.
(A) Design of a two-DAISY barcode array using top optimized DAISY designs (bc859 and bc1095), encoded in a lentiviral vector. (B) Editing events distribution within the DAISY barcode array over the 9-day experiment. (C) Observed barcode alleles generated by the 120-bp DAISY barcode array, with light yellow showing deletions, and dark blue showing insertions. The probability of editing derived from all alleles are shown on top, and the position of four target sites are shown at bottom. (D) Lengths of indel mutations from all alleles using DAISY chain barcode array. Dash lines marked inter-site deletion limits. (E) The number of clones associated with each DAISY sequence allele is plotted on the y-axis for three different timepoints (Day-4, Day-6, and Day-9). Each allele is given an index on the x-axis.
Figure 6.
Figure 6.. Single-cell demonstration with optimized DAISY barcodes recovers lineage history and transcriptomic information.
(A) Design of single-cell experiment using lentiviral delivery of an optimized DAISY barcode (scDAISY-seq). (B) Distribution of editing outcomes within the DAISY barcode (BC) region. Barcode entropy from single-cell data shown on right. (C) Unique barcode sequences recovered from scRNA-seq with yellow marks deletions and dark blue marks insertions. (D) Lineage tree reconstructed from single-cell barcode sequences of largest Clone 1 (C1), read counts shown in log scale. Pie charts on the right showing the cell distribution of identified unique lineages. (E) Homoplasy check showing no overlap between DAISY barcode sequences recovered from the largest two clones C1 and C2. (F) Reconstructed lineage tree from C1 using DAISY barcodes. Observed edits are illustrated below leaves of the tree. Purple and green bars indicate edits within two target sites. Heatmaps indicate cell numbers after quality filtering. (G) Illustration of transcriptional memory showing that an expressed gene (amber) can exhibit non-heritable/heritable expression patterns depending on if its expression level persists within certain lineages. (H) (Left) Quantitative definition of a memory index using single-cell transcriptomic data with randomized (x-axis) vs. barcode-defined (y-axis) lineage assignments. (Right) Data from scDAISY-seq were analyzed to calculate memory index for each gene. CV is the coefficient of variation of gene expression (see Methods). (I) The distribution of memory index values across all genes. (J) Top significantly enriched gene sets from found high memory genes. (K) Top 5 proteins enriched proximally to the high memory genes (90 percentile) based on ENCODE data. (L) ChIP-Seq peak profiles of high memory genes (90 percentile) in blue versus control genes (expression-matched, see Methods) in grey.
Figure 7.
Figure 7.. Clonal resampling over time using scDAISY-seq reveals features of transcriptional memory dynamics.
(A) Design of the time course scDAISY-seq experiment with clonal resampling. A375 cells expressing inducible AsCas12a were transduced with lentivirus containing DAISY barcodes. Cells were bottlenecked and allowed to proliferate for collections 7 and 14-days post doxycycline induction. (B) Venn diagram of the resampling of top-ranked clones by population size. (C) Fish plot of the change in proportions of the top-ranked clone sizes between Day-7 and Day-14. (D) Dot plot of the size and expression level across the top-ranked clones (E) Measurement of editing rate within two top represented clones over time. (F) Sets of alleles within two top represented clones were compared to each other using the Jaccard Index of similarity, where complete intersection of sets is 1.0 and complete independence of sets is 0.0. (G) Representative profile of indel formation within DAISY chain barcode from one biological replicate. Indels marked with purple, and cell numbers marked with a heatmap. (H) Phylogenetic reconstructions of a dominant clonal population at Day-7 and Day-14. Subclonal lineages defined by the DAISY barcode state are at the leaves of the tree and their population sizes are indicated by the adjacent bar heights with the maximum height of 10 cells (left) and 50 cells (right). The height of the bar scales linearly with population size. (I) Change in the distribution of the memory index within a clone (C2) when grouping cousins together versus sister cell groupings. (J) Memory index of genes with positive indices (averaged across all top represented clones) at Day-7 versus Day-14 (Pearson Correlation Coefficient is shown at the top right). A representative group of high memory genes is highlighted in red. (K) Gene set enrichment analysis of high memory genes reveals neuronal gene sets that include dendritic and synaptic biological components. (L) EZH2 ChIP-Seq of high memory genes across time using genes within the top 85th percentile of the memory index distribution.

Similar articles

Cited by

References

    1. Abbasi-yadkori Y, Pál D, and Szepesvári C (2011). Improved Algorithms for Linear Stochastic Bandits. Adv. Neural Inf. Process. Syst 24.
    1. Adamson B, Norman TM, Jost M, Cho MY, Nuñez JK, Chen Y, Villalta JE, Gilbert LA, Horlbeck MA, Hein MY, et al. (2016). A Multiplexed Single-Cell CRISPR Screening Platform Enables Systematic Dissection of the Unfolded Protein Response. Cell 167, 1867–1882.e21. - PMC - PubMed
    1. Alemany A, Florescu M, Baron CS, Peterson-Maduro J, and van Oudenaarden A (2018). Whole-organism clone tracing using single-cell sequencing. Nature 556, 108–112. - PubMed
    1. Allen F, Crepaldi L, Alsinet C, Strong AJ, Kleshchevnikov V, De Angeli P, Páleníková P, Khodak A, Kiselev V, Kosicki M, et al. (2018). Predicting the mutations generated by repair of Cas9-induced double-strand breaks. Nat. Biotechnol - PMC - PubMed
    1. Ashburner M, Ball CA, Blake JA, Botstein D, Butler H, Cherry JM, Davis AP, Dolinski K, Dwight SS, Eppig JT, et al. (2000). Gene ontology: tool for the unification of biology. The Gene Ontology Consortium. Nat. Genet 25, 25–29. - PMC - PubMed

Publication types