. 2022 Aug 18;82(16):3045-3060.e11.
doi: 10.1016/j.molcel.2022.06.005. Epub 2022 Jun 24.

Methionine oxidation activates pyruvate kinase M2 to promote pancreatic cancer metastasis

Affiliations

Methionine oxidation activates pyruvate kinase M2 to promote pancreatic cancer metastasis

Dan He et al. Mol Cell. .

Abstract

Cancer mortality is primarily a consequence of its metastatic spread. Here, we report that methionine sulfoxide reductase A (MSRA), which can reduce oxidized methionine residues, acts as a suppressor of pancreatic ductal adenocarcinoma (PDA) metastasis. MSRA expression is decreased in the metastatic tumors of PDA patients, whereas MSRA loss in primary PDA cells promotes migration and invasion. Chemoproteomic profiling of pancreatic organoids revealed that MSRA loss results in the selective oxidation of a methionine residue (M239) in pyruvate kinase M2 (PKM2). Moreover, M239 oxidation sustains PKM2 in an active tetrameric state to promote respiration, migration, and metastasis, whereas pharmacological activation of PKM2 increases cell migration and metastasis in vivo. These results demonstrate that methionine residues can act as reversible redox switches governing distinct signaling outcomes and that the MSRA-PKM2 axis serves as a regulatory nexus between redox biology and cancer metabolism to control tumor metastasis.

Keywords: PKM2; cancer metabolism; glucose oxidation; metastasis; methionine oxidation; pancreatic cancer; redox signaling.


Conflict of interest statement

Declaration of interests C.J.C., F.D.T., and A.H.C. are inventors on patent applications related to the redox-active reagents for methionine conjugation. C.J.T. is listed as an inventor on patents related to PKM2 activators. The remaining authors declare no competing interests.

Figures

Figure 1.
Figure 1.. Methionine sulfoxide reductase A (MSRA) is a suppressor of pancreatic cancer metastasis
(A and B) Immunohistochemical staining (A) and quantification (B) of MSRA in patient-derived pancreatic tissues obtained from surgical resection (Normal, PanIN, PDA) or rapid autopsy (patient-matched PDA and liver metastasis). PanIN, pancreatic intraepithelial neoplasia. Data are min to max; lines indicate median. (C and D) Immunoblot analysis of MSRA and MSRB proteins (C), and quantification of MSRA expression (D) in murine normal (n = 6), tumor (n = 7), and metastasis (n = 6) organoid lines; lines indicate median. (E) Metastatic incidence of mice after orthotopic injection of PDAT4 cells expressing sgRosa26 (n = 13) or sgMsrA (n = 12). (F) Brightfield images of pancreatic ductal organoids cultured in Matrigel for 96 hours. Immunoblot confirms the deletion of MSRA. (G) Quantification and representative images of wound closure of PDAT cells (n = 6, PDAT1, n = 5, PDAT4, n = 4, PDAT7). (H) Transwell migration of murine PDAT cells (n = 4). (I) Wound closure of murine PDAT cells transduced with pBabe empty vector or pBabe-MsrA (n = 3). (J-L) Liver colonization in mice after intrasplenic injection of PDAT-sgRosa26 (n = 8) or PDAT-sgMsrA9.1 (n = 6) cells. Liver mass (J), number of macroscopic lesions (K), and H&E staining analysis of liver micrometastases (demarcated by yellow contours) (L). Metastasis area was quantified using QuPath (Bankhead et al., 2017). (M-R) Liver colonization in mice after intrasplenic injection of PDAM expressing doxycycline-inducible MSRA and treated with vehicle (water) or doxycycline (10 mg/ml) by daily oral gavage. Experimental timeline (M) and representative images of livers (N). Liver mass (O), liver to body mass (P), number of mice with secondary macro-metastases (Q), and the organ distribution of metastasis (R). All error bars are means ± SDs. Non-parametric Mann Whitney test was performed in (B), otherwise Student’s t-test was performed. See also Figure S1 and Table S1.
Figure 2.
Figure 2.. Chemoproteomic profiling reveals enrichment of oxidation-sensitive methionine sites in metastatic pancreatic cancer organoid models
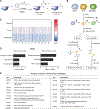
(A) Redox-Activated Chemical Tagging (ReACT) strategy for unbiased activity-based protein profiling and identification of oxidation-sensitive methionine sites in whole proteomes using oxaziridine (Ox)-based compounds. (B) Schematic workflow of quantitative analysis of reactive methionine proteomes. TMT, tandem mass tag. (C) Heatmap of activity-based, oxidation-sensitive methionine proteomes normalized to total proteome relative to normal organoids. FC, fold change. (D) KEGG pathway analysis of significantly oxidized proteins in PDAT organoids compared to normal (left) and PDAM compared to PDAT organoids (right) (p < 0.05, q < 0.1, LIMMA moderated t statistics). Top three pathways are shown. (E) Table of proteins involved in central carbon metabolism that are significantly oxidized in PDAM compared to PDAT organoids. See also Figure S2, Tables S2 to S4.
Figure 3.
Figure 3.. MSRA deficiency promotes glucose oxidation
(A to D) Glycolysis reflected by basal (A) and stressed (B) extracellular acidification rate (ECAR) and mitochondrial respiration reflected by basal (C) and stressed (D) oxygen consumption rate (OCR) in murine PDAT cells. Data are normalized to cell number. (E and F) OCR (E) and ECAR (F) in murine PDAT (n = 4) and PDAM (n = 6) organoids. Data normalized to total cell area. (G and H) 13C6-glucose tracing in murine PDAT cells (n = 3) to determine the contribution of glucose to glycolysis (G) and TCA cycle intermediates (H). PKM, pyruvate kinase M. (I and J) 13C6-glucose tracing in murine PDAT/M cells to determine the contribution of glucose to pyruvate (n = 6) (I), fumarate (n = 3), citrate (n = 6) and αKG (n = 3) (J). (K and L) ATP production quantified using this approach (Mookerjee et al., 2017) in murine PDAT-sgRosa26 or PDAT-sgMsrA cells (n = 10) (K), and in murine PDAT and PDAM organoids (n = 11) (L). (M) OCR after 5 h treatment with vehicle (DMSO) or the indicated concentrations of AZD7545 (n = 6). (N) Quantification and representative images of wound closure of murine PDAT cells after vehicle (DMSO) or AZD7545 treatment (n = 3). Error bars are all means ± SDs. In (A) and (C), n = 3 biological replicates and 3 technical replicates; (B) and (D), n = 5. Student’s t-test was performed. n.s., not significant. See also Figure S3.
Figure 4.
Figure 4.. MSRA-dependent oxidation of PKM2 promotes pyruvate kinase activity
(A) Volcano plot of Ox-alkyne labeled metabolic proteins in PDAT-sgMsrA compared to PDAT-sgRosa26 cells. FC, fold change; one sample t-test (n = 3). Red circle, PKM. (B and C) Immunoblot analysis of PKM methionine oxidation (n = 6) (B) and pyruvate kinase activity (n = 3) (C) in paired murine PDAT and PDAM cells. Actin, loading control. (D) Immunoprecipitation of Myc-Flag tagged MSRA stably expressed in PDAT cells to evaluate PKM interaction. IP, immunoprecipitation. (E and F) Immunoblot (E) and quantitative mass spectrometry (F) analysis of PKM methionine oxidation by Ox-alkyne labeling in murine PDAT cells. Quantification results in (E) pooled from all three lines (n = 18, sgRosa26, n = 17, sgMsrA). TMT, tandem mass tag. (G) Pyruvate kinase activity of murine PDAT cells. Data normalized to total protein content. (n = 9, PDAT1, n = 8, PDAT4, n = 6, PDAT7). (H and I) Pyruvate kinase activity of immunopurified PKM1 (n = 4) (H) or PKM2 (n = 3) (I) in murine PDAT cells stably expressing either isoform. (J) Pyruvate kinase activity of immunopurified endogenous PKM2 from PDAT and PDAM cells. Activity was normalized to relative PKM2 protein expression analyzed by immunoblotting (n = 3). (K) Immunoblot analysis of PKM2 methionine oxidation by Ox-alkyne labeling of murine PDAT-sgRosa26 or PDAT-sgMsrA cells (n = 3). SE, short exposure; LE, long exposure. Data in (F) are individual log2 FC value from each sample, PDAT1’ and PDAT4’ are technical replicates. All error bars are means ± SDs. Student’s t-test was performed, except in (A) and (F) one sample t-test was performed. n.s., not significant. See also Figure S4.
Figure 5.
Figure 5.. Site-specific oxidation of PKM2 at allosteric M239 site promotes tetramer formation
(A) Quantitative mass spectrometric analysis of Ox-alkyne labeled methionine residues on PKM in PDAT and PDAM organoids (n = 3). (B) Ranked log2FC of Ox-alkyne labeled peptides in murine PDAT and PDAM organoids by quantitative mass spectrometry. FC, fold change. (C) Crystal structure of PKM2 (PDB 1T5A) showing the relative location of M239 to fructose 1,6-bisphosphate (cyan). (D) Sequence alignment of S. cerevisiae, D. melanogaster, Mus musculus and Homo sapiens PKM2. Red residue, M239 in human/mouse sequence. (E) Pyruvate kinase activity of immunopurified wild-type (WT) or M239L PKM2 from murine PDAT cells stably expressing either construct (n = 3). (F and G) Immunoblot analysis of the oligomeric state of immunopurified and crosslinked PKM2 wild-type (F) or M239L (G) proteins ectopically expressed in PDAT cells. Quantification results pooled from two murine PDAT cell lines (n = 4). (H) Size exclusion chromatography analysis of murine PDAT cells stably expressing PKM2-WT or PKM2-M239L. All error bars are means ± SDs, except in (A) are means + SDs. Student’s t-test was performed. n.s., not significant. See also Figure S5 and Table S4.
Figure 6.
Figure 6.. Activation of PKM2 promotes PDA metastasis
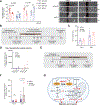
(A) Quantification and representative images of wound closure over 36 hours of PDAT cells in the presence of vehicle (DMSO) or 30 μM TEPP46 (n = 4). (B-D) Experimental timeline of TEPP46 treatment (B), tumor volume measured by calipers (C) and tumor regrowth measured by bioluminescence (D) in mice that received subcutaneous implantation of luciferase expressing PDAT cells. Mice were treated with vehicle (n = 4) or 50 mg/kg TEPP46 (n = 5) twice a day. (E and F) Experimental timeline of TEPP46 treatment (E) and liver colonization measured by bioluminescence (F) in mice after intrasplenic injection of luciferase expressing PDAT cells. Mice were treated with vehicle (n = 13) or 50 mg/kg TEPP46 (n = 12) twice a day. (G) Working model depicting metabolic reprogramming upon MSRA loss to promote pancreatic cancer cell migration. All error bars are means ± SDs, except in (C) are means + SDs. Student’s t-test was performed. n.s., not significant. See also Figure S6.

References

    1. Anastasiou D, Poulogiannis G, Asara JM, Boxer MB, Jiang JK, Shen M, Bellinger G, Sasaki AT, Locasale JW, Auld DS, et al. (2011). Inhibition of pyruvate kinase M2 by reactive oxygen species contributes to cellular antioxidant responses. Science 334, 1278–1283. 10.1126/science.1211485. - DOI - PMC - PubMed
    1. Anastasiou D, Yu Y, Israelsen WJ, Jiang JK, Boxer MB, Hong BS, Tempel W, Dimov S, Shen M, Jha A, et al. (2012). Pyruvate kinase M2 activators promote tetramer formation and suppress tumorigenesis. Nature chemical biology 8, 839–847. 10.1038/nchembio.1060. - DOI - PMC - PubMed
    1. Bankhead P, Loughrey MB, Fernandez JA, Dombrowski Y, McArt DG, Dunne PD, McQuaid S, Gray RT, Murray LJ, Coleman HG, et al. (2017). QuPath: Open source software for digital pathology image analysis. Scientific reports 7, 16878. 10.1038/s41598-017-17204-5. - DOI - PMC - PubMed
    1. Bergers G, and Fendt SM (2021). The metabolism of cancer cells during metastasis. Nat Rev Cancer 21, 162–180. 10.1038/s41568-020-00320-2. - DOI - PMC - PubMed
    1. Birsoy K, Wang T, Chen WW, Freinkman E, Abu-Remaileh M, and Sabatini DM (2015). An Essential Role of the Mitochondrial Electron Transport Chain in Cell Proliferation Is to Enable Aspartate Synthesis. Cell 162, 540–551. 10.1016/j.cell.2015.07.016. - DOI - PMC - PubMed

Publication types

MeSH terms