. 2022 Jun 25;8(1):295.
doi: 10.1038/s41420-022-01085-3.

ATF6 prevents DNA damage and cell death in colon cancer cells undergoing ER stress

Affiliations

ATF6 prevents DNA damage and cell death in colon cancer cells undergoing ER stress

Rossella Benedetti et al. Cell Death Discov. .

Abstract

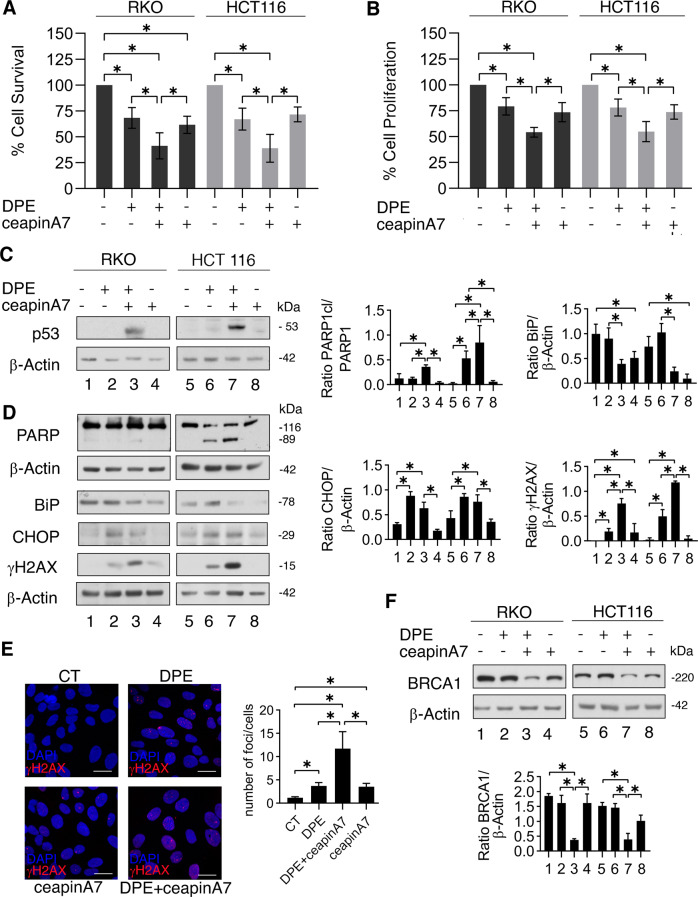
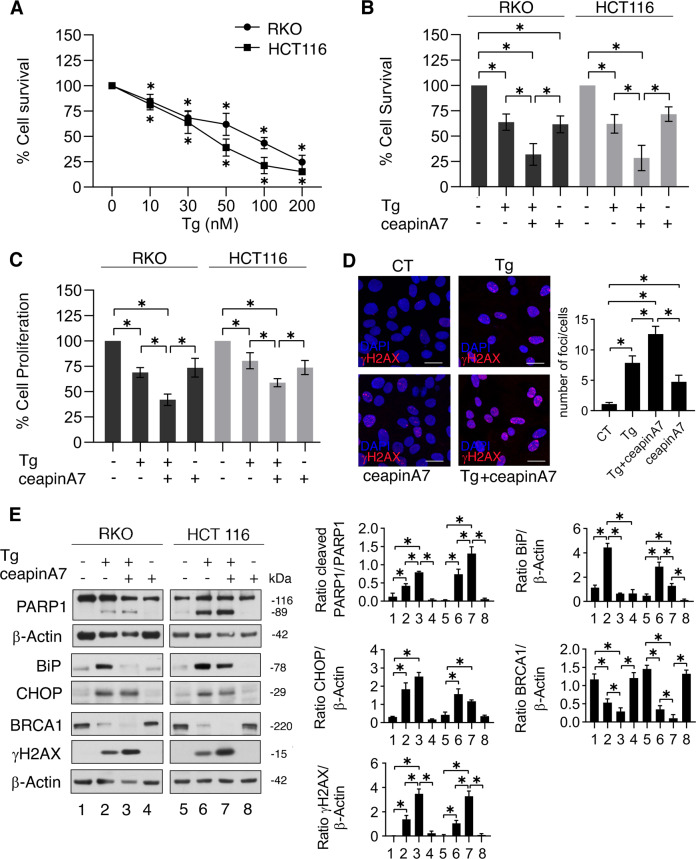
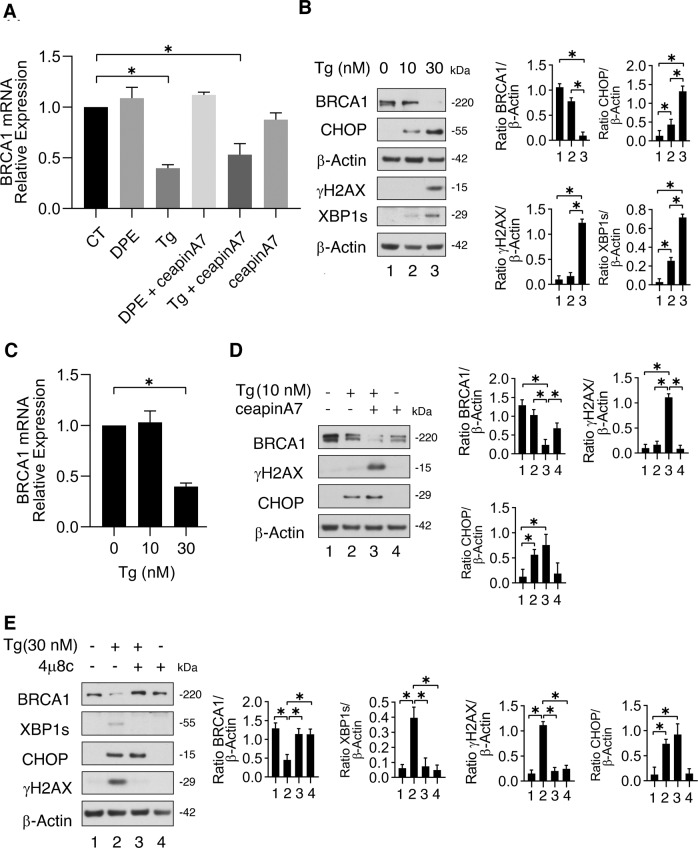
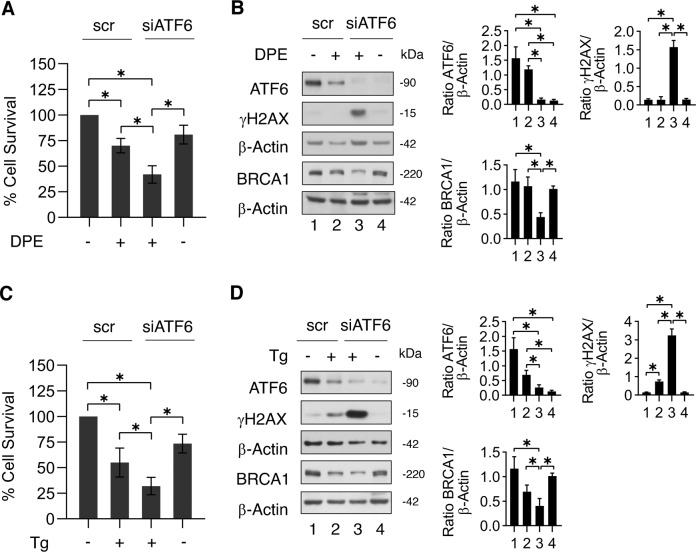
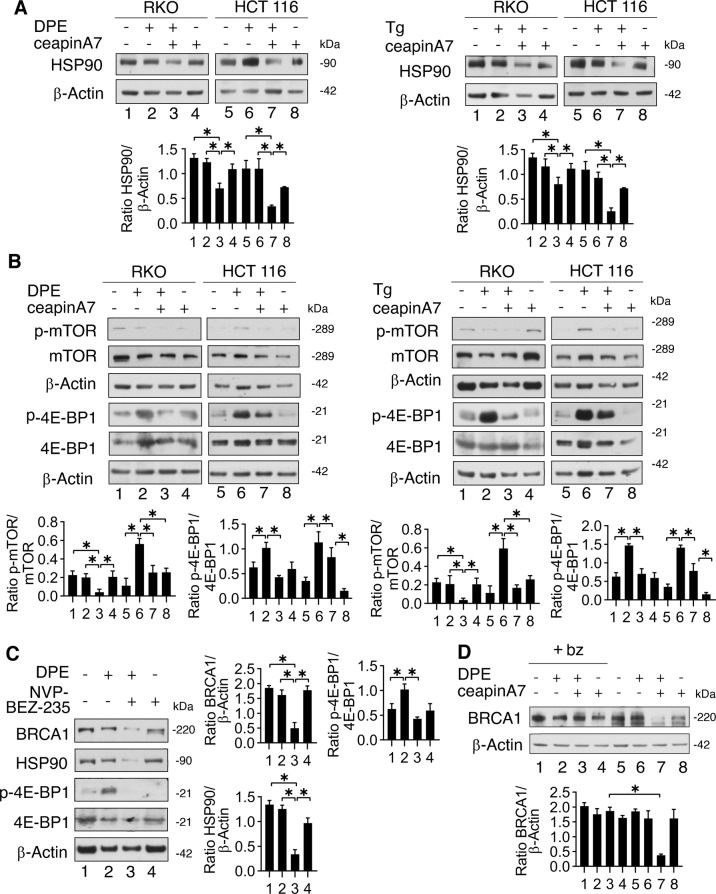
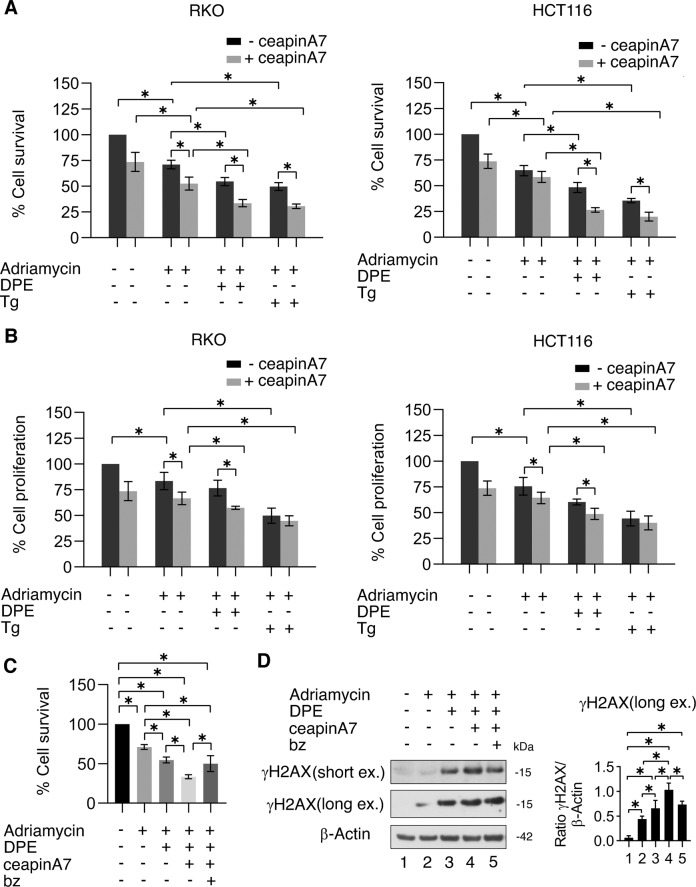
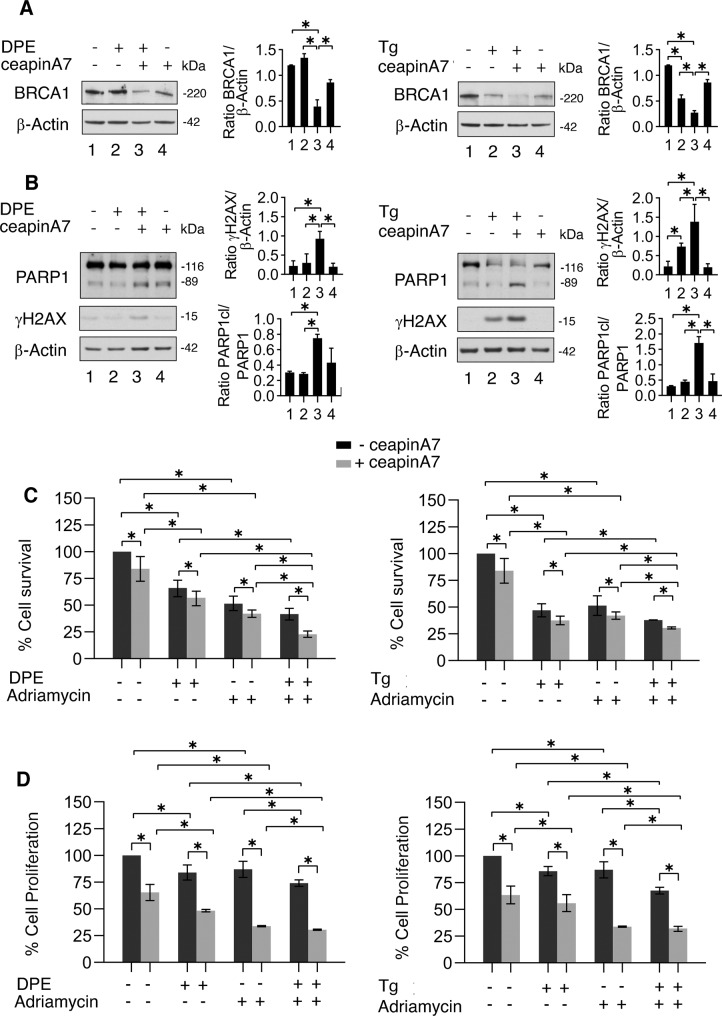
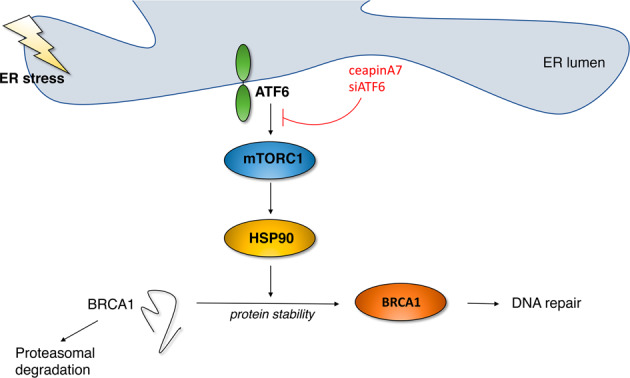
Colon cancer represents one of the most common and aggressive cancers in its advanced state. Among the most innovative anti-cancer approaches, the manipulation of UPR is a promising one, effective also against cancers carrying dysfunctional p53. Interestingly, it is emerging that UPR cross-talks with DDR and that targeting the interplay between these two adaptive responses may be exploited to overcome the resistance to the single DDR- and UPR-targeting treatments. Previous studies have highlighted the role of IRE1 alpha and PERK UPR sensors on DDR, while the impact of ATF6 on this process remains under-investigated. This study shows for the first time that ATF6 sustains the expression level of BRCA-1 and protects colon cancer cells from the cytotoxic effect of ER stressors DPE and Thapsigargin. At molecular level, ATF6 activates mTOR to sustain the expression of HSP90, of which BRCA-1 is a client protein. Therefore, pharmacological or genetic inhibition of ATF6 promoted BRCA-1 degradation and increased DNA damage and cell death, particularly in combination with Adriamycin. All together this study suggests that targeting ATF6 may not only potentiate the cytotoxic effect of drugs triggering ER stress but may render colon cancer cells more sensitive to Adriamycin and possibly to other DNA damaging agents used to treat colon cancer.


Conflict of interest statement

The authors declare no competing interests.

Figures

Fig. 1
Fig. 1. ATF6 inhibition reduces survival in DPE-treated cells and increases DNA damage which correlates with BRCA-1 reduction.
RKO and HCT116 cells were pre-treated or not with ceapinA7 (12 μM) for 1 h and then treated or not with DPE (100 μM) or left untreated, as control. After 48 h of treatments, A cell viability was measured by a Trypan Blue exclusion assay, the histograms represent the mean ± S.D. of live cells as percent of untreated control cells. By using the KERN index (R), we found that the combination of DPE plus ceapinA7 induced a synergistic cytotoxic effect in both RKO and HCT116 cells (R > 1). B Cell proliferation was measured by MTT assay, the histograms represent the mean ± S.D. of the ratio between the OD of treated cells and control cells. p value: *<0.05. C, D Protein expression level of p53, PARP cleavage, BiP, CHOP, γH2AX was evaluated by western blot analysis. β-Actin was used as loading control and one representative experiment is shown. The histograms represent the densitometric analysis of the ratio of specific protein and the appropriate control of three different experiments. Data are represented as the mean plus S.D. p value: *<0.05. E γH2AX foci (red) were assessed by IFA in RKO cell line. DAPI (blue) was used for nuclear staining. One representative experiment out of three is reported. The histograms represent the mean plus S.D. of the number of foci/cell from three different experiments. Bars = 20 μm, p value: *<0.05. F Western blot analysis of BRCA-1 expression level. β-Actin was used as loading control and one representative experiment is shown. The histograms represent the densitometric analysis of the ratio of BRCA-1/β-Actin of three different experiments. Data are represented as the mean plus S.D. p value: *<0.05.
Fig. 2
Fig. 2. ATF6 inhibition reduces survival, increases DNA damage, and reduces BRCA-1, although in Thapsigargin-stressed cells.
A RKO and HCT116 cell lines were treated different doses of Thapsigargin (Tg) (10, 30, 50, 100, and 200 nM) or left untreated, as control. Cell viability was measured by a Trypan Blue exclusion assay after 48 h of culture, the dots represent the mean ± S.D. of live cells as percent of untreated control cells. p value: *<0.05. RKO and HCT116 cells were pre-treated or not with ceapinA7 (12 μM) for 1 h and then treated or not with Thapsigargin (30 nM) or left untreated, as control. After 48 h of treatments, B cell viability was measured by a Trypan Blue exclusion assay, the histograms represent the mean ± S.D. of live cells as percent of untreated control cells. By using the KERN index (R), we found that the combination of Thapigargin and ceapinA7 induced a synergistic cytotoxic effect in both RKO and HCT116 cells (R > 1). C Cell proliferation was measured by MTT assay, the histograms represent the mean ± S.D. of the ratio between the OD of treated cells and control cells. p value: *<0.05. D γH2AX foci (red) were assessed by IFA in RKO cell line. DAPI (blue) was used for nuclear staining. One representative experiment out of three is reported. The histograms represent the mean plus S.D. of the number of foci/cell from three different experiments. Bars = 20 μm. p value: *<0.05. E Protein expression level of PARP cleavage, BiP, CHOP, BRCA-1, and γH2AX was evaluated by western blot analysis. β-Actin was used as loading control and one representative experiment is shown. The histograms represent the densitometric analysis of the ratio of specific protein and the appropriate control of three different experiments. Data are represented as the mean plus S.D. p value: *<0.05.
Fig. 3
Fig. 3. ATF6 inhibitor downregulation of BRCA-1 occurs at post-transcriptional level, while Thapsigargin reduces BRCA-1 mRNA in a dose-dependent manner.
A qRT-PCR of BRCA-1 in RKO cell line pre-treated or not with ceapinA7 (12 μM) and treated or not with DPE (100 μM) or Thapsigargin (Tg) (30 nM) or left untreated, as control for 48 h. Data are expressed relative to the geometric mean of the starting concentration of reference genes (GAPDH and B2M). The histograms represent the mRNA expression levels of BRCA-1 genes of three different experiments. Data are represented as the mean relative to the control plus S.D. *p value < 0.05. B RKO were treated with Thapsigargin (10 or 30 nM) or left untreated as control. After 48 h the expression of BRCA-1, CHOP, γH2AX, XBP1s was evaluated by western blot analysis. β-Actin was used as loading control. The histograms represent the mean plus S.D. of the densitometric analysis of the ratio between the protein and β-Actin. *p < 0.05. C qRT-PCR of BRCA-1 in RKO treated with Thapsigargin (10 or 30 nM) or left untreated as control for 48 h. Data are expressed relative to the geometric mean of the starting concentration of reference genes (GAPDH and B2M). The histograms represent the mRNA expression levels of BRCA-1 genes of three different experiments. Data are represented as the mean relative to the control plus S.D. *p value < 0.05. D RKO cells were pre-treated or not with ceapinA7 (12 μM) for 1 h and then treated or not with Thapsigargin (10 nM) or left untreated, as control. After 48 h of treatments, the expression of BRCA-1, γH2AX, and CHOP was evaluated by Western blot analysis. β-Actin was used as loading control. The histograms represent the densitometric analysis of the ratio of specific protein/β-Actin of three different experiments. Data are represented as the mean plus S.D. *p value < 0.05. E RKO cells were pre-treated or not with 4u8c (10 μM) for 1 h and then treated or not with Thapsigargin (30 nM) or left untreated, as control. After 48 h of treatments, the expression of BRCA-1, γH2AX, CHOP, and XBP1s was evaluated by western blot analysis. β-Actin was used as loading control. The histograms represent the densitometric analysis of the ratio of specific protein/β-Actin of three different experiments. Data are represented as the mean plus S.D. *p value < 0.05.
Fig. 4
Fig. 4. ATF6 silencing confirms that ATF6 sustains BRCA-1 expression and protects against DNA damage cancer cells subjected to ER stress.
ATF6 was silenced in RKO cells and after 24 h cells were treated or not with DPE (100 μM) for 48 h. A Cell viability was measured by a Trypan Blue exclusion assay; the histograms represent the mean ± S.D. of live cells as percent of scramble control (scr) cells. *p-value < 0.05. B Protein expression level of ATF6, γH2AX, and BRCA-1 was evaluated by western blot analysis. β-Actin was used as loading control. The histograms represent the densitometric analysis of the ratio of specific protein/β-Actin of three different experiments. Data are represented as the mean plus S.D. *p-value < 0.05. ATF6 was silenced in RKO cells and after 24 h cells were treated or not with Thapsigargin (Tg) (30 nM) for 48 h. C Cell viability was measured by a Trypan Blue exclusion assay; the histograms represent the mean ± S.D. of live cells as percent of scramble control (scr) cells. *p-value < 0.05. D Protein expression level of ATF6, γH2AX, and BRCA-1 was evaluated by western blot analysis. β-Actin was used as loading control. The histograms represent the densitometric analysis of the ratio of specific protein/β-Actin of three different experiments. Data are represented as the mean plus S.D. *p-value < 0.05.
Fig. 5
Fig. 5. ATF6 sustains mTOR activation and HSP90 expression during ER stress which stabilizes BRCA-1 and prevents its proteasomal degradation.
RKO and HCT116 cells were pre-treated or not with ceapinA7 (12 μM) for 1 h and then treated or not with DPE (100 μM) or Thapsigargin (Tg) (30 nM) or left untreated, as control. A, B Protein expression level of HSP90, p-mTOR, mTOR, p-4EBP1, and 4EBP1 was evaluated by western blot analysis. β-Actin was used as loading control. The histograms represent the densitometric analysis of the ratio of specific protein and the appropriate control of three different experiments. Data are represented as the mean plus S.D. *p-value < 0.05. C RKO cells were pre-treated or not with NVP-BEZ-235 (250 nM) for 1 h and then treated or not with DPE (100 μM) or left untreated, as control. Protein expression level of BRCA-1, HSP90, p-4EBP1, and 4EBP1 was evaluated by western blot analysis. β-Actin was used as loading control. The histograms represent the densitometric analysis of the ratio of specific protein and the appropriate control of three different experiments. Data are represented as the mean plus S.D. *p-value < 0.05. D RKO cells were pre-treated or not with ceapinA7 (12 μM) for 1 h and then treated or not with DPE (100 μM) for 48 h. To evaluate proteasomal degradation cells were incubated or not with Bortezomib (bz) (10 nM) for the last 4 h of treatments. Western blot analysis of BRCA-1 expression level. β-Actin was used as loading control and one representative experiment is shown. The histograms represent the densitometric analysis of the ratio of BRCA-1/β-Actin of three different experiments. Data are represented as the mean plus S.D. p value: *< 0.05.
Fig. 6
Fig. 6. ATF6 inhibition enhances Adriamycin-mediated reduction of cell survival and cell proliferation in cells treated with DPE or Thapsigargin.
RKO and HCT116 cells were pre-treated or not with ceapinA7 (12 μM) for 1 h and then treated or not with DPE (100 μM) or Thapsigargin (Tg) (30 nM) or left untreated, as control. After 3 h of culture, Adriamycin (1 μg/ml) was added to the cultures. A Cell viability was measured by a Trypan Blue exclusion assay after 48 h of culture, the histograms represent the mean ± S.D. of live cells as percent of untreated control cells. p value: *< 0.05. By using the KERN index (R), we found that ceapinA7 induced a synergistic cytotoxic effect in combination with DPE/Adriamycin in both RKO and HCT116 (R > 1) and in combination with Thapsigargin/Adriamicin in HCT116 cells (R > 1) while in RKO cells ceapinA7 combined with Thapsigargin/Adriamicin induced an additive effect (R = 1). B Cell proliferation was measured by MTT assay after 48 h of culture, the histograms represent the mean ± S.D. of the ratio between the OD of treated cells and control cells. p value: *< 0.05. C RKO cells were pre-treated or not with ceapinA7 (12 μM) for 1 h and then treated or not with DPE (100 μM). After 3 h of culture, Adriamycin (1 μg/ml) was added to the cultures. Proteasome inhibitor bortezomib (bz) was added to the cultures for the last 6 h of treatments. Untread cells were used as control. Cell viability was measured by a Trypan Blue exclusion assay after 48 h of culture, the histograms represent the mean ± S.D. of live cells as percent of untreated control cells. p value: *< 0.05. D Protein expression level of γH2AX was evaluated by western blot analysis. β-Actin was used as loading control. The histograms represent the densitometric analysis of the ratio of γH2AX/β-Actin of three different experiments. Data are represented as the mean plus S.D. *p-value < 0.05.
Fig. 7
Fig. 7. CeapinA7 reduces BRCA-1, increases DNA damage, and the sensitivity to Adriamycin also in HCT116 p53−/− cells treated by DPE or Thapsigargin.
HCT116 p53−/− cells were pre-treated or not with ceapinA7 (12 μM) for 1 h and then treated or not with DPE (100 μM) or Thapsigargin (Tg) (30 nM) or left untreated, as control, for 48 h. A, B Western blot analysis showing the expression level of BRCA-1, PARP cleavage and γH2AX. β-Actin was used as loading control and one representative experiment is shown. The histograms represent the densitometric analysis of the ratio of specific protein/β-Actin of three different experiments. Data are represented as the mean plus S.D. p value: *< 0.05. HCT116 p53−/− cells were pre-treated or not with ceapinA7 (12 μM) for 1 h and then treated or not with DPE (100 μM) or Thapsigargin (Tg) (30 nM) or left untreated, as control. After 3 h of culture, Adriamycin (1 μg/ml) was added or not to the cultures. C Cell viability was measured by a Trypan Blue exclusion assay after 48 h of culture, the histograms represent the mean ± S.D. of live cells as percent of untreated control cells. p value: *< 0.05. By using the KERN index (R), we found that ceapinA7 induced a synergistic cytotoxic effect when combined with Thapsigargin, Adriamycin and DPE/Adriamycin (R > 1) while in combination with DPE and Thapsigargin/Adriamycin the effect of ceapinA7 was additive (R = 1). D Cell proliferation was measured by MTT assay after 48 h of culture, the histograms represent the mean ± S.D. of the ratio between the OD of treated cells and control cells. p value: *< 0.05.
Fig. 8
Fig. 8. Representative scheme illustrating the role of ATF6 in sustaining the mTOR/HSP90/BRCA1 axis.
ATF6 pharmacological or genetic inhibition reduces BRCA-1 stability in stressed cells and promotes its proteasomal degradation.

Similar articles

Cited by

References

    1. Madden E, Logue SE, Healy SJ, Manie S, Samali A. The role of the unfolded protein response in cancer progression: From oncogenesis to chemoresistance. Biol Cell. 2019;111:1–17. doi: 10.1111/boc.201800050. - DOI - PubMed
    1. Lin Y, Jiang M, Chen W, Zhao T, Wei Y. Cancer and ER stress: mutual crosstalk between autophagy, oxidative stress and inflammatory response. Biomed Pharmacother. 2019;118:109249. doi: 10.1016/j.biopha.2019.109249. - DOI - PubMed
    1. Romeo MA, Gilardini Montani MS, Gaeta A, D’Orazi G, Faggioni A, Cirone M. HHV-6A infection dysregulates autophagy/UPR interplay increasing beta amyloid production and tau phosphorylation in astrocytoma cells as well as in primary neurons, possible molecular mechanisms linking viral infection to Alzheimer’s disease. Biochim Biophys Acta Mol Basis Dis. 2020;1866:165647. doi: 10.1016/j.bbadis.2019.165647. - DOI - PubMed
    1. Gonzalez-Quiroz M, Blondel A, Sagredo A, Hetz C, Chevet E, Pedeux R. When endoplasmic reticulum proteostasis meets the DNA damage response. Trends Cell Biol. 2020;30:881–91. doi: 10.1016/j.tcb.2020.09.002. - DOI - PubMed
    1. Kaplan AR, Glazer PM. Impact of hypoxia on DNA repair and genome integrity. Mutagenesis. 2020;35:61–8. doi: 10.1093/mutage/gez019. - DOI - PMC - PubMed