. 2022 Jun 25;13(1):3648.
doi: 10.1038/s41467-022-31378-1.

Assembly dynamics of FtsZ and DamX during infection-related filamentation and division in uropathogenic E. coli

Affiliations

Assembly dynamics of FtsZ and DamX during infection-related filamentation and division in uropathogenic E. coli

Bill Söderström et al. Nat Commun. .

Abstract

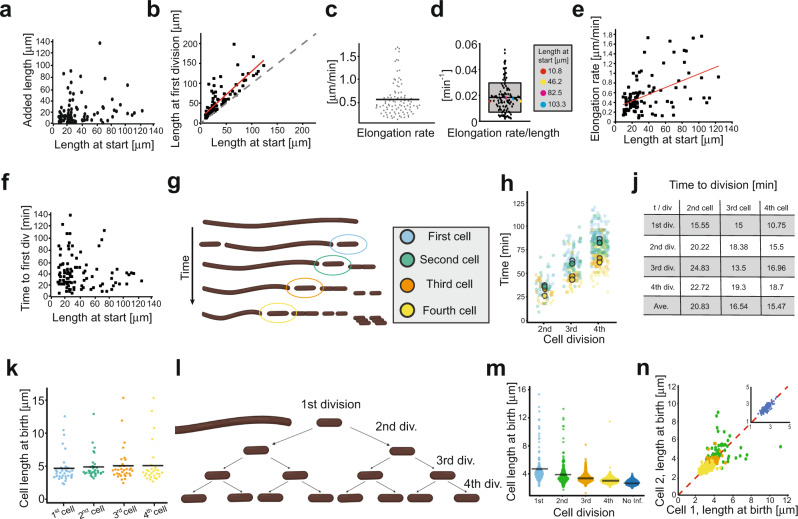
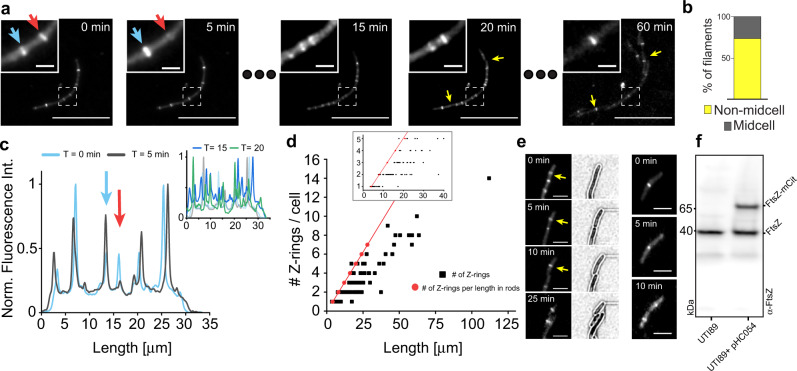
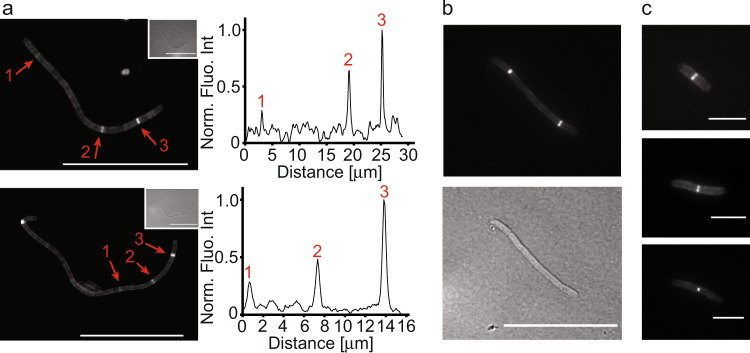
During infection of bladder epithelial cells, uropathogenic Escherichia coli (UPEC) can stop dividing and grow into highly filamentous forms. Here, we find that some filaments of E. coli UTI89 released from infected cells grow very rapidly and by more than 100 μm before initiating division, whereas others do not survive, suggesting that infection-related filamentation (IRF) is a stress response that promotes bacterial dispersal. IRF is accompanied by unstable, dynamic repositioning of FtsZ division rings. In contrast, DamX, which is associated with normal cell division and is also essential for IRF, is distributed uniformly around the cell envelope during filamentation. When filaments initiate division to regenerate rod cells, DamX condenses into stable rings prior to division. The DamX rings maintain consistent thickness during constriction and remain at the septum until after membrane fusion. Deletion of damX affects vegetative cell division in UTI89 (but not in the model E. coli K-12), and, during infection, blocks filamentation and reduces bacterial cell integrity. IRF therefore involves DamX distribution throughout the membrane and prevention of FtsZ ring stabilization, leading to cell division arrest. DamX then reassembles into stable division rings for filament division, promoting dispersal and survival during infection.


Conflict of interest statement

The authors declare no competing interests.

Figures

Fig. 1
Fig. 1. Shorter filaments are more likely to be viable and revert to rod cells.
a Fluorescence microscopy image showing a mixture of sfGFP-expressing short cells and filaments released from bladder cells after urine exposure. b Length heterogeneity in a cluster of filaments. c Shorter filaments are more likely to be viable after a round of infection. A total of 343 filaments were analysed from time-lapse imaging of three different infection experiments (Blue, Green and Yellow dots, respectively). Large, coloured dots represent the average of the respective experiment. Only cells classified as “filaments” (i.e., equal to or longer than 8 μm) were included in this analysis. Overall average filament lengths were 56.3 ± 56.5 (n = 208) for viable, 122.6 ± 79 (n = 68) for dead, and 117.6 ± 73,4 (n = 67) for dying (mean ± SD). P values are from unpaired two-tailed t tests. ***P < 0.0001. 95% confidence interval. d WT UTI89 filaments were differentially stained to assess viability (LIVE/DEAD, green and magenta, respectively). e Filaments that divided at least once during the first 120 min were classified as viable (white arrow). f A total of 275 filaments from three infection experiments were analysed with LIVE/DEAD staining. g A representative dying filament, transitioning from green to magenta over time (see Supplementary Movie SM5). Scale bars a = 40 μm, Rest = 20 μm. Source data are provided as a Source data file.
Fig. 2
Fig. 2. Growth and division dynamics of UTI89 filaments that revert to rods.
a Added cell length from the start of imaging to the first division (mean = 19.78 ± 22.3 μm, n = 101) vs cell length at the start. b Relationship between filament length at start and at first division. The red line indicates a linear fit to the data. Dotted line indicates no growth before first division. c Variation in elongation rate between filaments (between 0.08 and 1.76 μm min−1). The mean elongation rate was ∆L/∆t = 0.55 ± 0.4 μm min−1, n = 101. d Elongation rate (0.0187 ± 0.0113 min−1, n = 101) of filaments normalized to their length at the start of the imaging. Box outlines indicate SD, midline indicates mean, whiskers indicate 95% interval. Data maxima and minima are 1.76 and 0.08 min−1, respectively. Box to the right high-lights four randomly picked filaments with rates close to mean (red = 0.015 min−1, yellow = 0.0152 min−1, magenta = 0.0178 min−1, blue = 0.017 min−1), these filaments ranged from 10 to 100 μm in length, indicating weak correlation between length and elongation rate. e The elongation rate was not correlated to the length of the filaments at the start of imaging. The red line shows a linear fit to the data. R2 = 0.245. f No apparent correlation between filament length at the start of imaging and time to first division was found. g Schematic representation of the first to fourth generations of cells during filament division. h Timing of subsequent division events in ‘mother’ filaments after birth of the newborn cells depicted in f (colour key). Larger circles represent the means (ndiv = 471). j Mean inter-division times in subsequent divisions of the mother filament after the second, third, and fourth cells have pinched off. Overall means were: X¯2nd=20.83±3.99min.,X¯3rd=16.54±2.75min.,X¯4th=15.47±3.41min. (average ± S.D.) k Mean cell lengths of the smaller newborn cell pinched off from a filament (n = 135). l Schematic representation of the subsequent division events of pinched-off newborns. m Lengths at birth of daughter cells from first to fourth generations. n Symmetry of division in newborns. Second generation (green) cells divide more asymmetrically than third (orange) and fourth (yellow) generation of cells. Inset; UTI89 grown in LB divides highly symmetrically. All values represent mean ± SD. Source data are provided as a Source data file.
Fig. 3
Fig. 3. FtsZ-mCitrine localization and dynamics in filaments.
To visualize Z-rings in filaments, UTI89 cells were transformed with a plasmid producing FtsZ-mCitrine (pHC054) and run through the UTI model. a Still images from a representative time-lapse of a filament undergoing reversal (Supplementary movie SM7). Inset show a magnified view of the dashed square (Supplementary movie SM8), blue arrow indicates a FtsZ-mCitrine ring that increase in intensity from t = 0 to t = 5, red arrow indicates a FtsZ-mCitrine ring that completely disassembles during the same time. Yellow arrows at t = 20 indicate the first divisions. Scale bar 20 μm. b Percentage of filaments in which first division was at midcell vs non-midcell (towards the poles). c Normalized fluorescence intensity traces at various time points from the filament in a. Blue and red arrows correspond to the blue and red arrows in a. Inset show traces at t = 15 (dark blue) and t = 20 min (green), light blue and grey are the traces from earlier timepoints. d Filaments have less Z-rings assembled than the corresponding rods would have per cell length. Black squares show the number of FtsZ-mCitrine rings in filaments at the start of the imaging. Red dots indicate the corresponding number of ‘expected’ Z-rings assuming one ring per WT cell length (i.e., one ring per ~4 μm). Inset shows magnification of filaments in lengths up to 40 μm. n = 100. e The presence of rod-shaped cells after infection indicated that FtsZ-mCitrine did not influence division (nor induced filamentation). Left column: FtsZ-mCitrine was pre-assembled in ‘cells’ before they separated from the mother filament. Scale bar 4 μm. f Western blot indicating the FtsZ protein levels in filaments. The total production of the FtsZ-mCitrine was 43 ± 1% of the total cellular FtsZ pool (n = 3). All times in time lapses indicate time relative to first image (t = 0 min). Source data are provided as a Source data file.
Fig. 4
Fig. 4. UTI89∆damX displays an elongation phenotype in rich medium but does not produce filaments in a model UTI.
Deletion of damX in a non-pathogenic E. coli (strain BW25113) does not give rise to a phenotype. a Representative image of WT BW25113 cells b Representative image of BW25113∆damX cells. c Representative image of WT UTI89 cells. d Around 15% of cells in UTI89∆damX displayed a division defect resulting in abnormally long cells. The overall range of cell lengths for UTI89∆damX was 25 μm, with >90% of the long cells being in the range 7–15 μm. We did not observe any clear correlation between length at birth and abnormal divisions (Supplementary Movie SM9). e The long phenotype could largely be reversed when complementing DamX with a plasmid producing mEos3.2-DamX (pMP6). Inset shows fluorescence localization of mEos3.2-DamX in the pre-converted green channel. f Relative distribution of cell lengths of the UTI89 strains grown in rich media. The number on x-axis represents bins of one μm, except for last bin which encompasses all cells longer than 9 μm. Grey dashed line indicate 8 μm in length. g Representative elongated UTI89∆damX cell. Initially are two Z-rings (FtsZ-mCitrine) assembled along the cell body. White arrow shows one of the Z-rings disassemble without a division event. Inset show corresponding bright field image. h UTI89∆damX do not filament in the UTI model. This is consistent with what has previously been observed. j UTI89∆damX complemented with mEos3.2-DamX produced from a plasmid does filament. This suggests that the mEos3.2-DamX is a functional protein fusion. k Length distribution of UTI89∆damX (red) and UTI89∆damX + complementation (blue) cell from infections. UTI89∆damX cells from LB growth are included for reference (grey). l DamX levels in various UTI89 strains after a round of infection. ∆damX indicate UTI89∆damX, ∆damX + comp indicate UTI89∆damX complimented with pMP6. DX = DamX, mE-DX = mEos3.2-DamX (pMP6). Note that both DamX and mEos3.2-DamX ran at a higher molecular weight than expected, we do not know the cause at this time but is similar as to what has previously been seen for DamX by others. All scale bars = 4 μm. Source data are provided as a Source data file.
Fig. 5
Fig. 5. DamX localizes at the division site prior to membrane constriction.
Filaments expressing mEos3.2-DamX harvested from the back-end of flow chambers after infections were grown in LB for 1 h before imaged using single-molecule microscopy. a mEos3.2-DamX localized at multiple division sites simultaneously and accumulated prior to visible invagination of the membranes. Insets: Close-up images of mEos3.2-DamX and the corresponding bright-field image. b PhotoActivatable Localization Microscopy (PALM) image of the same filament as in a. c Close-up images (1) and (2) of the mEos3.2-DamX ring assemblies at division sites prior to condensing into a ring structure (from b). d Fluorescence intensity plots of the mEos3.2-DamX assemblies and membrane widths. Plots showing ring and membrane widths; yellow lines represent ring assemblies; grey dotted lines represent membrane widths 1 μm up and downstream of the mEos3.2-DamX accumulation. ∆W indicates the peak-to-peak distances. e Length of the molecule assemblies along the length axis of images in c. ∆L indicates the length of the intensity profile at 50% of the intensity. f PALM image of a typical filament during reversal. g Close-up image of a constricting mEos3.2-DamX ring (3), fluorescence profile underneath: yellow line represents the ring, grey represents membrane width. h Axial breadth of mEso3.2-DamX rings along the length of the filaments at various cell diameters. Average width 116.5 ± 13.4 (n = 122), values represent mean ± SD. Red line represents linear fit to the data: y = −0.009*x + 116. j mEos3.2-DamX remains at the old division septum after membrane separation. k Close ups of old division sites from j (4) and (5). l Peak-to-peak distance of fluorescence intensities of the membrane assemblies of mEos3.2-DamX. m A typical filament before division sites have been defined. Scale bars (a, b, f, j, m) = 10 μm, (c, g, kleft) = 500 nm, (kright) = 100 nm. Source data are provided as a Source data file.
Fig. 6
Fig. 6. mEos3.2-DamX localization and dynamics in filaments.
a Time-lapse images of filaments expressing mEos3.2-DamX (Supplementary movie SM14). Formation of mEos3.2-DamX rings was followed over time in filaments where no rings were observed in the first image. Cyan arrows show first generation, magenta arrow second generation and finally yellow arrows indicate the third generation division rings. b Relative de novo positioning of mEos3.2-DamX division rings in filaments. Most rings assembled at locations close to 1/4, 1/2 or 3/4 of the total filament length. Colour coding follows that in a. Gen. = Generation. n = 134. c The distance of mEos3.2-DamX rings in μm from one of the cell poles. d Plot shows the time from first mEos3.2-DamX ring formation to the first division (1st), and the time from the first division to the second (2nd, Δt = t2 − t1) for five randomly picked filaments. e Summary showing average times of first and second division based on mEos3.2-DamX ring formation and constriction. f Total cellular mEos3.2-DamX fluorescence intensity did not change with formation of division rings. Blue dots represent total integrated fluorescence normalized to filament area one frame before formation of the first ring, orange dots represent integrated fluorescence when one ring had formed, grey dots represent integrated fluorescence when two rings had formed. f inset, Relative mean cellular fluorescence with one ring = 1.02 ± 0.07 (n = 45), relative mean cellular fluorescence with two rings = 1.03 ± 0.15 (n = 32). Values represent mean ± SD. g A shorter filament from a time-lapse movie indicating that the second generation of mEos3.2-DamX ring (magenta, formed at t = 50) constricted and pinched off prior to the first ring formed (cyan, formed at t = 10 min). First image showing a full division is at t = 100 min, at the place where the second mEos3.2-DamX ring was formed (indicated by a magenta asterisk). Division of the first mEos3.2-DamX ring is indicated by cyan asterisk. A third-generation mEos3.2-DamX ring is indicated by the yellow arrow (with division indicated by yellow asterisk). Scale bar 10 μm. h In all, 23% of the second generation mEos3.2-DamX rings formed in filaments pinched off before the first generation mEos3.2-DamX rings. All scale bars = 10 μm. Source data are provided as a Source data file.
Fig. 7
Fig. 7. Peptidoglycan synthesis is active at multiple locations at the same time.
WT UTI89 filaments from an infection cycle were labelled with the green fluorescent D-amino acid (FDAA) probe OGDA and imaged using fluorescence microscopy. Harvested filaments were pelleted and resuspended in LB and placed at 37 °C for 2 h before OGDA labelling for 5 min. a Multiple active sites for peptidoglycan synthesis can be observed in filaments. Inset: corresponding brightfield images. Fluorescence intensity plots for selected sections are shown next to the images (peaks numbered). b A representative mid-length filament with two clear OGDA accumulations at division sites. c Rod-shaped cells in various stages of membrane constriction. Cells had already reverted from filaments and were then stained with OGDA, showing strong fluorescence accumulation only at midcell, as expected. Scale bars a, b = 20 μm, c = 4 μm. Source data are provided as a Source data file.

References

    1. Stamm WE, Norrby SR. Urinary tract infections: disease panorama and challenges. J. Infect. Dis. 2001;183(Suppl 1):S1–4. doi: 10.1086/318850. - DOI - PubMed
    1. Wagenlehner FM, Tandogdu Z, Bjerklund Johansen TE. An update on classification and management of urosepsis. Curr. Opin. Urol. 2017;27:133–137. doi: 10.1097/MOU.0000000000000364. - DOI - PubMed
    1. Tandogdu Z, Cai T, Koves B, Wagenlehner F, Bjerklund-Johansen TE. Urinary tract infections in immunocompromised patients with diabetes, chronic kidney disease, and kidney transplant. Eur. Urol. Focus. 2016;2:394–399. doi: 10.1016/j.euf.2016.08.006. - DOI - PubMed
    1. Hooton TM. Clinical practice. Uncomplicated urinary tract infection. N. Engl. J. Med. 2012;366:1028–1037. doi: 10.1056/NEJMcp1104429. - DOI - PubMed
    1. Flores-Mireles AL, Walker JN, Caparon M, Hultgren SJ. Urinary tract infections: epidemiology, mechanisms of infection and treatment options. Nat. Rev. Microbiol. 2015;13:269–284. doi: 10.1038/nrmicro3432. - DOI - PMC - PubMed

Publication types

MeSH terms