. 2022 Jun 25;13(1):3652.
doi: 10.1038/s41467-022-31376-3.

Occult polyclonality of preclinical pancreatic cancer models drives in vitro evolution

Affiliations

Occult polyclonality of preclinical pancreatic cancer models drives in vitro evolution

Maria E Monberg et al. Nat Commun. .

Abstract

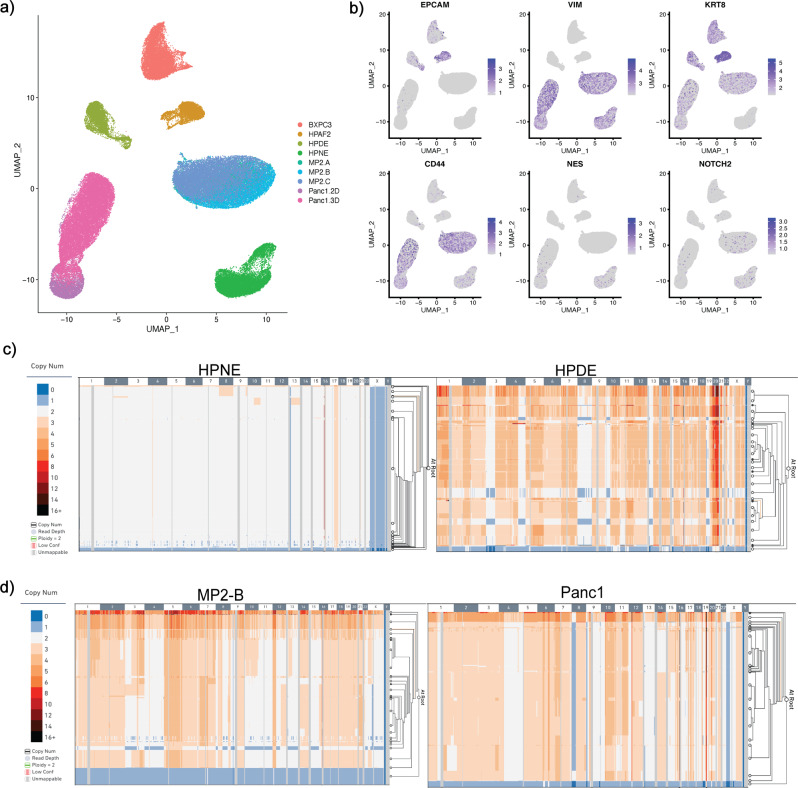
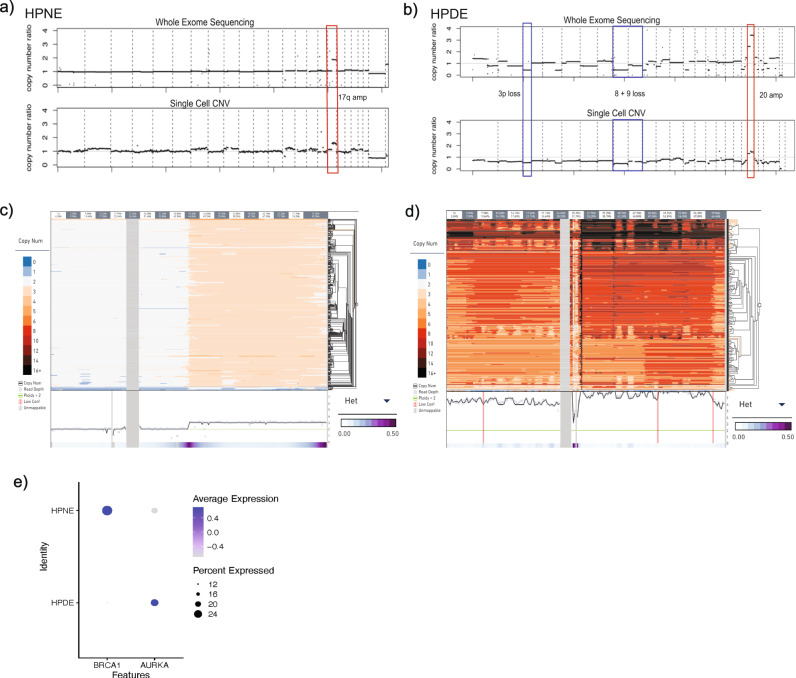
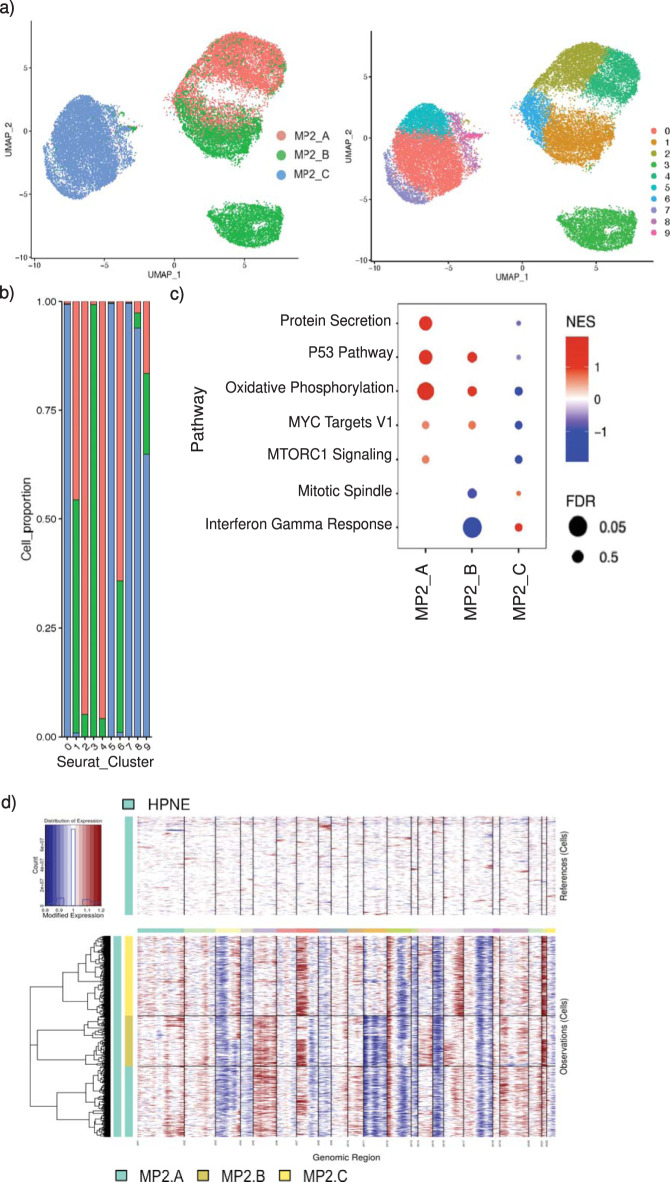
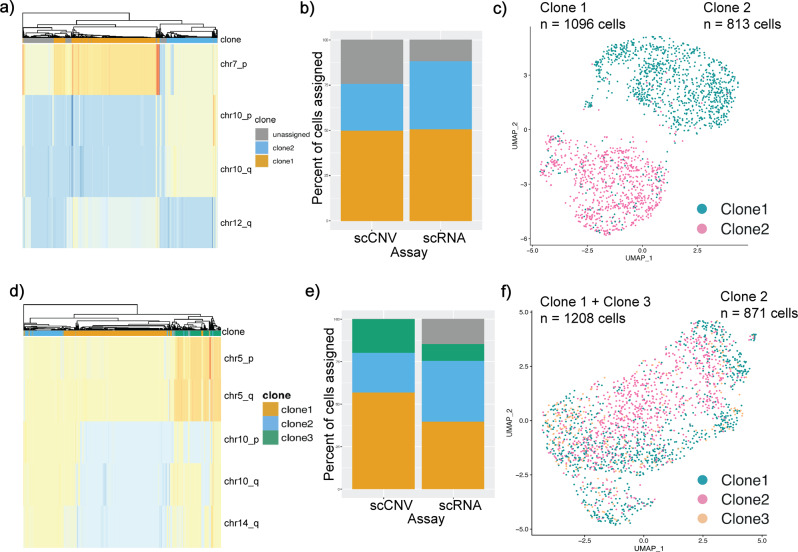
Heterogeneity is a hallmark of cancer. The advent of single-cell technologies has helped uncover heterogeneity in a high-throughput manner in different cancers across varied contexts. Here we apply single-cell sequencing technologies to reveal inherent heterogeneity in assumptively monoclonal pancreatic cancer (PDAC) cell lines and patient-derived organoids (PDOs). Our findings reveal a high degree of both genomic and transcriptomic polyclonality in monolayer PDAC cell lines, custodial variation induced by growing apparently identical cell lines in different laboratories, and transcriptomic shifts in transitioning from 2D to 3D spheroid growth models. Our findings also call into question the validity of widely available immortalized, non-transformed pancreatic lines as contemporaneous "control" lines in experiments. We confirm these findings using a variety of independent assays, including but not limited to whole exome sequencing, single-cell copy number variation sequencing (scCNVseq), single-nuclei assay for transposase-accessible chromatin with sequencing, fluorescence in-situ hybridization, and single-cell RNA sequencing (scRNAseq). We map scRNA expression data to unique genomic clones identified by orthogonally-gathered scCNVseq data of these same PDAC cell lines. Further, while PDOs are known to reflect the cognate in vivo biology of the parental tumor, we identify transcriptomic shifts during ex vivo passage that might hamper their predictive abilities over time. The impact of these findings on rigor and reproducibility of experimental data generated using established preclinical PDAC models between and across laboratories is uncertain, but a matter of concern.


Conflict of interest statement

A.M. receives royalties for a pancreatic cancer biomarker test from Cosmos Wisdom Biotechnology, and this financial relationship is managed and monitored by the UTMDACC Conflict of Interest Committee. A.M. is also listed as an inventor on a patent that has been licensed by Johns Hopkins University to Thrive Earlier Detection (Patent No. US20190256920A1, “Differential Identification of Pancreatic Cysts”), and is a consultant for Freenome and Tezcat Biotech. The remaining authors do not have competing interests to disclose.

Figures

Fig. 1
Fig. 1. PDAC Cell Lines display heterogeneity at single-cell level.
a Uniform manifold approximation projection (UMAP) plot of single cells from PDAC cell lines used in this study. b UMAP Feature Plotting for known cell-type markers (EPCAM, MUC1 for epithelial; vimentin, and KRT8 for mesenchymal cellular origin). c, d Representative scCNV plots for cell lines. Columns indicate chromosomes (numbers labeled in gray and white), rows indicate individual cells organized into clonal clades. Phylogeny determined using 10× Genomics scCNV analysis software.
Fig. 2
Fig. 2. Genomic characterization of HPDE and HPNE normal control cell lines.
a scCNV comparison to WES of HPNE cell line depicting amplified 17q as the only notable CNV event. b scCNV comparison to WES of HPDE cell line. CNV events representing losses of chromosomal arms 3p, 8p, and 9p and amplifications at chromosome 20. c scCNV high-resolution cell phylogeny of HPNE for all chromosome 17 locations showing ploidy = 3 for all cells at 17q arm, region inclusive of BRCA1 loci. Columns indicate chromosomal intervals measured in Mb, rows indicate individual cells. Chromosomal regions depicted (labeled along top x-axis) are representative of CNV segments outlined in red in Fig. 1d. d scCNV high-resolution cell phylogeny of HPDE for all chromosome 20 locations showing ploidy >3 (as high as 13 in some cells at some locations) for all cells. Columns indicate chromosomal intervals measured in Mb, rows indicate individual cells. Chromosomal regions depicted (labeled along top x-axis) are representative of CNV segments outlined in red in Fig. 1e. Corresponding scRNA data shows elevated expression of AURKA, located within amplified HPDE region as a potential target of amplification. e scRNAseq data of HPNE and HPDE cell lines shows elevated expression of BRCA1 in >20% of HPNE cells, increased AUKRA expression in >20% of HPDE cells.
Fig. 3
Fig. 3. Custodial variability of MiaPaca2 cell lines drives transcriptomic heterogeneity.
a UMAP overlaying MP2 samples and their distinct clusters. b Bar graph displaying distribution of cells per MP2 culture across clusters; MP2-A in red, MP2-B in green and MP2-C in blue. c Bubble plot showing enrichment of pathways in MP2 cultures compared to each other with normalized enrichment score (NES) on the x-axis. Size of the bubble represents false discovery rate (FDR); red indicates upregulation, blue indicates downregulation of the pathway. d inferCNV heatmaps derived from scRNAseq data of all three MP2 samples, using HPNE as an analytical reference.
Fig. 4
Fig. 4. Evolution of divergent genomic subclones in MiaPaca2 strains has transcriptomic implications.
a Genomic clones 1 (orange) and 2 (blue) identified from scCNV data of MP2-B based on CNV events at chromosomes 7, 10, and 12. b Percentage of cells assigned to clones from scCNV and scRNA datasets. scCNV clones were mapped to corresponding scRNA data using CloneAlign. c UMAP data of MP2-B scRNA expression of single cells overlaid with CNV clones assignment for each cell; Clone 1 in green and Clone 2 in pink. df Same as ac for MP2-C.
Fig. 5
Fig. 5. Spheroid growth model promotes transcriptional heterogeneity and epigenetic remodeling.
a UMAP overlaying scRNA of Panc1 samples and their unique clusters. b Pathway enrichment profiles defined by GSEA analysis for Panc1-2D and Panc1-3D spheroid cell clusters. Size of dot represents FDR, red indicates upregulation, blue indicates downregulation of the pathway. c UMAP representing snATAC-seq data of merged Panc1 samples. d, e Analysis of merged Panc1 snATAC data shows enrichment in Sp/Klf motifs in spheroid data, and enrichment of Fos/Jun motifs in 2D monolayer culture. f Comparison of expression of genes associated with Sp/Klf transcription factors in scRNA of Panc1 2D and Panc1 3D. g Comparison of expression of genes associated with Fos/Jun transcription factors in scRNA of Panc1 2D and Panc1 3D.
Fig. 6
Fig. 6. Patient-derived organoids evolve with time.
a UMAP plot of cells from a different PDO at early (green) and late (purple, navy) passages. b Pseudotime analysis performed using Monocle of single cells from early (green) and late (purple, navy) passage organoids. c Branched heatmap (left) showing dynamic gene expression along the pseudotime trajectory for each cell fate in b. Pseudotime progresses from left to right. Enriched Gene Ontology biological process terms for each gene cluster are listed on the right. d Heatmap showing inferred copy number alterations of early and late passage organoids. Cells (rows) are ordered by pseudotime. Red represents copy number gains and blue represents copy number losses. e Comparison of expression of Moffitt Basal subtype genes in scRNA of early (bottom) vs. late (top) PDO1. f Comparison of expression of Moffitt Classical subtype genes in scRNA of early (bottom) vs. late (top) PDO1.

References

    1. McDonald OG, et al. Epigenomic reprogramming during pancreatic cancer progression links anabolic glucose metabolism to distant metastasis. Nat. Genet. 2017;49:367–376. doi: 10.1038/ng.3753. - DOI - PMC - PubMed
    1. Cancer Genome Atlas Research Network. Integrated genomic characterization of pancreatic ductal adenocarcinoma. Cancer Cell. 2017;32:185–203.e113. doi: 10.1016/j.ccell.2017.07.007. - DOI - PMC - PubMed
    1. Harada T, et al. Genome-wide DNA copy number analysis in pancreatic cancer using high-density single nucleotide polymorphism arrays. Oncogene. 2008;27:1951–1960. doi: 10.1038/sj.onc.1210832. - DOI - PMC - PubMed
    1. Ruggeri B, et al. Human pancreatic carcinomas and cell lines reveal frequent and multiple alterations in the p53 and Rb-1 tumor-suppressor genes. Oncogene. 1992;7:1503–1511. - PubMed
    1. Liu Y, et al. Multi-omic measurements of heterogeneity in HeLa cells across laboratories. Nat. Biotechnol. 2019;37:314–322. doi: 10.1038/s41587-019-0037-y. - DOI - PubMed

Publication types

MeSH terms