. 2022 Jun 25;12(1):10824.
doi: 10.1038/s41598-022-14224-8.

Optimizing process-based models to predict current and future soil organic carbon stocks at high-resolution

Affiliations

Optimizing process-based models to predict current and future soil organic carbon stocks at high-resolution

Derek Pierson et al. Sci Rep. .

Abstract

From hillslope to small catchment scales (< 50 km2), soil carbon management and mitigation policies rely on estimates and projections of soil organic carbon (SOC) stocks. Here we apply a process-based modeling approach that parameterizes the MIcrobial-MIneral Carbon Stabilization (MIMICS) model with SOC measurements and remotely sensed environmental data from the Reynolds Creek Experimental Watershed in SW Idaho, USA. Calibrating model parameters reduced error between simulated and observed SOC stocks by 25%, relative to the initial parameter estimates and better captured local gradients in climate and productivity. The calibrated parameter ensemble was used to produce spatially continuous, high-resolution (10 m2) estimates of stocks and associated uncertainties of litter, microbial biomass, particulate, and protected SOC pools across the complex landscape. Subsequent projections of SOC response to idealized environmental disturbances illustrate the spatial complexity of potential SOC vulnerabilities across the watershed. Parametric uncertainty generated physicochemically protected soil C stocks that varied by a mean factor of 4.4 × across individual locations in the watershed and a - 14.9 to + 20.4% range in potential SOC stock response to idealized disturbances, illustrating the need for additional measurements of soil carbon fractions and their turnover time to improve confidence in the MIMICS simulations of SOC dynamics.


Conflict of interest statement

The authors declare no competing interests.

Figures

Figure 1
Figure 1
Diagram of the MIcrobial-MIneral Carbon Stabilization (MIMICS) model, which explicitly considers microbial functional diversity by simulating two functional groups (MICr, inefficient, fast-growers; MICK, conservative, slow-growers) and their potential effects on litter decomposition and soil organic matter persistence (available SOMa; chemically protected SOMc; physically protected SOMp). Litter C inputs are initially partitioned (fmet) between litter pools (structural LITs; metabolic LITm), while a lesser fraction (fi) transfers directly to the SOM pools. Parameters used for model calibration and validation related to microbial catabolic capacity (Vmax and Kes, blue lines), microbial anabolism (MGE and τ, green lines), and physicochemical protection of SOM (fp and D, orange lines). See also Table 1.
Figure 2
Figure 2
Comparison of the MIMICS model estimates with observed soil organic carbon stocks (kg C m2, 0–30 cm soil depth) at locations across the Reynolds Creek Experimental Watershed and Critical Zone Observatory (n = 89). Black dots and associated error bars denote the mean ± standard deviation of the model estimates produced using each member of the optimized parameter ensemble. Grey triangles represent MIMICS estimates using the default MIMICS model parameterization. (Generated by free software R, https://www.R-project.org/).
Figure 3
Figure 3
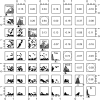
MIMICS model parameter space and relationships among parameters in the parameter ensemble that produced similarly accurate (RMSE 1.8–2.0) estimates of total soil organic C stocks across the Reynolds Creek Experimental Watershed and Critical Zone Observatory (n = 30 member parameter ensemble). Normalized parameter range coincides with the scaling factor proposal range for each parameter (see Table 1). Histograms on the diagonal represent the uncertainty in parameter estimates from the parameter ensemble. Triangles below histograms represent default (closed) and best-fit (open) parameter values. Off-diagonal panels display pairwise correlations and correlation coefficients between individual parameters, with statistically significant correlations circled (p < 0.05). *Default parameter line for D is beyond plot scale (Ddefault = 3.1). (Generated by free software R, https://www.R-project.org/).
Figure 4
Figure 4
MIMICS estimate variability relative to observed SOC stocks for the best (lowest RMSE) MC determined parameterization and a larger ensemble of MIMICS model parameterizations (n = 30) with SOC stock estimate RMSE < 2. (Generated by free software R, https://www.R-project.org/).
Figure 5
Figure 5
Ensemble (A) mean and (B) standard deviation of total soil organic carbon stocks simulated by the MIMICS model across the natural area of the Reynolds Creek Experimental Watershed and Critical Zone Observatory from 0–30 cm soil depth (n = 30 maps of soil C generated by the parameter ensemble produced from model calibration with site observations; Fig. 3a). (Generated by free software R, https://www.R-project.org/).
Figure 6
Figure 6
Ensemble (A) mean and (B) standard deviation of soil carbon pool stocks for 0–30 cm soil depth across the natural area of the Reynolds Creek Experimental Watershed and Critical Zone Observatory (n = 30 maps of soil C generated by the parameter ensemble produced from model calibration with site observations; Fig. 3a). (Generated by free software R, https://www.R-project.org/).
Figure 7
Figure 7
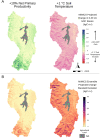
MIMICS projected (A) total change and (B) parametric uncertainty for change in 0–30 cm soil carbon stocks from 10% increase in net primary productivity (NPP) or 1 °C increase in mean annual soil temperature. (Generated by free software R, https://www.R-project.org/).

References

    1. Hengl T, et al. SoilGrids250m: Global gridded soil information based on machine learning. PLoS ONE. 2017;12:1. doi: 10.1371/journal.pone.0169748. - DOI - PMC - PubMed
    1. Janzen HH. Carbon cycling in earth systems - A soil science perspective. Agric. Ecosyst. Environ. 2004;104:399–417. doi: 10.1016/j.agee.2004.01.040. - DOI
    1. Biskaborn BK, et al. Permafrost is warming at a global scale. Nat. Commun. 2019;10:1–11. doi: 10.1038/s41467-018-08240-4. - DOI - PMC - PubMed
    1. Díaz S, et al. Pervasive human-driven decline of life on Earth points to the need for transformative change. Science (80-.) 2019;366:1. doi: 10.1126/science.aax3100. - DOI - PubMed
    1. Nerem RS, et al. Climate-change–driven accelerated sea-level rise detected in the altimeter era. Proc. Natl. Acad. Sci. USA. 2018;115:2022–2025. doi: 10.1073/pnas.1717312115. - DOI - PMC - PubMed

Publication types