. 2022 Aug 2;121(15):2981-2993.
doi: 10.1016/j.bpj.2022.06.023. Epub 2022 Jun 25.

Systematic measurements of interleaflet friction in supported bilayers

Affiliations

Systematic measurements of interleaflet friction in supported bilayers

Autumn A Anthony et al. Biophys J. .

Abstract

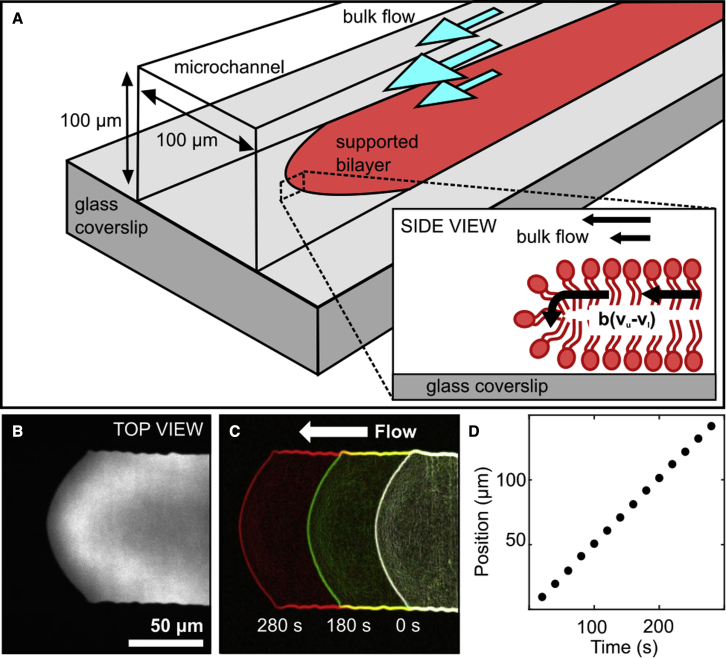
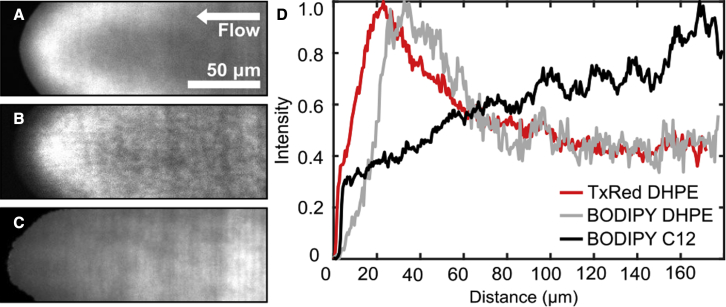
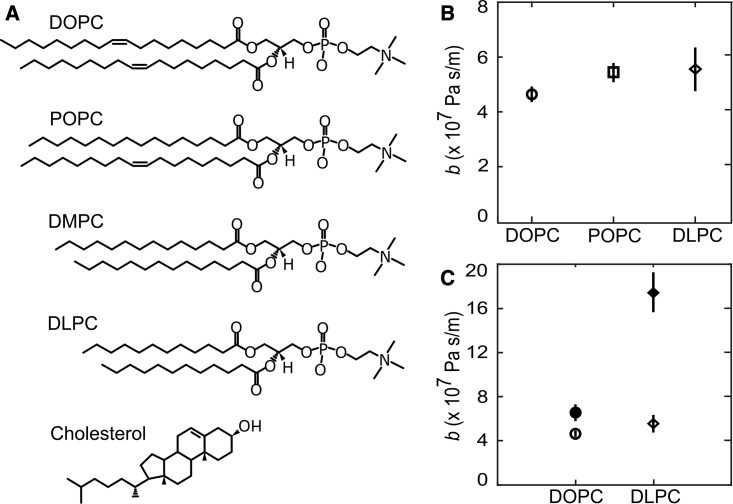
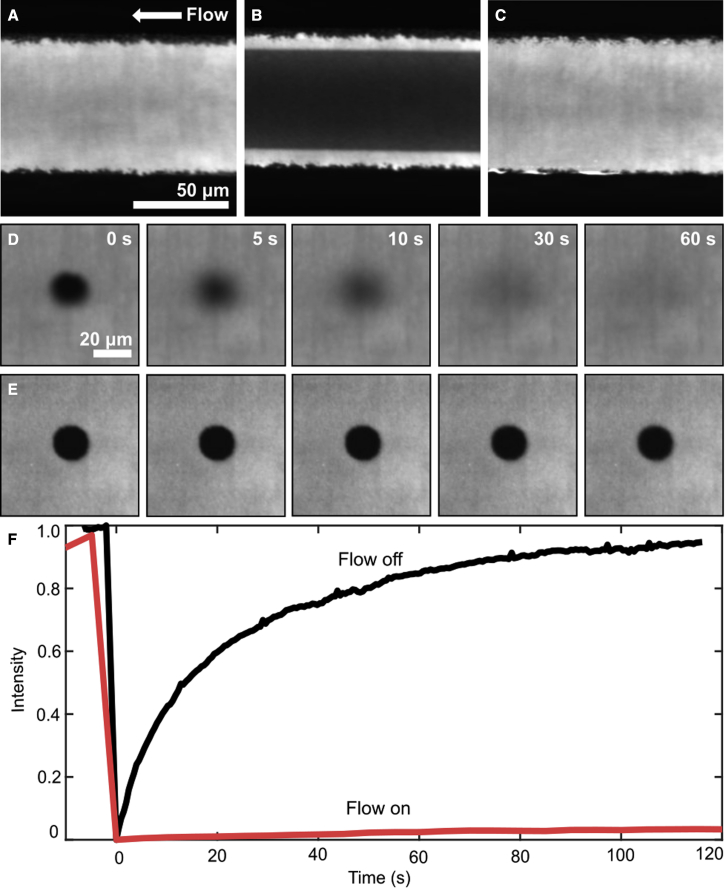
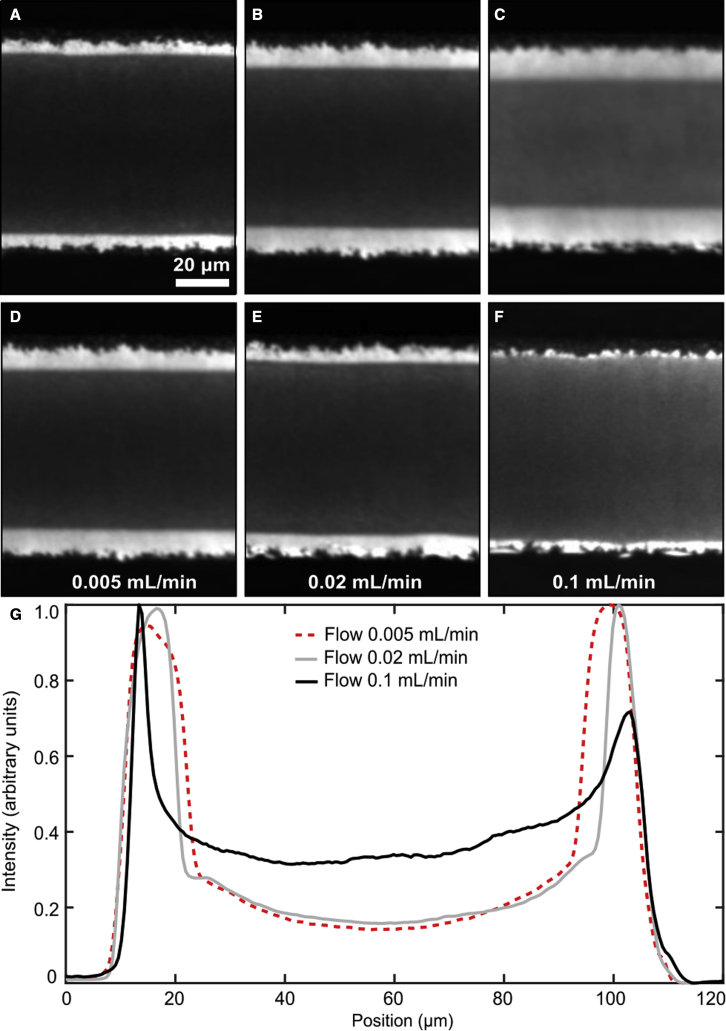
When lipid membranes curve or are subjected to strong shear forces, the two apposed leaflets of the bilayer slide past each other. The drag that one leaflet creates on the other is quantified by the coefficient of interleaflet friction, b. Existing measurements of this coefficient range over several orders of magnitude, so we used a recently developed microfluidic technique to measure it systematically in supported lipid membranes. Fluid shear stress was used to force the top leaflet of a supported membrane to slide over the stationary lower leaflet. Here, we show that this technique yields a reproducible measurement of the friction coefficient and is sensitive enough to detect differences in friction between membranes made from saturated and unsaturated lipids. Adding cholesterol to saturated and unsaturated membranes increased interleaflet friction significantly. We also discovered that fluid shear stress can reversibly induce gel phase in supported lipid bilayers that are close to the gel-transition temperature.


Conflict of interest statement

Declaration of interests The authors declare no competing interests.

Figures

Figure 1
Figure 1
Microfluidic measurement of interleaflet friction. (A) Pressure-driven shear flow of the buffer causes the supported bilayer to tank tread along the microchannel. (B) The leading edge of a DOPC bilayer labeled with TxRed DHPE. (C) The bilayer leading edge, identified using edge detection in ImageJ, moves in the direction of flow (right to left) with constant velocity (D). To see this figure in color, go online.
Figure 2
Figure 2
(AC) The T-shaped channel design (A) was first created in 100 μm-thick SU-8 resin (B and C) then negatives were replicated in PDMS. (D and E) The supported bilayer was formed on the right-hand side of the channel by injecting both large unilamellar vesicles and buffer (D), followed by closing ports 2 and 3 and using flow to drive the supported bilayer toward port 4 (E). The leading edge of the bilayer was imaged while moving between the location indicated by arrow (c) toward arrows (b) and (a). To see this figure in color, go online.
Figure 3
Figure 3
We measured the coefficient of interleaflet friction b in DOPC bilayers in nine independent trials using three different flow rates. Results are plotted versus the average shear stress at the lower coverslip, σ. Error bars indicate the estimated uncertainty for each friction measurement due to variation in microfluidic channel height. Measured friction values do not show a strong trend with shear stress over the range that we investigated.
Figure 4
Figure 4
Left: structures of the fluorescent lipids used in this study. Right: measured values for the coefficient of interleaflet friction DOPC bilayers containing 0.8 mol % of each fluorescent dye. Values are the average of nine measurements and error bars show one standard deviation.
Figure 5
Figure 5
Fluorescent dye distributions in tank-treading DOPC membranes. (AC) TxRed DHPE (A) and BODIPY DHPE (B) peak behind the membrane leading edge, while BODIPY C12 fluorescence (C) is depleted near the edge. Profiles of normalized intensity along the center of the bilayer are shown in (D), with the bilayer front edge position set to zero. To see this figure in color, go online.
Figure 6
Figure 6
(A) Chemical structures of the lipids used in this experiment. (B) Measured values of coefficients of interleaflet friction for DOPC, POPC, and DLPC. (C) Coefficients of interleaflet friction for DOPC and DLPC with 0 (open markers) and 30% (solid markers) cholesterol with 0.8 mol % TxRed DHPE. With the exception of DLPC, values shown are averages over at least 9 measurements at 3 different flow rates; error bars are one standard deviation wide. We were not able to determine a friction coefficient for DMPC.
Figure 7
Figure 7
(A) DMPC bilayer before flow is applied. (B) Bilayer during a flow of 0.005 mL/min (0.64 Pa). The brighter edges of the bilayer remain fluid. At this low shear stress, the bilayer is unlikely to be tank treading. Images were recorded at approximately position (b) as indicated in Fig. 2A after depositing large unilamellar vesicles in the left-hand arm of the channel instead of the right-hand one. (C) Fluorescence intensity recovers to its former value about 10 min after stopping flow. (D and E) FRAP images of a DMPC bilayer (D) before and (E) during flow. To improve visibility, we adjusted contrast of images in (E) to match those in (D) and matched contrast for images (A)–(C). (F) FRAP recovery time increased sharply with flow on. To see this figure in color, go online.
Figure 8
Figure 8
The width of the gel region depends on the fluid pressure in the channel as well as on the magnitude of the shear stress. (AC) Images are shown near the inlet (A), center (B), and outlet (C) of the same channel at a single flow rate (0.005 mL/min). Images in (A), (B), and (C) were recorded close to the locations (a), (b), and (c), as indicated in Fig. 2A, respectively (flow direction was reversed in this experiment). (D)–(F) show the central region of the channel (near location b) at three different flow rates, which forms a wider gel phase region in the center. (G) shows the intensity averaged along the channel length for the same flow rates shown in (D)–(F). Image contrast in all panels, and intensities shown in (G), were normalized to the brightest region in the image. To see this figure in color, go online.

Similar articles

Cited by

References

    1. Keller S., Bezrukov S., et al. Parsegian V. Probability of alamethicin conductance states varies with nonlamellar tendency of bilayer phospholipids. Biophys. J. 1993;65:23–27. doi: 10.1016/s0006-3495(93)81040-3. https://linkinghub.elsevier.com/retrieve/pii/S0006349593810403 - DOI - PMC - PubMed
    1. Stone M.B., Shelby S.A., et al. Veatch S.L. Protein sorting by lipid phase-like domains supports emergent signaling function in B lymphocyte plasma membranes. eLife. 2017;6:e19891. doi: 10.7554/elife.19891. https://elifesciences.org/articles/19891 - DOI - PMC - PubMed
    1. Raghupathy R., Anilkumar A.A., et al. Mayor S. Transbilayer lipid interactions mediate nanoclustering of lipid-anchored proteins. Cell. 2015;161:581–594. doi: 10.1016/j.cell.2015.03.048. https://linkinghub.elsevier.com/retrieve/pii/S0092867415003682 - DOI - PMC - PubMed
    1. Levental K.R., Malmberg E., et al. Levental I. Lipidomic and biophysical homeostasis of mammalian membranes counteracts dietary lipid perturbations to maintain cellular fitness. Nat. Commun. 2020;11:1339. doi: 10.1038/s41467-020-15203-1. http://www.nature.com/articles/s41467-020-15203-1 - DOI - PMC - PubMed
    1. Falk K., Fillot N., et al. Loison C. Interleaflet sliding in lipidic bilayers under shear flow: comparison of the gel and fluid phases using reversed non-equilibrium molecular dynamics simulations. Phys. Chem. Chem. Phys. 2014;16:2154–2166. doi: 10.1039/c3cp53238k. http://xlink.rsc.org/?DOI=C3CP53238K - DOI - PubMed

Publication types