. 2022 Sep 2;12(9):2074-2097.
doi: 10.1158/2159-8290.CD-21-0576.

Drug-Induced Epigenomic Plasticity Reprograms Circadian Rhythm Regulation to Drive Prostate Cancer toward Androgen Independence

Affiliations

Drug-Induced Epigenomic Plasticity Reprograms Circadian Rhythm Regulation to Drive Prostate Cancer toward Androgen Independence

Simon Linder et al. Cancer Discov. .

Abstract

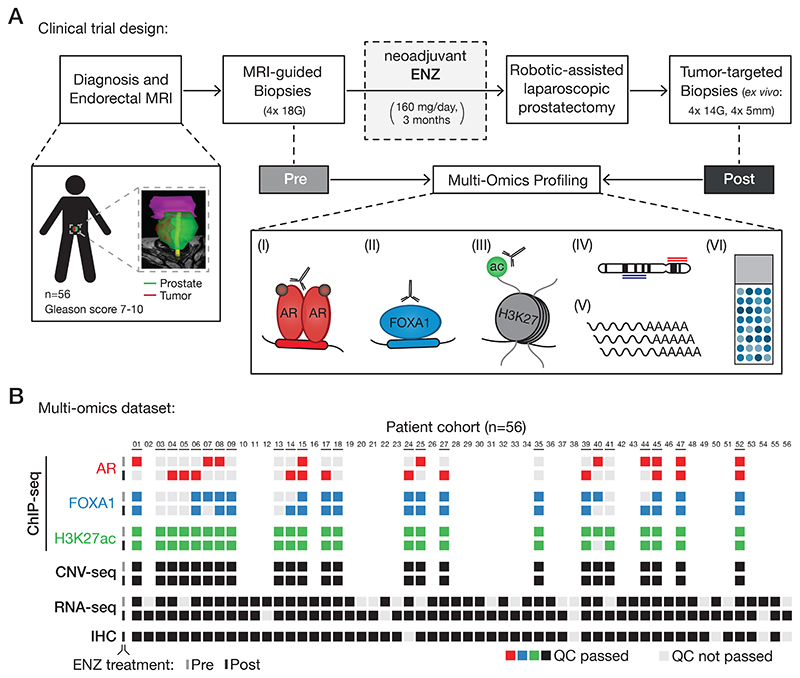
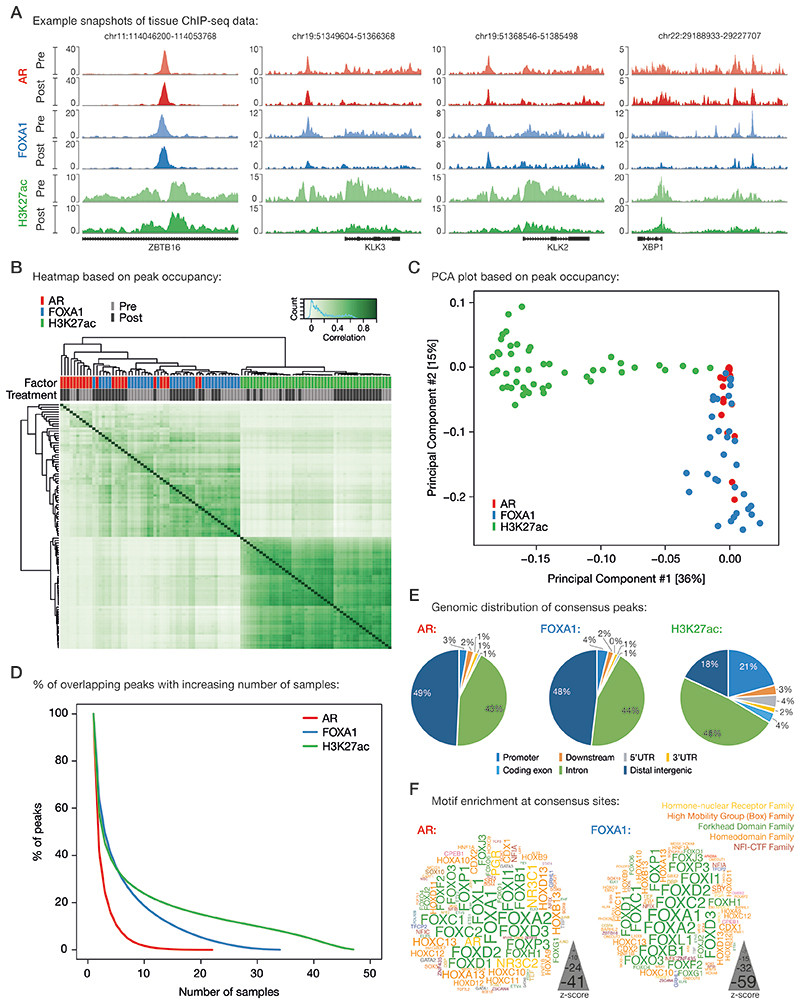
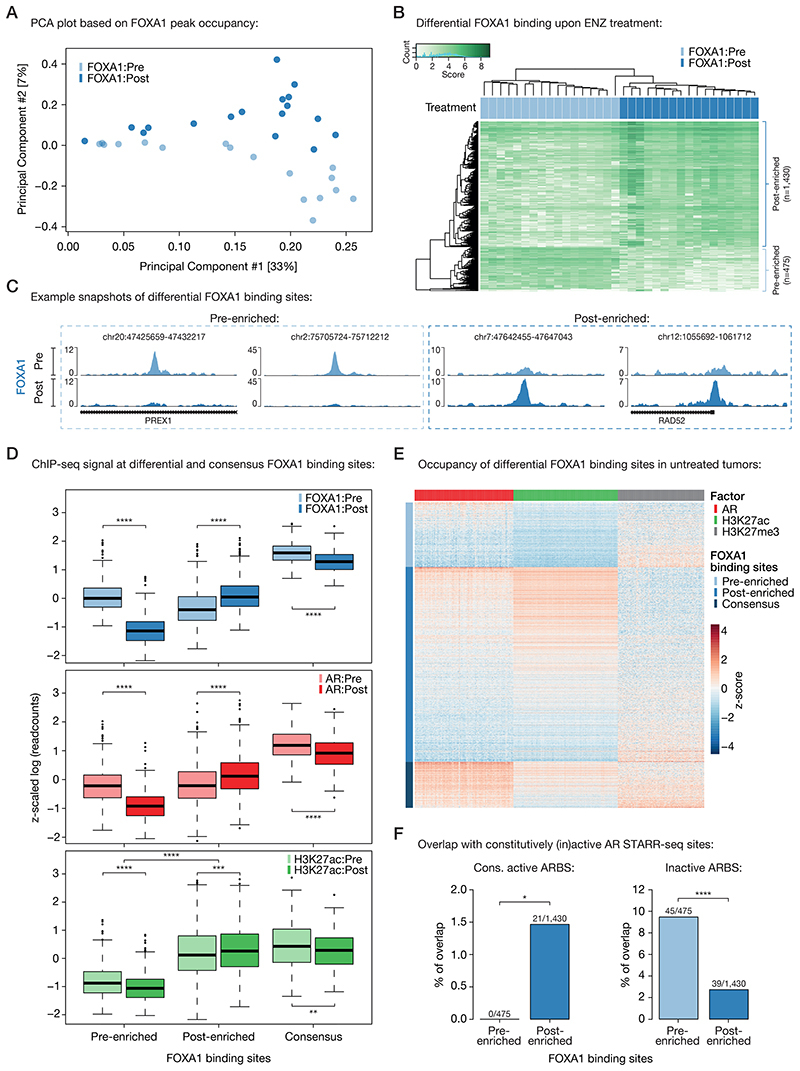
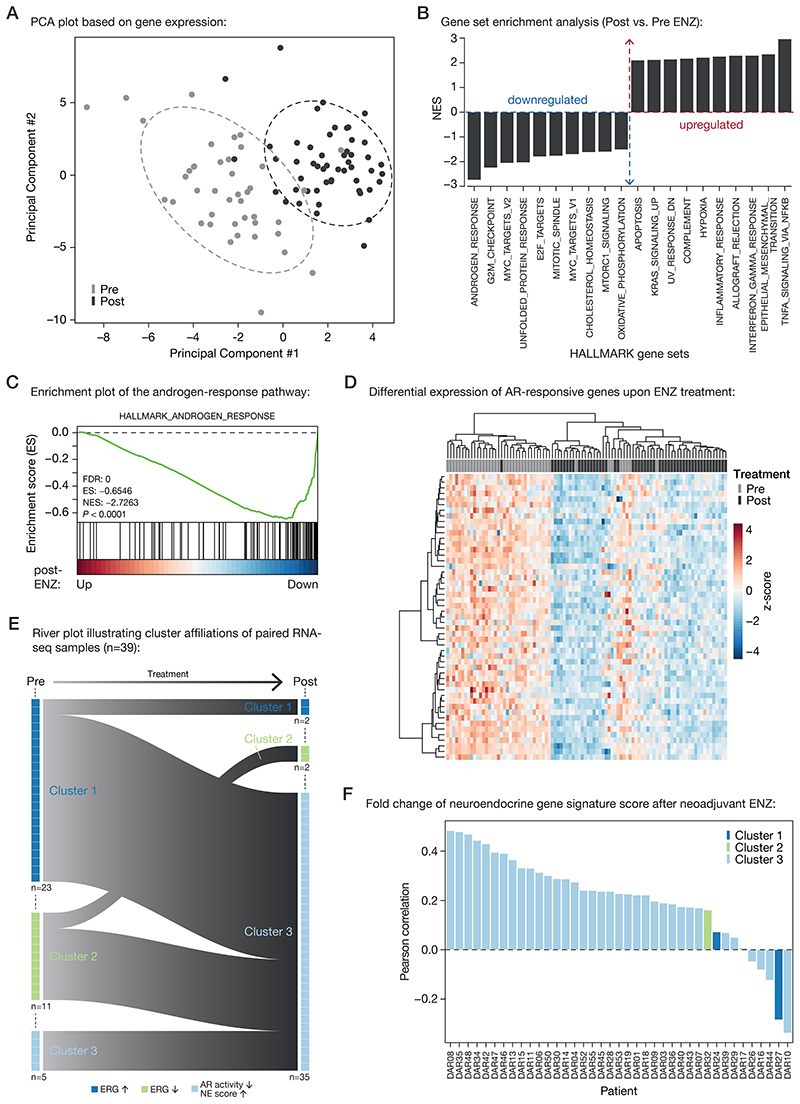
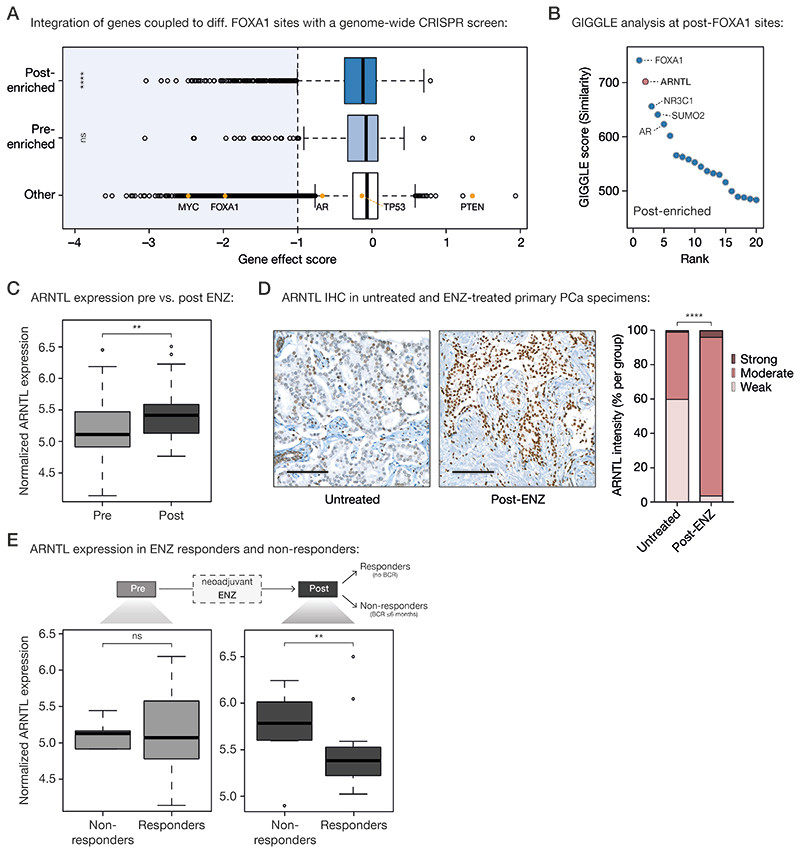
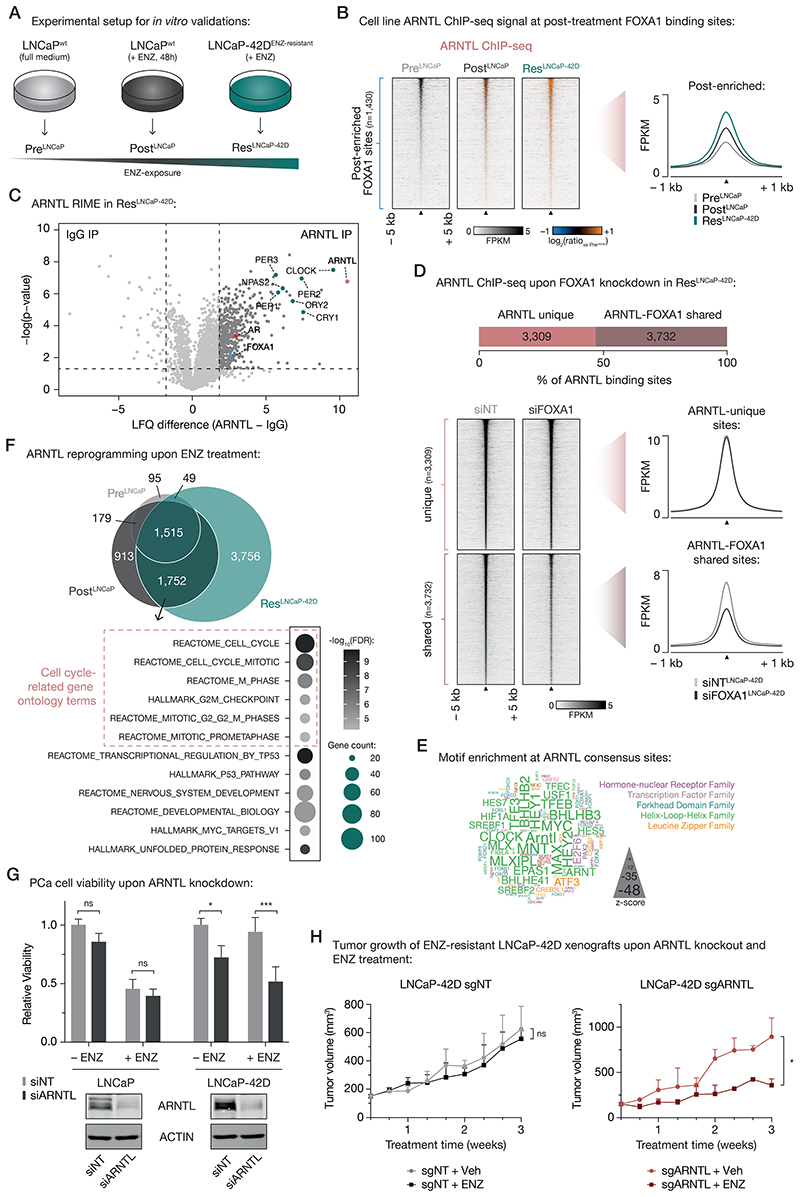
In prostate cancer, androgen receptor (AR)-targeting agents are very effective in various disease stages. However, therapy resistance inevitably occurs, and little is known about how tumor cells adapt to bypass AR suppression. Here, we performed integrative multiomics analyses on tissues isolated before and after 3 months of AR-targeting enzalutamide monotherapy from patients with high-risk prostate cancer enrolled in a neoadjuvant clinical trial. Transcriptomic analyses demonstrated that AR inhibition drove tumors toward a neuroendocrine-like disease state. Additionally, epigenomic profiling revealed massive enzalutamide-induced reprogramming of pioneer factor FOXA1 from inactive chromatin sites toward active cis-regulatory elements that dictate prosurvival signals. Notably, treatment-induced FOXA1 sites were enriched for the circadian clock component ARNTL. Posttreatment ARNTL levels were associated with patients' clinical outcomes, and ARNTL knockout strongly decreased prostate cancer cell growth. Our data highlight a remarkable cistromic plasticity of FOXA1 following AR-targeted therapy and revealed an acquired dependency on the circadian regulator ARNTL, a novel candidate therapeutic target.

Significance: Understanding how prostate cancers adapt to AR-targeted interventions is critical for identifying novel drug targets to improve the clinical management of treatment-resistant disease. Our study revealed an enzalutamide-induced epigenomic plasticity toward prosurvival signaling and uncovered the circadian regulator ARNTL as an acquired vulnerability after AR inhibition, presenting a novel lead for therapeutic development. See related commentary by Zhang et al., p. 2017. This article is highlighted in the In This Issue feature, p. 2007.


Conflict of interest statement

Declaration of Potential Conflicts of Interest

W. Zwart, A.M. Bergman and H. van der Poel received research funding from Astellas Pharma B.V. (Leiden, the Netherlands). No potential conflicts of interest were disclosed by the other authors.

Figures

Figure 1
Figure 1. Clinical trial design and omics data sample collection.
(A) Study design of the DARANA trial (NCT03297385). Multi-omics profiling, consisting of (I) Androgen Receptor (AR) ChIP-seq, (II) FOXA1 ChIP-seq, (III) H3K27ac ChIP-seq, (IV) DNA copy number sequencing (CNV-seq), (V) gene expression profiling (RNA-seq) and (VI) immunohistochemistry (IHC) analysis, was performed on MRI-guided biopsy samples prior to ENZ treatment (Pre) and tumor-target prostatectomy specimens after 3 months of neoadjuvant ENZ therapy (Post). (B) Overview of data availability and quality control analyses for each sample. Individual data streams are indicated separately with ChIP-seq for AR (red), FOXA1 (blue), H3K27ac (green), CNV-seq, RNA-seq and IHC (all black). The ENZ treatment status indicates the pre-treatment (top) and post-treatment samples (bottom) per omics dataset. Samples not passing QC (light gray) were successfully applied for focused raw data analyses. Blank spots for ChIP-seq or CNV-seq samples indicate that the fresh-frozen material didn’t pass the tumor cell percentage cutoff of ≥ 50%.
Figure 2
Figure 2. Characterization of tissue ChIP-seq data streams.
(A) Representative example snapshots of AR (red), FOXA1 (blue) and H3K27ac (green) ChIP-seq data for four genomic loci in one patient. Pre- (light colors) and post-ENZ treatment (dark colors) is indicated. Y-axes indicate ChIP-seq signal in fragments per kilobase per million reads mapped (FPKM). (B) Correlation heatmap based on peak occupancy. Clustering of the samples is based on all called peaks and represents Pearson correlations between individual ChIP-seq samples. The column color bars indicate the ChIP-seq factor (AR, FOXA1, H3K27ac) and treatment status (Pre, Post). (C) Principal component analysis (PCA) plot based on peak occupancy. Each dot represents a ChIP-seq sample that is colored per factor. (D) Elbow plot depicting the peak overlap between ChIP-seq samples per factor. Shown is the percentage of overlapping peaks with increasing number of samples. Consensus peaksets were designed by using a cutoff of peaks present in at least 3 AR, 7 FOXA1, or 13 H3K27ac samples. (E) Pie charts showing the genomic distribution of AR (left), FOXA1 (middle) and H3K27ac (right) consensus peaks. (F) Word clouds show motif enrichment at AR (left) and FOXA1 (right) consensus sites. The font size represents the z-score and colors correspond to transcription factor families.
Figure 3
Figure 3. Differential FOXA1 binding upon ENZ treatment.
(A) Principal component analysis (PCA) plot based on peak occupancy of FOXA1 ChIP-seq data. Color indicates pre-treatment (light blue) and post-treatment (dark blue) FOXA1 samples. (B) Coverage heatmap depicting differential FOXA1 binding sites, selectively enriched in the pre-treatment (n=475) or post-treatment (n=1,430) setting. (C) Representative example snapshots of FOXA1 ChIP-seq signal at two pre-enriched (left) and two post-enriched (right) FOXA1 sites in one patient (DAR45). Pre- (light blue) and post-ENZ treatment (dark blue) is indicated. Y-axes indicate ChIP-seq signal in FPKM. (D) Boxplots indicating ChIP-seq signal (z-scaled readcounts) at pre-enriched (n=475), post-enriched (n=1,430) and consensus FOXA1 peaks (shared by ≥ 30 patients; n=338) for FOXA1 (blue), AR (red), and H3K27ac (green) ChIP-seq datasets before (Pre; light colors) and after (Post; dark colors) ENZ treatment. **, P < 0.01; ***, P < 0.001; ****, P < 0.0001 (Mann-Whitney U-test adjusted for multiple testing using FDR). (E) Coverage heatmap showing occupancy of differential (pre-/post-enriched) and consensus FOXA1 peaks in an external ChIP-seq dataset consisting of 100 untreated primary tumors (31). Heatmap color indicates region read counts (z-score) at pre-enriched, post-enriched and consensus FOXA1 sites (rows) in the AR (red), H3K27ac (green) and H3K27me3 (gray) ChIP-seq data streams (columns). (F) Bar chart representing the overlap between differential FOXA1 sites (pre-enriched or post-enriched) and constitutively active (left) or inactive (right) AR binding sites (ARBS), based on STARR-seq. *, P < 0.05; ****, P < 0.0001 (Fisher’s exact test).
Figure 4
Figure 4. Neoadjuvant ENZ deactivates AR signaling and induces neuroendocrine (NE)-like gene expression signatures.
(A) Principal component analysis (PCA) plot based on gene expression data. Color indicates pre-treatment (gray) and post-treatment (black) samples. Ellipses are based on the 80% confidence interval. (B) Gene set enrichment analyses (GSEA) for Hallmark gene sets. Shown are the top differentially enriched pathways upon ENZ treatment. Y-axis indicates the normalized enrichment score (NES). (C) Enrichment plot of the Hallmark Androgen Response pathway. Genes are ranked by differential expression upon ENZ treatment based on patient RNA-seq data (post vs. pre). Y-axis indicates enrichment score (ES). GSEA statistics (FDR, ES, NES, nominal P-value) are indicated. (D) Unsupervised hierarchical clustering of pre- and post-treatment RNA-seq samples based on the expression of AR-responsive genes. Color scale indicates gene expression (z-score). (E) River plot showing state transitions between Clusters 1 (dark blue), Cluster 2 (green) and Cluster 3 (light blue) for paired pre-treatment and post-treatment RNA-seq samples (n=39). Number of samples assigned to each cluster before and after treatment as well as the hallmarks per cluster are indicated. (F) Waterfall plot depicting the Pearson correlation of neuroendocrine gene expression signature fold changes upon ENZ treatment per patient. Colors indicate the patients cluster affiliations after treatment.
Figure 5
Figure 5. Acquired FOXA1 sites drive key-survival genes that are under control of circadian rhythm regulator ARNTL.
(A) Boxplot showing DepMap (20Q1) genome-wide loss-of-function CRISPR screen data for VCaP PCa cells, separately analyzing the gene effect score of genes associated with post-enriched FOXA1 sites (top), pre-enriched FOXA1 sites (middle) or all other tested genes (bottom). Differential FOXA1 binding sites were coupled to their respective target genes using H3K27ac HiChIP data. Indicated as controls are PCa-relevant driver genes: oncogenes MYC, FOXA1, AR, TP53 and tumor suppressor PTEN. The recommended stringent gene effect score cutoff of -1 is shown (dotted vertical line) and all genes passing the essentiality threshold are highlighted in light blue. ns, P > 0.05; ****, P < 0.0001 (Fisher’s exact test). (B) Dot plot representing ranked GIGGLE similarity scores for transcriptional regulators identified at post-treatment FOXA1 sites. The top 20 identified factors are shown, and the 5 most enriched factors are labeled. (C) Boxplot showing normalized ARNTL gene expression before and after 3 months of neoadjuvant ENZ treatment. **, P < 0.01 (Mann-Whitney U-test). (D) Representative ARNTL immunohistochemistry (IHC) stainings (left) and quantification of ARNTL staining intensity (right) in tissue microarrays consisting of prostatectomy specimens from untreated patients (not receiving neoadjuvant ENZ; n=110) and DARANA patients post-ENZ (n=51). Scale bars, 100 μm. ****, P < 0.0001 (Fisher’s exact test). (E) Boxplots depicting normalized ARNTL gene expression in ENZ non-responders (biochemical recurrence (BCR) ≤ 6 months; n=8) and responders (no BCR; n=29) in the pre- (left) and post- (right) treatment setting separately. ns, P > 0.05; **, P < 0.01 (Mann-Whitney U-test).
Figure 6
Figure 6. Treatment-induced dependency on ARNTL in ENZ-resistant PCa cells.
(A) Experimental setup for in vitro validation experiments. (B) Tornado plots (left) and average density plot (right) visualizing ARNTL ChIP-seq signal (in FPKM) at post-enriched FOXA1 binding sites in untreated (PreLNCaP), short-term ENZ-treated (PostLNCaP), and ENZ-resistant NE-like LNCaP cells (ResLNCaP-42D). Data are centered at post-treatment FOXA1 peaks depicting a 5-kb (heatmaps) or 1-kb (density plots) window around the peak center. Heatmap color depicts the ChIP-seq signal compared to the untreated condition (PreLNCaP), with blue indicating lower peak intensity and orange indicating higher peak intensity. (n=2) (C) Volcano plot depicting ARNTL interactors in ENZ-treated LNCaP-42D (ResLNCaP-42D) cells over IgG control. Significantly enriched interactors are highlighted and significance cutoffs are shown as dotted lines (label-free quantification (LFQ) difference ≥ 1.8; P ≤ 0.05; n = 4). (D) Stacked bar chart (top) indicating the fraction of ARNTL binding sites in ENZ-treated LNCaP-42D (ResLNCaP-42D) cells that are ARNTL unique (n=3,309) or shared with FOXA1 (n=3,732). Tornado plots (lower left) and average density plot (lower right) visualize ARNTL ChIP-seq signal (in FPKM) at ARNTL unique or ARNTL-FOXA1 shared binding sites in LNCaP-42D cells upon transfection with non-targeting siRNA (siNT) or siFOXA1. Data are centered at ARNTL peaks depicting a 5-kb (heatmaps) or 1-kb (density plots) window around the peak center. (n=2) (E) Word cloud shows motif enrichment at ARNTL consensus sites (n=1,515) shown in (E). The font size represents the z-score and colors correspond to transcription factor families. Since the human ARNTL motif is not part of the tested database, the homologous mouse motif (Arntl) was included. (F) Venn diagram (top) indicating the overlap of ARNTL binding sites in all tested cell line conditions (PreLNCaP, PostLNCaP, ResLNCaP-42D). For each condition, only peaks present in both replicates were included. Gene ontology terms for ARNTL-bound gene sets uniquely shared between PostLNCaP and ResLNCaP-42D conditions are presented below. Overlapping ARNTL binding sites (n=1,752) were coupled to their respective target genes using H3K27ac HiChIP data. Color indicates the gene set enrichment (FDR q-value) and size depicts the number of genes that overlap with the indicated gene sets. Cell cycle-related gene ontology terms are highlighted. (G) Bar chart (top) showing relative cell viability of LNCaP (left) and LNCaP-42D (right) cells upon transfection with non-targeting siRNA (siNT) or siARNTL, and exposure to ENZ. Treatment is indicated and data is shown relative to the untreated (– ENZ) siNT condition per cell line (n=3). Western blots (bottom) indicate ARNTL protein levels in LNCaP (left) and LNCaP-42D (right) cells following siRNA-mediated silencing of ARNTL for 48 h. Transfection with siNT and staining for ACTIN are included as controls for siRNA treatment and protein loading, respectively. Images are representative of three independent experiments. ns, P > 0.05; *, P < 0.05; ***, P < 0.001 (two-way ANOVA followed by Tukey’s multiple comparisons test). (H) Growth curves depict tumor volume (measured 3 times per week using calipers) of non-targeting control (sgNT) or ARNTL knockout (sgARNTL) LNCaP-42D xenografts upon daily treatment with vehicle-alone (sgNT +Veh: n=4; sgARNTL +Veh: n=3) or ENZ (sgNT +ENZ: n=4; sgARNTL +ENZ: n=2). ns, P > 0.05; *, P < 0.05 (t-test).

Comment in

References

    1. Huggins C, Hodges CV. Studies on prostatic cancer. I. The effect of castration, of estrogen and androgen injection on serum phosphatases in metastatic carcinoma of the prostate. CA Cancer J Clin. 1972;22(4):232–40. doi: 10.3322/canjclin.22.4.232. - DOI - PubMed
    1. Zhang Z, Chng KR, Lingadahalli S, Chen Z, Liu MH, Do HH, et al. An AR-ERG transcriptional signature defined by long-range chromatin interactomes in prostate cancer cells. Genome Res. 2019;29(2):223–35. doi: 10.1101/gr.230243.117. - DOI - PMC - PubMed
    1. Stelloo S, Bergman AM, Zwart W. Androgen receptor enhancer usage and the chromatin regulatory landscape in human prostate cancers. Endocr Relat Cancer. 2019;26(5):R267–R85. doi: 10.1530/ERC-19-0032. - DOI - PubMed
    1. Stelloo S, Nevedomskaya E, Kim Y, Hoekman L, Bleijerveld OB, Mirza T, et al. Endogenous androgen receptor proteomic profiling reveals genomic subcomplex involved in prostate tumorigenesis. Oncogene. 2018;37(3):313–22. doi: 10.1038/onc.2017.330. - DOI - PubMed
    1. Pomerantz MM, Li F, Takeda DY, Lenci R, Chonkar A, Chabot M, et al. The androgen receptor cistrome is extensively reprogrammed in human prostate tumorigenesis. Nat Genet. 2015;47(11):1346–51. doi: 10.1038/ng.3419. - DOI - PMC - PubMed

Publication types

MeSH terms