. 2022 Aug 31;45(8):588-602.
doi: 10.14348/molcells.2022.0044. Epub 2022 Jun 27.

RNA Binding Protein Rbms1 Enables Neuronal Differentiation and Radial Migration during Neocortical Development by Binding and Stabilizing the RNA Message for Efr3a

Affiliations

RNA Binding Protein Rbms1 Enables Neuronal Differentiation and Radial Migration during Neocortical Development by Binding and Stabilizing the RNA Message for Efr3a

Khadija Habib et al. Mol Cells. .

Abstract

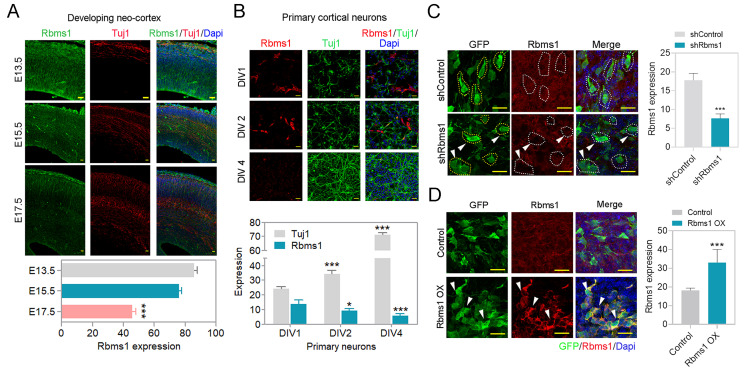
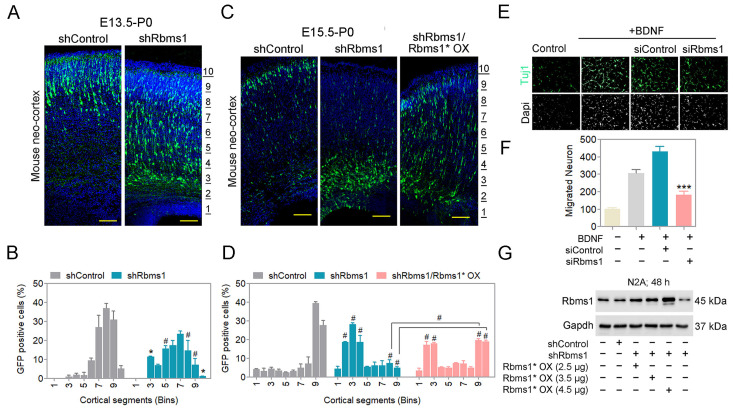
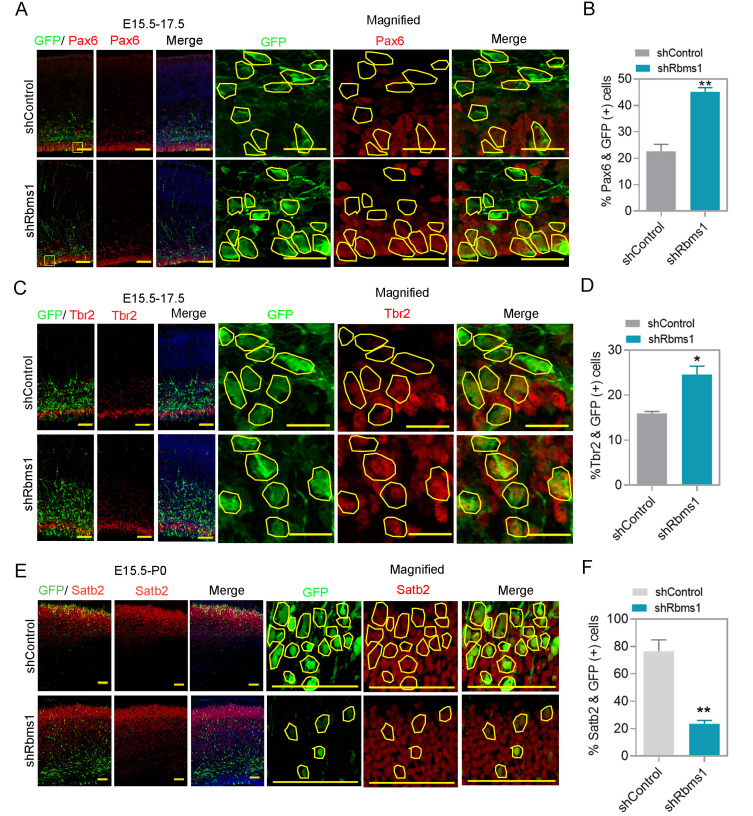
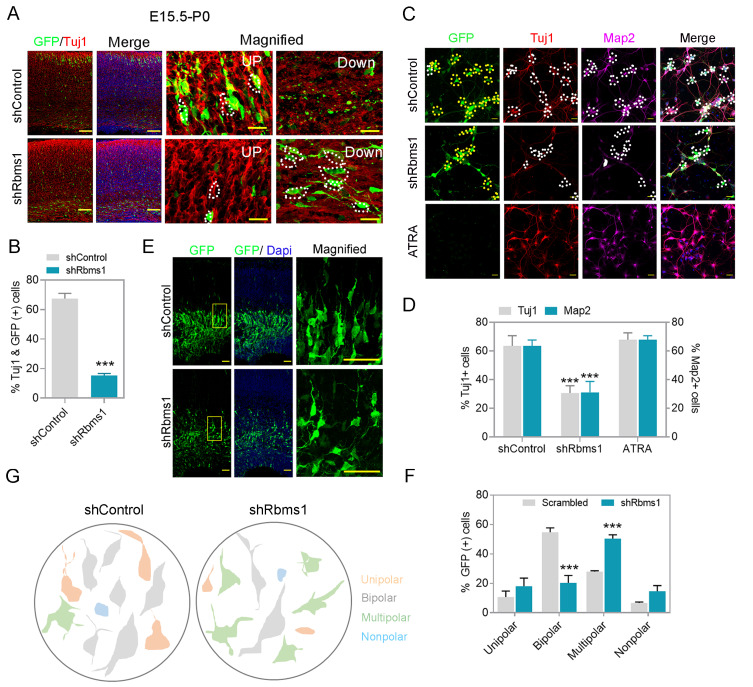
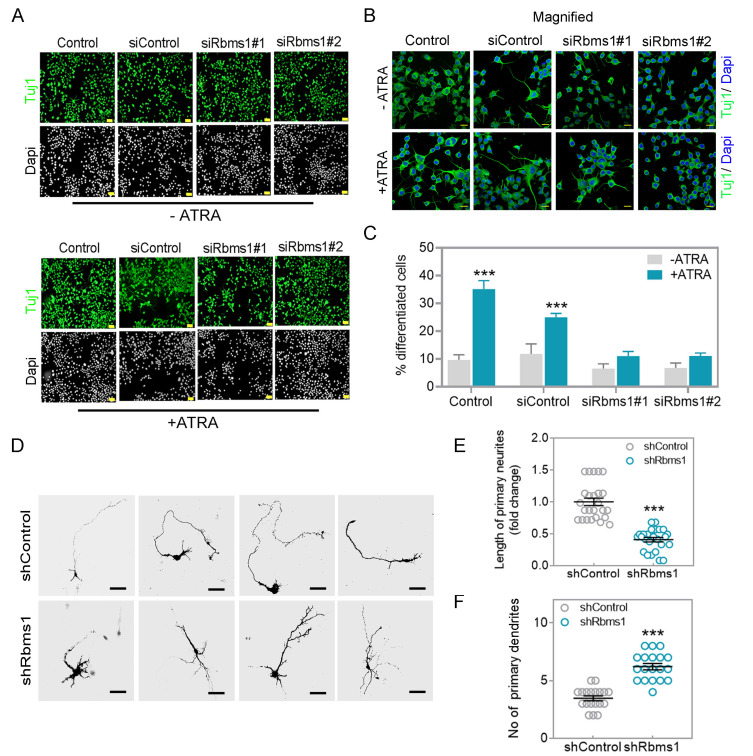
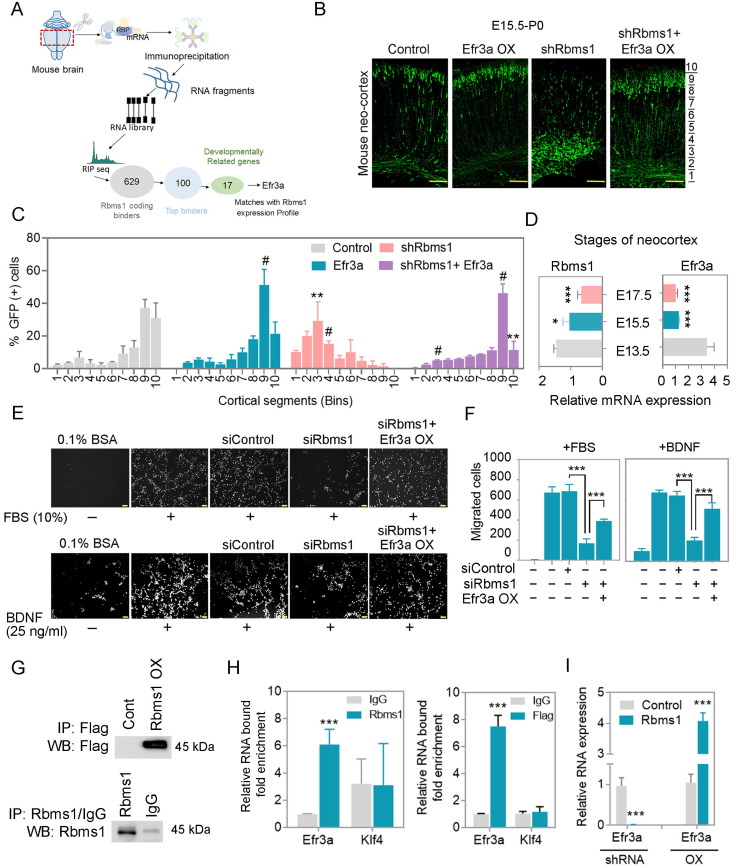
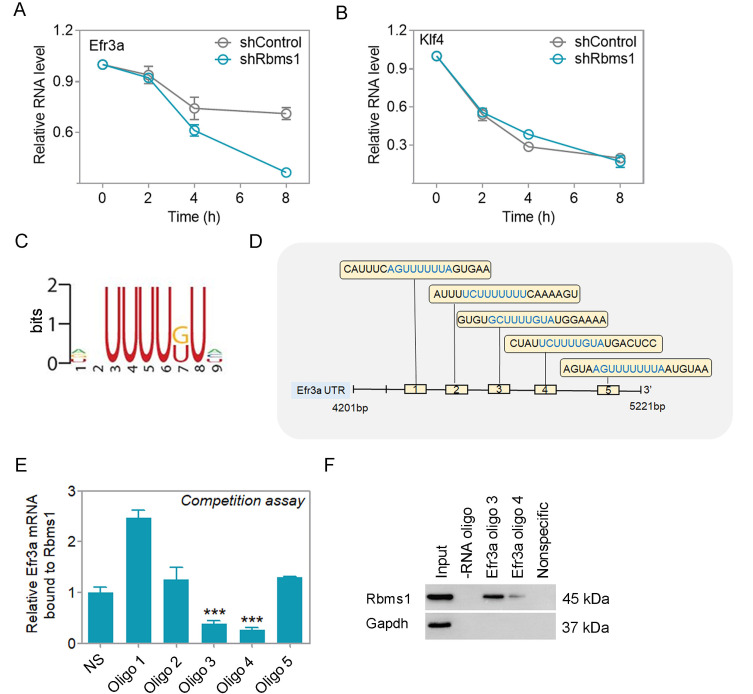
Various RNA-binding proteins (RBPs) are key components in RNA metabolism and contribute to several neurodevelop-mental disorders. To date, only a few of such RBPs have been characterized for their roles in neocortex development. Here, we show that the RBP, Rbms1, is required for radial migration, polarization and differentiation of neuronal progenitors to neurons in the neocortex development. Rbms1 expression is highest in the early development in the developing cortex, with its expression gradually diminishing from embryonic day 13.5 (E13.5) to postnatal day 0 (P0). From in utero electroporation (IUE) experiments when Rbms1 levels are knocked down in neuronal progenitors, their transition from multipolar to bipolar state is delayed and this is accompanied by a delay in radial migration of these cells. Reduced Rbms1 levels in vivo also reduces differentiation as evidenced by a decrease in levels of several differentiation markers, meanwhile having no significant effects on proliferation and cell cycle rates of these cells. As an RNA binding protein, we profiled the RNA binders of Rbms1 by a cross-linked-RIP sequencing assay, followed by quantitative real-time polymerase chain reaction verification and showed that Rbms1 binds and stabilizes the mRNA for Efr3a, a signaling adapter protein. We also demonstrate that ectopic Efr3a can recover the cells from the migration defects due to loss of Rbms1, both in vivo and in vitro migration assays with cultured cells. These imply that one of the functions of Rbms1 involves the stabilization of Efr3a RNA message, required for migration and maturation of neuronal progenitors in radial migration in the developing neocortex.

Keywords: Efr3a; RNA binding motif single stranded interacting protein 1; neurogenesis; radial migration.


Conflict of interest statement

CONFLICT OF INTEREST

The authors have no potential conflicts of interest to disclose.

Figures

Fig. 1
Fig. 1. Rbms1 is expressed in the developing cortex.
(A) Developmental expression pattern of Rbms1. Immunostaining for Tuj1 (red), Dapi (blue), and Rbms1 (green) in coronal sections of the E13.5, E15.5, and E17.5 mouse cortices. Scale bars = 20 µm. Data presented as mean ± SEM; Student’s t-test, ***P < 0.001. (B) Rbms1 expression from in vitro primary cortical neuron, Immunostaining for Tuj1 (green), Rbms1 (red), and Dapi (blue), at DIV1 (days in vitro), DIV2, and DIV4. Scale bars = 20 µm. Data presented as mean ± SEM; Student’s t-test, *P < 0.05 and ***P < 0.001. (C) Knockdown Rbms1 vector with corresponding control vector introduced by IUE at E15.5 and 48 h after harvested and immunostained against Rbms1 specific antibody, respective GFP labeled cells marked with yellow dots, and GFP and Rbms1 labeled cells marked with white dots and white arrowheads. Scale bars = 10 µm; their relative quantification in the right panel. Data presented as mean ± SEM; Student’s t-test, ***P < 0.001 (n = 3). (D) Overexpression Rbms1 vector with corresponding control vector introduced by IUE at E15.5 and 48 h after harvested and immunostained against Rbms1 specific antibody. Scale bars = 10 µm; their relative quantification in the right panel. Data presented as mean ± SEM; Student’s t-test, ***P < 0.001 (n = 3).
Fig. 2
Fig. 2. Knockdown of Rbms1 delayed radial migration during neurogenesis.
(A) Immunostaining of GFP (green) and Dapi (blue) mouse cortices at postnatal days 0, seven days after electroporation at E13.5 of Rbms1 knockdown vector (shRbms1) and backbone control vector. The area from the outer layer of the CP to the inner layer of the VZ was divided into ten different bins. Scale bars = 100 µM (n = 3 brain from three different injections). (B) Quantify the percentage of GFP positive cells in the ten different cortical segments (Bins) areas. Data presented as mean ± SEM; *P < 0.05, #P < 0.001 (n = 3, two-way ANOVA). (C) Immunostaining of GFP (green) and Dapi (blue) mouse cortices at postnatal days 0, five days after electroporation at E15.5 of Rbms1 knockdown vector (shRbms1) and backbone control vector and addback vector with knockdown Rbms1 vector. The area from the outer layer of the CP to the inner layer of the VZ was divided into ten different bins. Scale bars = 100 µM (n = 3 brain from three different injections). (D) Quantify the percentage of GFP positive cells in the ten different cortical segments (Bins) areas. Data presented as mean ± SEM; #P < 0.001 (n = 3, two-way ANOVA). (E) siRbms1 and si negative control transfected primary neuron’s migration were measured by Boyden transwell migration assay and Immunocytochemistry. Vehicle or BDNF (25 ng/ml) was present in the bottom chamber. Tuj1 (green) and Dapi (gray) (n = 3). Scale bars = 50 µM. (F) Quantification of the migrated neurons. Data presented as mean ± SEM; ***P < 0.001 (n = 3, Student’s t-test). (G) Western blot analysis of control, shRbms1, and shRbms1 with add-back vector-transfected N2A cells for 48 h.
Fig. 3
Fig. 3. Rbms1 regulates cortical progenitor differentiation in vivo.
(A) Immunostaining for GFP (green) and Pax6 (red) at the SVZ in E17.5 mouse cortices two days after electroporation with shcontrol and Rbms1 knockdown vector, respective GFP labeled cells marked with yellow lines. Scale bars = 50 µm (normal image), 20 µM (magnified image) (n = 3). (B) Quantify the percentage of GFP-labeled Pax6+ cells in the VZ and SVZ (VZ/SVZ). Data presented as mean ± SEM; **P < 0.005 (n = 3, Student’s t-test). (C) Immunostaining for GFP (green) and Tbr2 (red) at the SVZ in E17.5 mouse cortices two days after electroporation with shcontrol and Rbms1 knockdown vector, respective GFP labeled cells marked with yellow lines. Scale bars = 50 µM (normal image), 20 µM (magnified image) (n = 3). (D) Quantification of GFP-labeled Tbr2+ cells in the VZ and SVZ (VZ/SVZ). Data presented as mean ± SEM, *P < 0.05 (n = 3, Student’s t-test). (E) Immunostaining for GFP (green) and Satb2 (red) at the upper-layer of postnatal day 0 mouse cortices five days after electroporation of shcontrol and Rbms1 knockdown vector, respective GFP labeled cells marked with yellow lines. Scale bars = 100 µM (normal image), 50 µM (magnified image) (n = 3, Student’s t-test). (F) Quantification of GFP-labeled Satb2+ cells in the upper-layer cortex. Data presented as mean ± SEM; **P < 0.05 (n = 3, Student’s t-test).
Fig. 4
Fig. 4. Knockdown of Rbms1 decreased differentiation in vivo and in vitro, and delayed multipolar, bipolar transition.
(A) Immunostaining for GFP (green) and Tuj1 (red) in the upper and lower layer of the postnatal days 0 mouse cortices five days after electroporation with shcontol (control) or knockdown Rbms1 vector (shRbms1) GFP and Tuj1 positive cells marked with white dots. Scale bars = 100 µM (normal image), 20 µM (magnified image). (B) Quantification of the percentage of GFP-labeled Tuj1+ cells in the upper and lower level of the mouse cortices. Data presented mean ± SEM; ***P < 0.001 (n = 3, Student’s t-test). (C) Knockdown Rbms1 and corresponding control lenti particle were infected with primary neuron at DIV1 and measured the Tuj1 (red), GFP, and Tuj1 positive cells marked with white dots in control, and shRbms1 white dots represent Tuj1 negative and GFP positive cells, and Map2 (purple) positive neurons by immunocytochemistry at DIV3, map2 and GFP positive cells marked with white dots in control and shRbms1 white dots represent GFP positive and Map2 negative cells, yellow dots represent GFP positive cells both in control and shRbms1, ATRA was a positive control. Scale bars = 100 µM. (D) Quantification of the percentage of Tuj1+ and cells in the three different experiments. Data presented mean ± SEM, ***P < 0.001 (n = 3, Student’s t-test). (E) Immunostaining for GFP (green) and Dapi (blue) at the SVZ in E17.5 mouse cortices two days after electroporation with shcontrol and Rbms1 knockdown vector. Scale bars = 50 µM (n = 4). (F) Quantification of the percentage of GFP-labeled unipolar, bipolar, multipolar, and nonpolar cells in the SVZ and IZ. Data presented mean ± SEM; ***P < 0.001 (n = 3, Student’s t-test). (G) Trace of GFP positive cells was redrawn by Paint software (Microsoft, USA), representing shcontrol and shRbms1.
Fig. 5
Fig. 5. Knockdown of Rbms1 suppressed ATRA mediated differentiation in N2A cells and decreased primary neurite length in vitro.
(A) Two siRbms1 and respective si negative control transfected N2A cells were subjected to 5 µM of ATRA (lower panel) or without ATRA (upper panel) in low serum conditions. After 48 h, immunostained with Tuj1 (green) and Dapi (gray). Scale bars = 100 µM. (B) Magnification of Fig. 5A Tuj1 green and Dapi blue. Scale bars = 20 µM. (C) Quantify the percentage of differentiated cells from three different experiments; ***P < 0.001 (Student’s t-test). (D) In vivo transfected GFP labeled shRbms1 and shcontrol primary neurons were cultured until DIV4 and immunostained with anti-GFP. Scale bar = 50 µM. (E) Length of primary neurite measured by Image J Fiji. ***P < 0.001 (Student’s t-test). (F) No of primary dendrites, data presented as mean ± SEM; ***P < 0.001 (n = 15, Student’s t-test).
Fig. 6
Fig. 6. Rbms1 regulates migration through Efr3a.
(A) Schematic diagram of Efr3a selection from the RIP seq. (B) IUE of Efr3a and knockdown Rbms1 along with control vector and Efr3a and knockdown vector at E15.5 and harvested at P0 and immunostained with anti-GFP (green). The area from the outer layer of the CP to the inner layer of the VZ was divided into ten different bins. Scale bars = 100 µM (n = 3). (C) Quantification of the percentage of GFP positive cells in the ten different cortical segments (Bins) areas. Data presented as mean ± SEM; Student’s t-test; **P < 0.01 #P < 0.001 (n = 3). (D) Relative mRNA expression of Rbms1 and Efr3a from different stages of developing brain by qPCR. Data presented as mean ± SEM; Student’s t-test; *P < 0.05, ***P < 0.001 (n = 3). (E) siRbms1 and si negative control, and siRbms1 and Efr3a transfected TR cells migration were measured by Boyden transwell migration assay and Immunocytochemistry against Dapi after 24-h migration. Vehicle or 10% FBS was present (upper panel), and Vehicle or BDNF (25 ng/ml) was present (lower panel). Scale bars = 100 µm. (F) Quantification of Fig. 6E, left panel with FBS (10%) and right panel with BDNF (25 ng/ml). Data presented as mean ± SEM; Student’s t-test; ***P < 0.001 (n = 3). (G) In the upper panel, over-expressed Flag Rbms1 and respective control vectors were transfected in N2A cells and harvested after 48 h; the lysate was immunoprecipitated (IP) with anti-Flag and immunoblot by anti-flag antibody. In the down panel, overexpressed pCAGIG-Rbms1 vector and pCAGIG vector were transfected in N2A cells, and then lysates were immunoprecipitated with anti Rbms1 and IgG and immunoblot with anti Rbms1. (H) N2a cells were transfected with Rbms1 expression vector and 48 h after transfection perform RIP and checked the binding by qPCR (left panel), and N2a cells were transfected with Flag-tagged Rbms1 expression vector and 48 h after transfection perform RIP and checked the binding by qPCR (right panel), and klf4 kept as a negative control. Data presented as mean ± SEM; Student’s t-test; ***P < 0.001. (I) shRbms1 and overexpressed Rbms1 lentivirus particles and their corresponding control lentivirus particles were infected with primary neurons and measured the relative mRNA expression of Efr3a and other targets in the supplementary figure. Data presented as mean ± SEM; Student’s t-test; ***P < 0.001.
Fig. 7
Fig. 7. Rbms1 stabilizes Efr3a by binding with its 3' UTR.
(A) N2a cells were transfected with control, and knockdown Rbms1 vector 48 h after adding 5 µg/ml Actinomycin D and harvested after 0, 2, 4, and 8 h after and checked the stability of Efr3a mRNA by qPCR and (B) klf4 as a negative control. (C) The binding motif of Rbms1 was reported by Yu et al. (2020). (D) Schematic Diagram of 5 RNA oligoes in the UTR of Efr3a. (E) Binding competition of Rbms1 and different RNA oligoes from 3’ UTR of Efr3a and nonspecific RNA oligoes. Data presented as mean ± SEM; Student’s t-test, ***P < 0.001. (F) Biotinylated RNA oligoes specific to Efr3a were used to pulldown Rbms1 protein by RNA pulldown assay in brain lysate and checked the pull-down by immunoblot anti Rbms1. Nonspecific oligo and beads not coated with any oligoes served as negative controls in the capture.

References

    1. Baird D., Stefan C., Audhya A., Weys S., Emr S.D. Assembly of the PtdIns 4-kinase Stt4 complex at the plasma membrane requires Ypp1 and Efr3. J. Cell Biol. 2008;183:1061–1074. doi: 10.1083/jcb.200804003. - DOI - PMC - PubMed
    1. Bandziulis R.J., Swanson M.S., Dreyfuss G. RNA-binding proteins as developmental regulators. Genes Dev. 1989;3:431–437. doi: 10.1101/gad.3.4.431. - DOI - PubMed
    1. Bishayee K., Habib K., Nazim U.M., Kang J., Szabo A., Huh S.O., Sadra A. RNA binding protein HuD promotes autophagy and tumor stress survival by suppressing mTORC1 activity and augmenting ARL6IP1 levels. J. Exp. Clin. Cancer Res. 2022;41:18. doi: 10.1186/s13046-021-02203-2. - DOI - PMC - PubMed
    1. Bojjireddy N., Guzman-Hernandez M.L., Reinhard N.R., Jovic M., Balla T. EFR3s are palmitoylated plasma membrane proteins that control responsiveness to G-protein-coupled receptors. J. Cell Sci. 2015;128:118–128. doi: 10.1242/jcs.157495. - DOI - PMC - PubMed
    1. Bryant C.D., Yazdani N. RNA-binding proteins, neural development and the addictions. Genes Brain Behav. 2016;15:169–186. doi: 10.1111/gbb.12273. - DOI - PMC - PubMed