Review
. 2020 Jul 9:7:2-14.
doi: 10.1016/j.iotech.2020.07.001. eCollection 2020 Sep.

Nanobodies as non-invasive imaging tools

Affiliations
Review

Nanobodies as non-invasive imaging tools

M Rashidian et al. Immunooncol Technol. .

Abstract

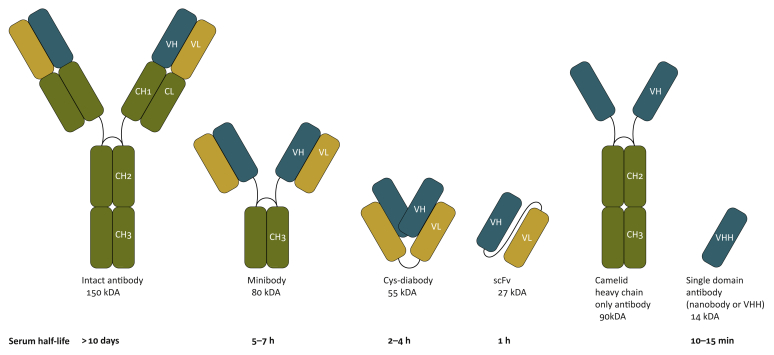
Antibodies and antibody fragments have found wide application for therapeutic and diagnostic purposes. Single-domain antibody fragments, also known as 'heavy-chain variable domains' or 'nanobodies', are a recent addition to the toolbox. Discovered some 30 years ago, nanobodies are the smallest antibody-derived fragments that retain antigen-binding properties. Their small size, stability, specificity, affinity and ease of manufacture make them appealing for use as imaging agents in the laboratory and the clinic. With the recent surge in immunotherapeutics and the success of cancer immunotherapy, it is important to be able to image immune responses and cancer biomarkers non-invasively to allocate resources and guide the best possible treatment of patients with cancer. This article reviews recent advances in the application of nanobodies as cancer imaging agents. While much work has been done in preclinical models, first-in-human applications are beginning to show the value of nanobodies as imaging agents.

Keywords: ImmunoPET; PET imaging; cancer biomarkers; immunotherapy; nanobody; non-invasive imaging.


Figures

Figure 1
Figure 1
Representation of antibody and antibody fragments commonly used in positron emission tomography or single-photon emission computed tomography. VHH, heavy-chain variable domain.
Figure 2
Figure 2
Generation of camelid single-domain antibodies [nanobodies or heavy-chain variable domain (VHH)]. Peripheral blood lymphocytes (PBLs) are collected following two or three rounds of immunizations. Purified PBLs are used to generate VHH phage-display libraries. Target specific nanobodies are then selected from the generated library after two or three rounds of panning. Nanobodies, expressed with appropriate tags (e.g. a sortase tag and/or a His-6 tag), are then ready for the installation of radiometal chelators or click handles.
Figure 3
Figure 3
(A) Direct radiolabeling of His-tagged (H6) nanobodies with 99mTc-tricarbonyl. (B) Site-specific labeling of nanobodies using sortase. A nanobody equipped with an LPXTG tag can be labeled with a triglycine-containing sortase substrate. X can be a number of amino acids, such as E. A His-tag (H6) can be used to purify the protein. R can be any biomolecule of interest. Sortase reaction yields near-complete formation of product.,
Figure 4
Figure 4
(A,B) Positron emission tomography/computed tomography (PET/CT) images of 68Ga-labeled anti-HER2 nanobody in patients with breast cancer showing uptake in tumor lesions. Images were obtained 90 min post injection. (A) A patient with invaded lymph nodes in the mediastinum and left hilar region. (B) A patient with bone metastasis in the pelvis. Data adapted from Keyaerts et al. (2016). (C) 99mTc-labeled anti-human PD-L1 nanobody can visualize human PD-L1+ melanoma tumors engrafted in athymic nude mice; however, no signal was observed in PD-L1 tumors. Lack of signal in the tumors when an irrelevant control nanobody was used further confirmed the specificity of the observed signal. Single-photon emission computed tomography/CT images were obtained 1 h post injection. Data adapted from Broos et al. (2019). (D,E) Complete Freund’s adjuvant was injected into the left paw. Twenty-four hours later, mice were imaged with 18F-labeled anti-mouse CD11b nanobody, which detected an influx of CD11b+ cells into the site of inflammation. Lymphoid organs were also detected (∼1–3% of lymphoid cells in secondary lymphoid organs are CD11b+). (E) 18F-2-fluoro-2-deoxyglucose (18F-FDG) failed to detect the influx of CD11b+ cells in the same model. PET/CT images were acquired 2 h post injection of the radiolabeled heavy-chain variable domain or 18F-FDG.
Figure 5
Figure 5
PEGylation increases sensitivity and decreases kidney retention of radiolabeled heavy-chain variable domains (VHHs). Mice were injected with 89Zr-labeled anti-mouse CD8 nanobody (A), with or without a 20-kDa PEG molecule (B,C). Mice were imaged 2 h post injection (for the ‘no PEG’ VHH) or 24 h post injection (for the PEGylated VHH), which are the optimum timepoints for maximum signal-to-background ratio. RAG knockout animals, which lack all lymphocytes, did not yield an obvious signal, except in the organs of elimination (kidney, bladder) (D). To measure sensitivity of the approach, lymph nodes (LNs) were excised and CD8+ cells were counted. Results showed that a popliteal LN, with ∼70 000 CD8+ T cells, can be detected with a signal-to-background ratio of ∼7.
Figure 6
Figure 6
Monitoring the dynamics of a CD8+ T-cell response to immunotherapy. (A) C57BL/6 mice were inoculated with B16 melanoma and GVAX simultaneously. Mice received anti-CTLA4 treatment (clone 9H10) in a setting that resulted in a partial response. Mice were subjected to positron emission tomography/computed tomography on days 9, 16, 23 and 30. (B) Survival graph of two mice for which PET/CT images are shown in C and D. (C,D) Images show the distribution of CD8+ cells in the tumors over the course of the 4 weeks of the experiment on the indicated days. Mouse ‘C’ was a strong responder with homogeneous infiltration of CD8+ cells throughout the course of imaging. Mouse ‘D’ was a partial responder. PET/CT images showed heterogeneous infiltration of CD8+ cells in the tumor prior to day 23. Images are an enlarged view of two- and three-dimensional representation of a cross-section of the tumors, showing the intratumoral distribution of the PET signal. Tumors, as identified by CT, are delineated by the white outline. Where relevant, areas with lower PET signals are indicated by arrows. The images are representative of multiple experiments with similar results (N = 20, P = 0.035).

References

    1. Topalian S.L., Hodi F.S., Brahmer J.R., et al. Safety, activity, and immune correlates of anti–PD-1 antibody in cancer. N Engl J Med. 2012;366:2443–2454. - PMC - PubMed
    1. Leach D.R., Krummel M.F., Allison J.P. Enhancement of antitumor immunity by CTLA-4 blockade. Science. 1996;271:1734–1736. - PubMed
    1. Couzin-Frankel J. Breakthrough of the year 2013. Cancer immunotherapy. Science. 2013;342:1432–1433. - PubMed
    1. Beer L., Hochmair M., Prosch H. Pitfalls in the radiological response assessment of immunotherapy. Memo. 2018;11:138–143. - PMC - PubMed
    1. Bensch F., van der Veen E.L., Hooge M.N.L., et al. 89Zr-atezolizumab imaging as a non-invasive approach to assess clinical response to PD-L1 blockade in cancer. Nat Med. 2018;24:1852–1858. - PubMed

LinkOut - more resources