. 2022 Jun 7;25(7):104547.
doi: 10.1016/j.isci.2022.104547. eCollection 2022 Jul 15.

Coagulation factors promote brown adipose tissue dysfunction and abnormal systemic metabolism in obesity

Affiliations

Coagulation factors promote brown adipose tissue dysfunction and abnormal systemic metabolism in obesity

Yuka Hayashi et al. iScience. .

Abstract

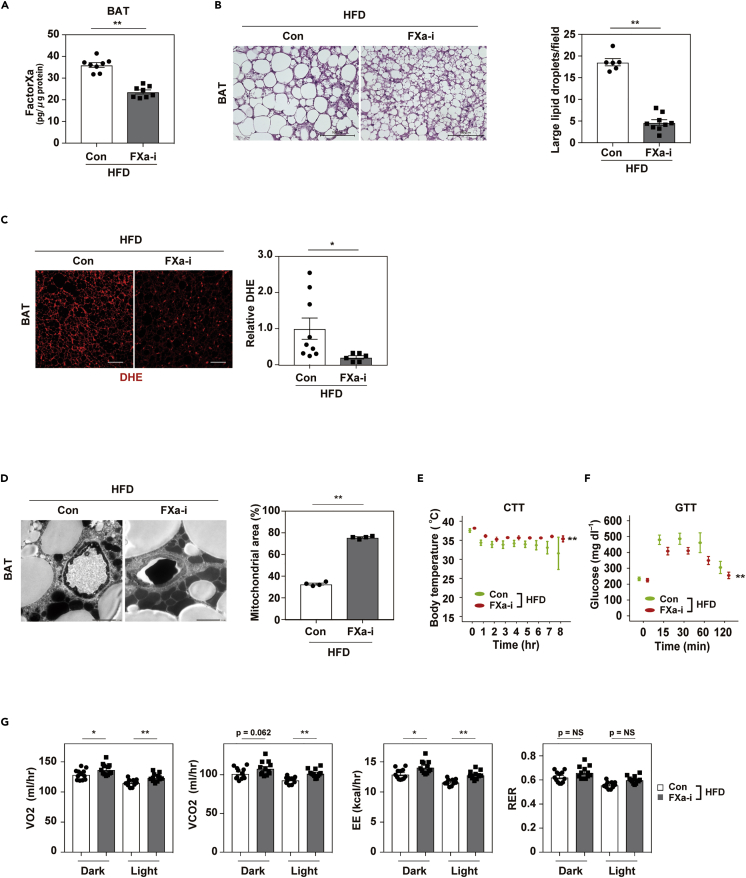
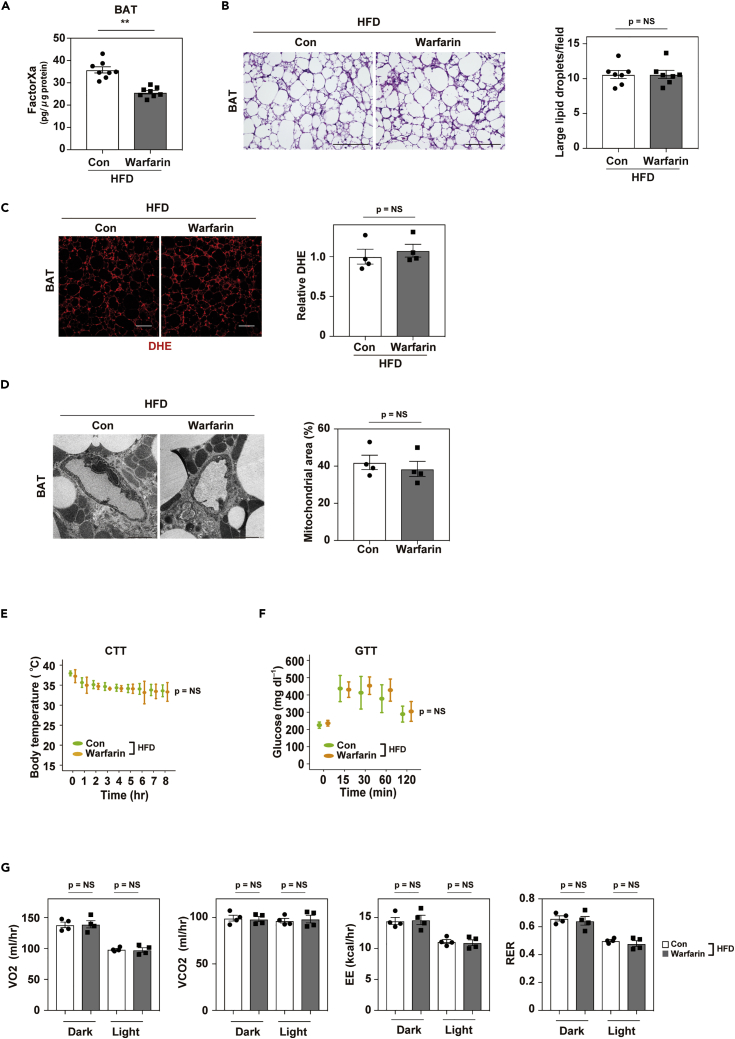
Brown adipose tissue (BAT) has a role in maintaining systemic metabolic health in rodents and humans. Here, we show that metabolic stress induces BAT to produce coagulation factors, which then-together with molecules derived from the circulation-promote BAT dysfunction and systemic glucose intolerance. When mice were fed a high-fat diet (HFD), the levels of tissue factor, coagulation Factor VII (FVII), activated coagulation Factor X (FXa), and protease-activated receptor 1 (PAR1) expression increased significantly in BAT. Genetic or pharmacological suppression of coagulation factor-PAR1 signaling in BAT ameliorated its whitening and improved thermogenic response and systemic glucose intolerance in mice with dietary obesity. Conversely, the activation of coagulation factor-PAR1 signaling in BAT caused mitochondrial dysfunction in brown adipocytes and systemic glucose intolerance in mice fed normal chow. These results indicate that BAT produces endogenous coagulation factors that mediate pleiotropic effects via PAR1 signaling under metabolic stress.

Keywords: Biological sciences; Cell biology; Human Physiology; Human metabolism.


Conflict of interest statement

The authors except for T.M. disclose no conflicts of interest. T.M. discloses the joint research funds and the remuneration for a lecture from Bayer; however, this company did not play a role in the study design, data collection and analysis, decision to publish, or preparation of the article.

Figures

None
Graphical abstract
Figure 1
Figure 1
Coagulation factors and protease-activated receptors are upregulated in brown adipose tissue under metabolic stress (A) Hematoxylin and eosin (HE) staining of brown adipose tissue (BAT) from wild-type mice fed a normal chow (NC) or a high-fat diet (HFD). In the HFD group, mice were fed the diet from 4 weeks of age and were analyzed at 19 to 22 weeks of age. Scale bar = 100 μm. (B and C) Enzyme-linked immunosorbent assay (ELISA; B, n = 10, 10) or immunofluorescent staining (C) for tissue factor in BAT of the indicated mice aged 19-22weeks. Scale bar = 50 μm. (D-H) Results of quantitative polymerase chain reaction (PCR) for coagulation factor VII (F7; D, n = 8, 7) or coagulation factor X (F10; G, n = 8, 7) in mice aged 19-22weeks. Results of enzyme-linked immunosorbent assay (ELISA; E, H) or immunofluorescent staining (F) for coagulation factor VII (E and F, n = 10, 11) or activated coagulation factor X (Factor Xa; H, n = 9, 9) in BAT of the indicated mice aged 19-22weeks. Scale bar = 50 μm. (I) Western blot analysis of protease-activated receptor-1 (PAR-1) or PAR-2 expression in epididymal white adipose tissue (eWAT) or BAT from the indicated groups. Right panel indicates the quantification of protease-activated receptor-1 (PAR-1) relative to glyceraldehyde 3-phosphate dehydrogenase (GAPDH) in BAT (n = 5, 5). (J) Immunofluorescent staining for PAR-1 in BAT from the indicated group. Scale bar = 50 μm. (K) RNA sequence data analyzing F2R in brown adipose tissue (BAT) from individuals with a body mass index (BMI) < 25 (n = 8) or BMI ≥25 (n = 23). Datasets were taken from Jespersen et al. (https://www.biorxiv.org/content/10.1101/2020.05.07.082057v1). (L) Enzyme-linked immunosorbent assay (ELISA) for Factor Xa in plasma from NC or HFD mice aged 19-22weeks (left panel; n = 3, 3), and plasma from lean (BMI <22) or obese (BMI >28) human volunteers (right panel; n = 13, 13). All data were analyzed by a 2-tailed Student’s t test. ∗p < 0.05, ∗∗p < 0.01. Values represent the mean ± SEM NS = not significant. All data are from different biological replicates. See also Figure S1.
Figure 2
Figure 2
Inhibition of FactorXa prevents whitening and dysfunction of brown adipose tissue Mice were fed a high-fat diet (HFD) from 4 weeks of age with or without the administration of an FXa inhibitor (FXa-i). Physiological studies were performed at age 13 to 19 weeks for FXa-i treatment, and samples were collected at age 18 to 22 weeks. (A) Enzyme-linked immunosorbent assay study of Factor Xa in brown adipose tissue (BAT) from mice aged 19-22 weeks fed a high-fat diet (HFD; Con HFD) or HFD + FXa inhibitor (FXa-i HFD; n = 8, 8). (B) Hematoxylin and eosin (HE) staining of BAT from the indicated mice. Scale bar = 100 μm. Right panel indicates the quantification of large lipid droplets in the indicated mice (n = 6, 9). Large lipid droplets were defined as droplets with a surface area >1000 μm2. (C) Staining with dihydroethidium (DHE) in brown adipose tissue (BAT) from mice fed the HFD (Con HFD) or HFD + FXa-i (FXa-i HFD). Scale bar = 50 μm. Right panels indicate quantification shown as relative dihydroethidium (DHE) level (DHE area of FXa-i HFD/Con HFD, n = 9, 6). (D) Findings on transmission electron microscopy in the indicated mice (scale bar = 2 μm). Right panels indicate mitochondrial area (%; analyzed as mitochondrial area/[non-capillary and non-lipid area]) in the pericapillary area of respective groups (n = 4, 4). (E and F) Cold tolerance test (CTT; E, n = 7, 7) or glucose tolerance test (GTT; F, n = 14, 17) in the indicated mice aged 13 weeks for CTT, and 12 weeks for GTT. (G) Oxygen consumption (VO2), CO2 production (VCO2), energy expenditure (EE), and respiratory exchange ratio (RER) in the indicated groups aged 14-16 weeks (n = 12, 12, 12, 12). Data were analyzed by a 2-tailed Student’s t test (A, B, C, D, G) or 2-way repeated measures ANOVA (E, F). ∗p < 0.05, ∗∗p < 0.01. Values represent the mean ± SEM NS = not significant. All data are from different biological replicates. See also Figure S2.
Figure 3
Figure 3
Warfarin does not ameliorate brown adipose tissue dysfunction on dietary obesity Mice were fed a high-fat diet (HFD) from 4 weeks of age with or without the administration of warfarin. Physiological studies were performed at age 12 to 17 weeks for warfarin treatment, and samples were collected at age 17 weeks. (A) Enzyme-linked immunosorbent assay study analyzing Factor Xa in brown adipose tissue (BAT) from mice aged 17weeks fed a high-fat diet (HFD; Con HFD) or HFD + Warfarin (Warfarin HFD; n = 8, 8). (B) Hematoxylin and eosin (HE) staining of BAT from the indicated mice. Scale bar = 100 μm. Right panel indicates the number of large lipid droplets per field in BAT from the indicated mice. Large lipid droplets were defined as droplets with a surface area >1000 μm2 (n = 7, 7). (C) Staining with dihydroethidium (DHE) in brown adipose tissue (BAT) from mice fed the HFD (Con HFD) or HFD + warfarin (Warfarin HFD). Scale bar = 50 μm. Right panels indicate quantification shown as relative dihydroethidium (DHE) level (DHE area of Warfarin HFD/Con HFD; n = 4, 4). (D) Findings on transmission electron microscopy in the indicated mice (scale bar = 2 μm). Right panel indicate the mitochondrial area (%; analyzed as mitochondrial area/[non-capillary and non-lipid area]) in the pericapillary area of respective groups (n = 4, 4). (E and F) Cold tolerance test (CTT; E, n = 7, 7) or glucose tolerance test (GTT; F, n = 7, 6) in the indicated mice aged 13 weeks for CTT, and 12 weeks for GTT. (G) Oxygen consumption (VO2), CO2 production (VCO2), energy expenditure (EE), and respiratory exchange ratio (RER) in the indicated groups aged 14-16 weeks (n = 4, 4, 4, 4). Data were analyzed by a 2-tailed Student’s t test (A, B, C, D, G) or 2-way repeated measures ANOVA (E, F). ∗p < 0.05, ∗∗p < 0.01. Values represent the mean ± SEM NS = not significant. All data are from different biological replicates. See also Figure S3.
Figure 4
Figure 4
Brown adipose tissue-specific protease-activated receptor-1 depletion ameliorates brown adipose tissue dysfunction Brown adipose tissue (BAT)-specific protease-activated receptor-1 (PAR1) knockout (KO) mice (UCP1-Cre+/−; PAR1flox/flox; BAT PAR1 KO) were fed a high-fat diet (HFD) from 4 weeks of age and physiological studies were performed after 12 to 13 weeks. Tissues were harvested at 18-21 weeks of age. (A, B, and C) Hematoxylin and eosin (HE) staining (A; scale bar = 100 μm), dihydroethidium (DHE) staining (B; scale bar = 50 μm), and transmission electron microscopy (C; scale bar = 2 μm) of BAT from littermate control mice (PAR1flox/flox; Con), BAT PAR1 KO, and BAT PAR1 KO mice treated with an FXa inhibitor (BAT PAR1 KO + FXa-i). Right panels in Figure 4A indicate the quantification of large lipid droplets (n = 4, 3, 4), and Figure 4B indicates the quantification of dihydroethidium (DHE) staining (n = 5, 5, 5) of BAT in littermate control mice (PAR1flox/flox; Con), BAT PAR1 KO, and BAT PAR1 KO + FXa-i mice. Right panel in Figure 4C indicates mitochondria area in % (analyzed as mitochondrial area/[non-capillary and non-lipid area]) in the pericapillary area of the respective groups (n = 4, 4, 4). (D, E) Cold tolerance test (CTT; D, n = 16, 8, 5) and glucose tolerance test (GTT; E, n = 14, 11, 11) in the indicated mice aged 13 weeks for CTT, and 12 weeks for GTT. ∗ indicates Con vs. BAT PAR1 KO, ## indicates Con vs. BAT PAR1 KO + FXa-i. Data were analyzed by 2-way ANOVA followed by Tukey’s multiple comparison test (A, B, C) or by 2-way repeated-measures ANOVA followed by Tukey’s multiple comparison test (D, E). ∗p < 0.05, ∗∗p < 0.01, ##p < 0.01. Values represent the mean ± SEM NS = not significant. All data are from different biological replicates. See also Figure S4.
Figure 5
Figure 5
Introduction of tissue factor and PAR-1 in brown adipose tissue promotes functional decline of this organ All experiments with Adeno-associated virus (AAV) were performed in mice fed normal chow (NC). AAVs were injected at 10 weeks of age. Physiological studies were performed 10 to 14 days after AAV injection, and tissues were harvested at 14 weeks of age. (A-C) Enzyme-linked immunosorbent assay (ELISA) for tissue factor (A, n = 10, 9) or FactorXa (C, n = 8, 8) in BAT from mice injected with control AAV (Mock) or with both AAV encoding F3 and AAV encoding F2r (AAV F3+F2r) aged 14 weeks. (B) Western blot analysis of PAR-1 in BAT from the indicated groups. Right panel indicates the quantification of PAR1 relative to glyceraldehyde 3-phosphate dehydrogenase (GAPDH; n = 9,9). (D, E, and F) Hematoxylin and eosin (HE) staining (D; scale bar = 100μm), dihydroethidium (DHE) staining (E; scale bar = 50 μm), and transmission electron microscopy (F; scale bar = 10 μm for low magnification [Low Mag] and 2 μm for high magnification [High Mag]) of BAT from the indicated mice. Right panel in Figure 5E indicates the quantification of dihydroethidium (DHE) analyzed as relative DHE signal (DHE area of AAV F3+F2r/Mock) of indicated mice (n = 4, 5). Right panel in Figure 5F indicates mitochondria area (%; analyzed as mitochondrial area/[non-capillary and non-lipid area]) in the pericapillary area of the respective groups (n = 4, 4). (G and H) Cold tolerance test (CTT; G, n = 8, 8) and glucose tolerance test (GTT; H, n = 6, 7) in the indicated mice aged 13 weeks for CTT, and 12 weeks for GTT. Data were analyzed by a 2-tailed Student’s t test (A, B, C, E, F) or by 2-way repeated measures ANOVA (G and H). ∗p < 0.05, ∗∗p < 0.01. Values represent the mean ± SEM NS = not significant. All data are from different biological replicates. See also Figure S5.
Figure 6
Figure 6
FactorXa/PAR1 signaling promotes the dysfunction of brown adipocytes (A-H) Nivo Multimode Microplate Reader study analyzing signal of mitochondrial ROS (MitoSox; A, n = 5, 5, 5; C, n = 8, 8, 8; G, n = 8, 8, 8), mitochondrial membrane potential (MitoRed; B, n = 8, 8, 8; D, n = 20, 20, 20; H, n = 8, 8, 8), mitochondrial calcium (Ca2+; Rhod2; E, n = 8, 8, 8; F, n = 8, 8, 8) in the indicated groups. For studies of MitoSox and MitoRed, recombinant FXa protein (10nM) was administered for a total of 3 h and other compounds were administered for 1 h before the administration of FXa at the following concentrations: PAR1 inhibitor (PAR1-i), 1μM; MitoTEMPO, 10μM; MCU inhibitor (250nM). For studies of Rhod2, recombinant FXa was administered for a total of 30 min, with or without the reagents described above. (I) Results of qPCR for expression of coagulation factor VII (F7; n = 5, 6), factor X (F10; n = 6, 6), tissue factor (F3; n = 4, 5), and F2r (PAR-1 transcript; n = 6, 6) in differentiated brown adipocytes incubated with control adenovirus (Mock) or adenovirus encoding constitutively activated Hif-1a (Ad-Hif-1a; 10 MOI, 48 h for F7, F10, and F2r; 30 MOI, 24 h for F3). (J) Enzyme-linked immunosorbent assay (ELISA) for tissue factor (n = 10, 10), coagulation factor VII (FVII; n = 9, 14), and FXa (n = 11, 9) in conditioned medium from differentiated brown adipocytes incubated with control adenovirus (Mock) or Ad-Hif-1a. (K and L) MitoSox/MitoGreen ratio (K, n = 8, 7, 7) and MitoRed/MitoGreen ratio (L, n = 8, 8, 8) in differentiated brown adipocytes incubated with conditioned medium (CM) obtained from brown adipocytes infected with Mock (Mock-CM), Ad-Hif-1a (Ad-Hif-1a-CM), or Ad-Hif-1a-CM + PAR1-i. Data were analyzed by a 2-tailed Student’s t test (I-L), or by 2-way ANOVA followed by Tukey’s multiple comparison test (A and C-H), or non-parametric Kruskal Wallis test (B). ∗p < 0.05, ∗∗p < 0.01. Values represent the mean ± SEM NS = not significant. All data are from different biological replicates. See also Figure S6.

References

    1. Arruda A.P., Pers B.M., Parlakgul G., Guney E., Inouye K., Hotamisligil G.S. Chronic enrichment of hepatic endoplasmic reticulum-mitochondria contact leads to mitochondrial dysfunction in obesity. Nat. Med. 2014;20:1427–1435. doi: 10.1038/nm.3735. - DOI - PMC - PubMed
    1. Badeanlou L., Furlan-Freguia C., Yang G., Ruf W., Samad F. Tissue factor-protease-activated receptor 2 signaling promotes diet-induced obesity and adipose inflammation. Nat. Med. 2011;17:1490–1497. doi: 10.1038/nm.2461. - DOI - PMC - PubMed
    1. Bartelt A., Bruns O.T., Reimer R., Hohenberg H., Ittrich H., Peldschus K., Kaul M.G., Tromsdorf U.I., Weller H., Waurisch C., et al. Brown adipose tissue activity controls triglyceride clearance. Nat. Med. 2011;17:200–205. doi: 10.1038/nm.2297. - DOI - PubMed
    1. Borissoff J.I., Heeneman S., Kilinc E., Kassak P., Van Oerle R., Winckers K., Govers-Riemslag J.W., Hamulyak K., Hackeng T.M., Daemen M.J., et al. Early atherosclerosis exhibits an enhanced procoagulant state. Circulation. 2010;122:821–830. doi: 10.1161/circulationaha.109.907121. - DOI - PubMed
    1. Brookes P.S., Yoon Y., Robotham J.L., Anders M.W., Sheu S.S. Calcium, ATP, and ROS: a mitochondrial love-hate triangle. Am. J. Physiol. Cell Physiol. 2004;287:C817–C833. doi: 10.1152/ajpcell.00139.2004. - DOI - PubMed

LinkOut - more resources