. 2022 Jun 3;25(7):104518.
doi: 10.1016/j.isci.2022.104518. eCollection 2022 Jul 15.

Sensitization of FOLFOX-resistant colorectal cancer cells via the modulation of a novel pathway involving protein phosphatase 2A

Affiliations

Sensitization of FOLFOX-resistant colorectal cancer cells via the modulation of a novel pathway involving protein phosphatase 2A

Satya Narayan et al. iScience. .

Abstract

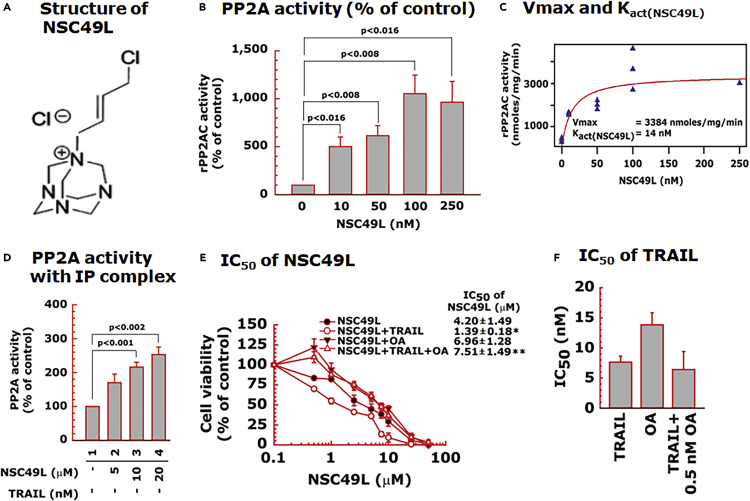
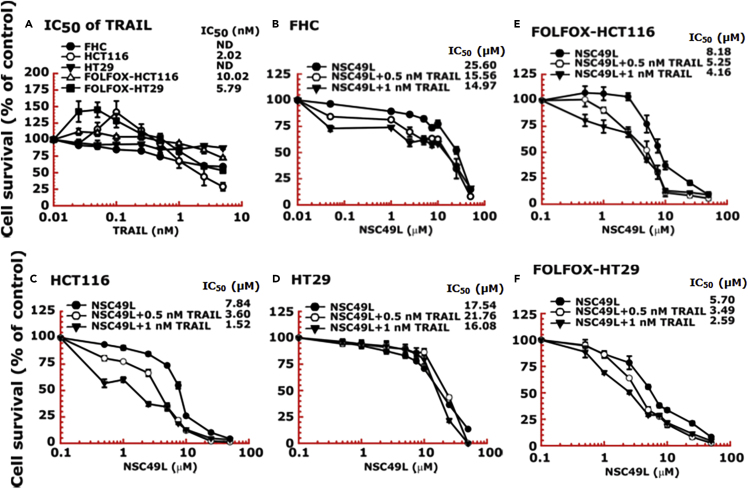
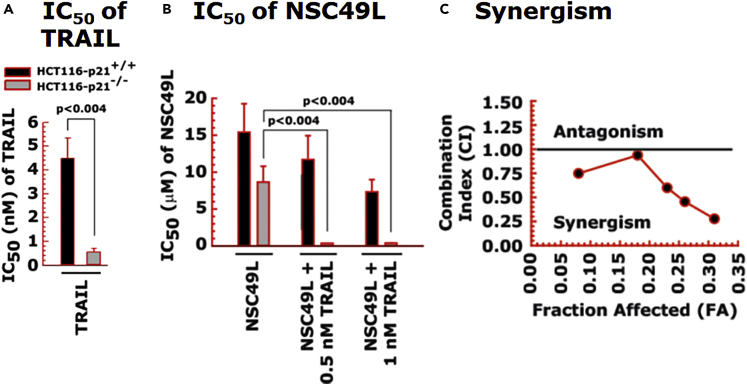
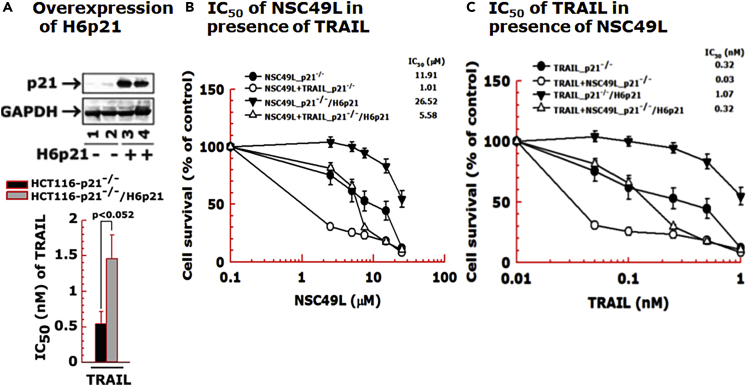
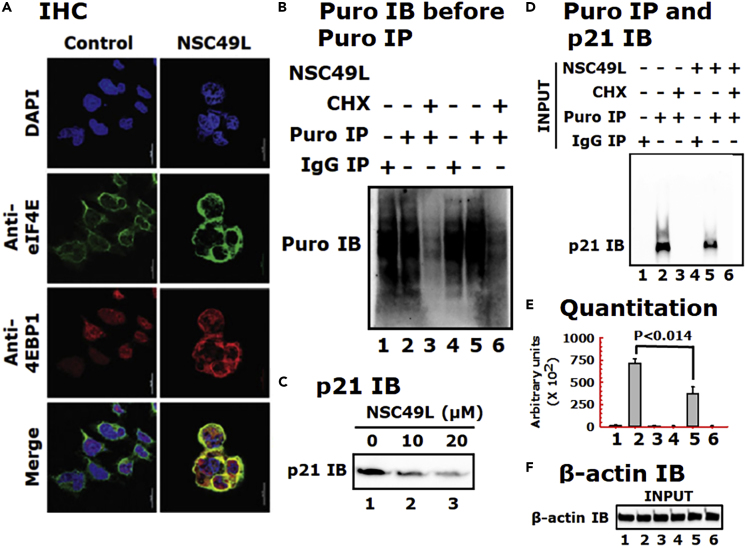
The treatment of colorectal cancer (CRC) with FOLFOX shows some efficacy, but these tumors quickly develop resistance to this treatment. We have observed increased phosphorylation of AKT1/mTOR/4EBP1 and levels of p21 in FOLFOX-resistant CRC cells. We have identified a small molecule, NSC49L, that stimulates protein phosphatase 2A (PP2A) activity, downregulates the AKT1/mTOR/4EBP1-axis, and inhibits p21 translation. We have provided evidence that NSC49L- and TRAIL-mediated sensitization is synergistically induced in p21-knockdown CRC cells, which is reversed in p21-overexpressing cells. p21 binds with procaspase 3 and prevents the activation of caspase 3. We have shown that TRAIL induces apoptosis through the activation of caspase 3 by NSC49L-mediated downregulation of p21 translation, and thereby cleavage of procaspase 3 into caspase 3. NSC49L does not affect global protein synthesis. These studies provide a mechanistic understanding of NSC49L as a PP2A agonist, and how its combination with TRAIL sensitizes FOLFOX-resistant CRC cells.

Keywords: Cancer; Cell biology; Functional aspects of cell biology.


Conflict of interest statement

The authors declare no competing interests.

Figures

None
Graphical abstract
Figure 1
Figure 1
PP2AC expression level is directly correlated with disease progression and the survival of patients with CRC (A) Box plot depicting a summary of the TCGA data quantification of PPP2CB in normal tissue and CRC tumors (left), different stages (middle), and different nodal progressions (right). (B) Box plot showing the CPTAC data quantitation of PP2AC protein levels in normal tissues and CRC tumors (left), and different stages of progression (right). (C) Kaplan-Meier survival analysis of TCGA data was plotted for the CRC cases that were high and low in PPP2CB expression. The p-value is shown at the top of each graph. See also Figure S1.
Figure 2
Figure 2
PPP2CA/B expression is lower in FOLFOX-non-responsive (NR) versus responsive (R) CRC tumors, which negatively correlated with the expression of AKT1, mTOR, 4EBP1, and CDKN1A Data were analyzed from the NCBI GEO accession number GSE72970. Number of samples in the NR and R groups was 61 and 63, respectively. The p value is shown at the top of each graph.
Figure 3
Figure 3
NSC49L-mediated activation of PP2AC (A) chemical structure of NSC49L. (B) human rPP2AC activity determined with the malachite green assay. (C) Kact(NSC49L) and Vmax values of NSC49L with PP2AC. (D) PP2A activity using immune complexes isolated with anti-PP2AC antibody from control and NSC49L-treated FOLFOX-HT29 cells. Data are the mean ± SE of three experiments. (E) Okadaic acid (OA), a PP2A inhibitor, blocks NSC49L and TRAIL-induced cytotoxicity to FOLFOX-HT29 cells. Cells were treated with different concentrations of NSC49L, TRAIL and OKA either alone are in combination as indicated in the figure. After 72 h treatment, cell viability was determined using the MTT-assay. ∗ = Significantly different as compared to NSC49L group, and ∗∗ = significantly different as compared to NSC49L+TRAIL group. (F) effect of OA on the IC50 of the TRAIL. Data are the mean ± SE of four estimations. The p < 0.05 is considered significant.
Figure 4
Figure 4
FOLFOX-HT29 and FOLFOX-HCT116 cell lines are much more sensitive than normal colonic epithelial cell lines (FHC) to NSC49L and TRAIL treatment Cells were grown in 96-well plates and treated for 72 h with different concentrations of NSC49L and TRAIL either alone or in combination. Survival of cells was determined by the MTT-assay. (A) IC50 of TRAIL. (B–F) IC50 of NSC49L either alone or in the presence of TRAIL in different CRC cell lines. Data are the mean ± SE of four estimations.
Figure 5
Figure 5
RNASeq and protein analysis of PP2A and downstream target proteins in CRC cells (A and B) RNASeq analysis of FOLFOX-HT29 cells. Cells were treated with 20 μM of NSC49L and 1 nM of TRAIL either alone or in combination for 16 h. Total RNA was isolated by TRIzol reagent and processed for RNASeq analysis. Ward clustering algorithm with Euclidean distance measurement was used for heat map analysis. (C) Correlation of PP2A expression level with AKT1(S473P) and p21 levels in CRC cell lines. To determine a correlation of PP2A with AKT1(S473P) and p21, we performed Western bots of these proteins using the whole-cell lysate of different CRC cell lines, including FOLFOX-resistant HCT116 and HT29 cells. (D and E) Protein levels of AKT1, p53, p21, DR5, caspase 3, caspase 8, and PARP1 in HCT116, FOLFOX-CHT116, HT29, and FOLFOX-HT29 cell lines, respectively, treated with NSC49L and TRAIL either alone or in combination for 24 h. The blots are representative of three experiments. See also Figures S2 and S3.
Figure 6
Figure 6
Overexpression of DR5 induces the sensitization of HT29 cells to NSC49L and TRAIL One set of the HT29-tet-DR5 cells was treated with DOX (1 μg/mL) to induce the expression of DR5. Then, control and DR5-induced cells were treated with different concentrations of NSC49L and TRAIL either alone or in combination for 72 h. The cell survival was determined by the MTT-assay. (A) Doxycycline-induced DR5 expression was verified by immunoblot. (B) IC50 of TRAIL. (C) IC50 of NSC49L in the presence of 0, 0.5, and 1 nM of TRAIL, respectively. Data are the mean ± SE of four different estimations. The p-value is shown on the top of each graph.
Figure 7
Figure 7
Western blot analysis of AKT/mTOR/4EBP1, apoptotic pathway proteins, and apoptosis of FOLFOX-HT29 cells treated with NSC49L and TRAIL either alone or in combination for 24 h (A and B) Western blots demonstrating the regulation of the AKT/mTOR/4EBP1 pathway by NSC49L and TRAIL in FOLFOX-HT29 cells. (C) Levels of apoptotic proteins. All of the blots are the representative of three experiments. (D) Caspase 3/7 activity. FOLFOX-HT29 cells were treated with NSC49L and TRAIL either alone or in combination for 24 h, and the extent of apoptosis was determined by measuring the activation of caspase 3/7 using a flow cytometer. The experiment was repeated twice. Data are the mean ± SE of triplicate results. See also Figure S4.
Figure 8
Figure 8
Synergistic sensitization of p21-knockout cells in response to NSC49L and TRAIL treatment HCT116-p21+/+ and HCT116-p21−/− cells were treated with different concentrations of NSC49L and TRAIL either alone or in combination for 72 h and the cell survival was determined by the MTT-assay. (A and B) The IC50 of TRAIL and NSC49L cells, respectively. The IC50 is derived from the survival curves. (C) The synergistic effect of NSC49L and TRAIL with HCT116-p21−/− cells. Data are the mean ± SE of four estimations. The p-value is shown on the top of each graph.
Figure 9
Figure 9
Overexpression of H6p21 decreases the sensitization of p21-knockout cells in response to NSC49L and TRAIL treatment The HCT116-p21−/− and HCT116-p21−/−/H6p21 cells were treated with different concentrations of NSC49L and TRAIL either alone or in combination for 72 h and the cell viability was determined by the MTT-assay. (A) Western blot showing the overexpression of H6p21. (B) The IC50 of NSC49L in combination with TRAIL. (C) IC50 of TRAIL in combination with NSC49L. Different concentrations of NSC49L (0, 2.5, 5, 7.5, 15 and 25 μM) and TRAIL (0, 0.05, 0.1, 0.25, 0.5, and 1.0 nM) were used in the synergy experiments. Data are the mean ± SE of four estimations. The p-value is shown on the top of graph A.
Figure 10
Figure 10
Effect of NSC49L and TRAIL treatments on the TP53 and CDKN1A mRNA levels and protein kinetics in HT29 and FOLFOX-HT29 cells (A) Cells were treated with NSC49L (20 μM) and TRAIL (1 nM) either alone or in combination for 16 h. Total RNA was isolated and used for qRT-PCR. Data are the mean ± SE of four estimations. (B) Kinetics of p21 protein stability after CHX treatment. Cells were treated with NSC49L (20 μM) and TRAIL (1 nM) either alone or in combination for 24 h followed by the treatment with CHX (10 μg/mL) for different periods. The p21 protein level was determined by Western blot analysis. Blots shown are the representative of two experiments. See also Figure S5.
Figure 11
Figure 11
NSC49L treatment increases the colocalization of eIF4E with unphosphorylated 4EBP1 and inhibits p21 protein synthesis in FOLFOX-HT29 cells (A) IHC analysis. FOLFOX-HT29 cells were treated with 20 μM of NSC49L for 24 h. After treatment, the colocalization of eIF4E and 4EBP1 was determined by IHC. Yellow color in the merge column shows the colocalization of these two proteins. Images were captured with a Nikon A1RMPsi-STORM4.0 confocal microscope (Melville, NY) at 60× magnification. (B) Global protein synthesis. FOLFOX HT29 cells were treated as above with 20 μM of NSC49L for 24 h. Cells were treated with 10 μg/mL of puromycin or puromycin plus 10 μg/mL of CHX for 15 min. Cells were washed and incubated in a fresh medium without drugs for an additional 2 h. Samples were blotted with anti-puromycin antibody. (C) Validate the experimental conditions, a concentration-dependent effect on p21 expression was performed. Cells were mock treated (control) or treated with 10 and 20 μM of NSC49L for 24 h and p21 level was determined. (D) Evaluate the effect of NSC49L on the regulation of p21 biosynthesis, we set up the experiment as in B. To determine the incorporation of puromycin into nascent p21, the pre-immunoprecipitated lysate was subjected to anti-puromycin immunoblot. (E) Quantitative analysis of the blot shown in panel D, which is presented as the ImageJ arbitrary units. Data are Mean ± SE of three experiments. The p-value is shown on the top of the graph. (F) β-actin was used as an internal control for equal loading. See also Figure S6.
Figure 12
Figure 12
Caspase 3 inhibitor ZDEVD reverses the cytotoxic effect of NSC49L and TRAIL in FOLFOX-HT29 cells Cells were pretreated with 20 μM ZDEVD for 3 h followed by the treatment with different concentrations of NSC49L and TRAIL either alone or in combination for an additional 72 h. Cell viability was determined using the MTT-assay. (A) The IC50 of TRAIL. (B) The IC50 of NSC49L in a combination of TRAIL. Data are the mean ± SE of four estimations. The p-value is shown on the top of each graph. (C) Western bots. For these experiments, after pretreatment with ZDEVD, the treatment with NSC49L and TRAIL either alone or in combination was carried out for 24 h. Blots are the representative of two different experiments. See also Figure S7.

References

    1. Abbas T., Dutta A. p21 in cancer: intricate networks and multiple activities. Nat. Rev. Cancer. 2009;9:400–414. doi: 10.1038/nrc2657. - DOI - PMC - PubMed
    1. Agarwal A., MacKenzie R.J., Pippa R., Eide C.A., Oddo J., Tyner J.W., Sears R., Vitek M.P., Odero M.D., Christensen D.J., Druker B.J. Antagonism of SET using OP449 enhances the efficacy of tyrosine kinase inhibitors and overcomes drug resistance in myeloid leukemia. Clin. Cancer Res. 2014;20:2092–2103. doi: 10.1158/1078-0432.ccr-13-2575. - DOI - PMC - PubMed
    1. Ashkenazi A., Pai R.C., Fong S., Leung S., Lawrence D.A., Marsters S.A., Blackie C., Chang L., McMurtrey A.E., Hebert A., et al. Safety and antitumor activity of recombinant soluble Apo2 ligand. J. Clin. Invest. 1999;104:155–162. doi: 10.1172/jci6926. - DOI - PMC - PubMed
    1. Bene A., Chambers T.C. p21 functions in a post-mitotic block checkpoint in the apoptotic response to vinblastine. Biochem. Biophys. Res. Commun. 2009;380:211–217. doi: 10.1016/j.bbrc.2009.01.032. - DOI - PMC - PubMed
    1. Beuvink I., Boulay A., Fumagalli S., Zilbermann F., Ruetz S., O'Reilly T., Natt F., Hall J., Lane H.A., Thomas G. The mTOR inhibitor RAD001 sensitizes tumor cells to DNA-damaged induced apoptosis through inhibition of p21 translation. Cell. 2005;120:747–759. doi: 10.1016/j.cell.2004.12.040. - DOI - PubMed