. 2022 Jun 8:13:905617.
doi: 10.3389/fgene.2022.905617. eCollection 2022.

Correlation Between Immune-Related Genes and Tumor-Infiltrating Immune Cells With the Efficacy of Neoadjuvant Chemotherapy for Breast Cancer

Affiliations

Correlation Between Immune-Related Genes and Tumor-Infiltrating Immune Cells With the Efficacy of Neoadjuvant Chemotherapy for Breast Cancer

Yan Zhou et al. Front Genet. .

Abstract

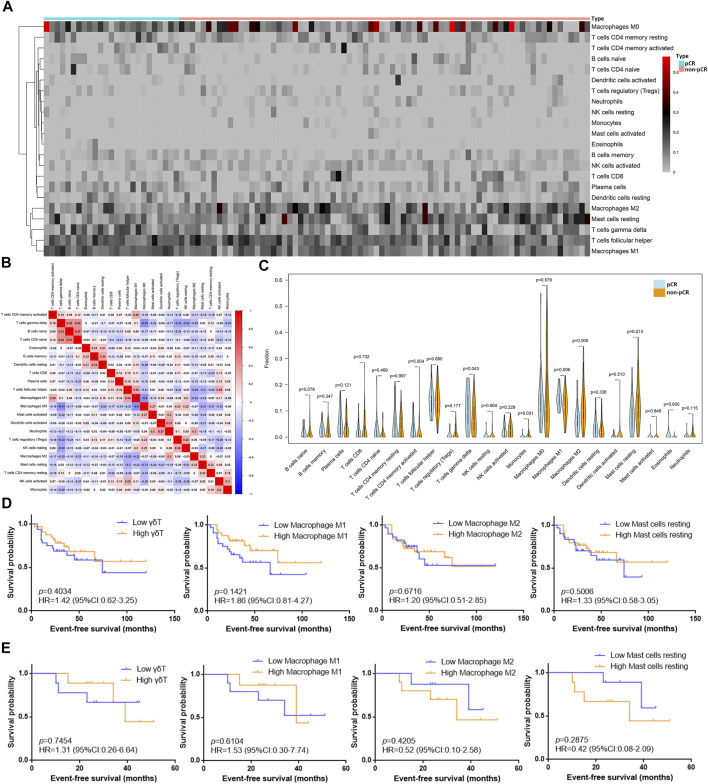
Background: In the absence of targeted therapy or clear clinically relevant biomarkers, neoadjuvant chemotherapy (NAC) is still the standard neoadjuvant systemic therapy for breast cancer. Among the many biomarkers predicting the efficacy of NAC, immune-related biomarkers, such as immune-related genes and tumor-infiltrating lymphocytes (TILs), play a key role. Methods: We analyzed gene expression from several datasets in the Gene Expression Omnibus (GEO) database and evaluated the relative proportion of immune cells using the CIBERSORT method. In addition, mIHC/IF detection was performed on clinical surgical specimens of triple-negative breast cancer patients after NAC. Results: We obtained seven immune-related genes, namely, CXCL1, CXCL9, CXCL10, CXCL11, IDO1, IFNG, and ORM1 with higher expression in the pathological complete response (pCR) group than in the non-pCR group. In the pCR group, the levels of M1 and γδT macrophages were higher, while those of the M2 macrophages and mast cells were lower. After NAC, the proportions of M1, γδT cells, and resting CD4 memory T cells were increased, while the proportions of natural killer cells and dendritic cells were decreased with downregulated immune-related genes. The results of mIHC/IF detection and the prognostic information of corresponding clinical surgical specimens showed the correlation of proportions of natural killer cells, CD8-positive T cells, and macrophages with different disease-free survival outcomes. Conclusion: The immune-related genes and immune cells of different subtypes in the tumor microenvironment are correlated with the response to NAC in breast cancer, and the interaction between TILs and NAC highlights the significance of combining NAC with immunotherapy to achieve better clinical benefits.

Keywords: biomarkers of breast cancer; immunogenetics; neoadjuvant chemotherapy; tumor immune microenvironment; tumor immunology.


Conflict of interest statement

The authors declare that the research was conducted in the absence of any commercial or financial relationships that could be construed as a potential conflict of interest.

Figures

FIGURE 1
FIGURE 1
Response of BC patients to NAC is related to immune-related genes and pathways. (A) Genetic clustering analysis of the heatmap showed DEGs (p value < 0.05, logFC >1 or logFC < −1) with the fold change TOP20 from dataset GSE32646. The redder points in the heatmap indicate the higher expression of the gene in the corresponding sample, while the green points indicate the lower expression. (B) Volcanic diagram of gene expression from the dataset GSE32646. All genes are in the diagram, the red dots represent logFC >1 and p value < 0.05 DEGs; the blue dots represent logFC < −1 and p value < 0.05 DEGs; the rest were gray points with no statistical significance. (C) PPI results obtained from DEGs of dataset GSE32646. Each node represents a gene and the line between the circle nodes represents the interaction between the two proteins. (D) Number of adjacent nodes for each gene is shown in a bar chart and genes with number of adjacent nodes ≥7 were identified as network core genes. (E) DEGs from dataset GSE32646 are enriched in the GO containing BP, CC, and MF. (F) KEGG pathways of DEGs from the dataset GSE32646. One bubble represents a KEGG term, the size of the bubble represents the number of genes in the enriched signaling pathway, and the color represents significance. (G) Visualization results of the KEGG pathways with NES value TOP15 obtained from the gene expression data in the dataset GSE123845.
FIGURE 2
FIGURE 2
Differences between immune cell fractions of the TIME in BC patients with different NAC responses. (A) Heatmap of the fraction of 22 immune cell types for comparison between pCR samples and non-pCR samples from dataset GSE32646. The redder points in the heatmap indicate that the fraction of immune cells in the corresponding sample was higher, while the gray points indicate lower fraction. (B) Correlation of 22 immune cells in the TIME from dataset GSE32646: Red represents positive correlation, blue represents negative correlation, and the depth of color indicates the strength of correlation. (C) Differential analysis of 22 immune cell fractions in pCR and non-pCR samples from dataset GSE32646. Blue represents pCR samples and orange represents non-pCR samples, and p value represents the statistical significance of the differential analysis between the two groups for each immune cell. (D) Survival analysis of different grouping by immune cells subtypes in 63 TNBC samples from dataset GSE31519. (E) Survival analysis of different grouping by immune cells subtypes in 18 TNBC samples received NAC from dataset GSE31519.
FIGURE 3
FIGURE 3
mIHC/IF results of different immune cell subtypes from six TNBC patients received NAC. The fluorescence staining of CD56 (A), CD8 (B), CD68, and HLA-DR (C). (D) mIHC/IF staining results of CD56, CD8, CD68, HLA-DR, PanCK, and DAPI.
FIGURE 4
FIGURE 4
Changes in immune-related genes and immune cell fractions in BC patients before and after NAC. (A) Genetic clustering analysis of the heatmap showed DEGs (p value < 0.05, logFC >1 or logFC < −1) with the fold change TOP20 from dataset GSE32072. (B) BP, CC, and MF of DEGs from dataset GSE32072. (C) Differential analysis of 22 immune cell fractions in pre-NAC and post-NAC samples from dataset GSE32072. Blue represents pre-NAC samples and orange represents pre-NAC samples, and p value represents the statistical significance of the differential analysis between the two groups for each immune cell. (D) PCA cluster analysis showed that the red dots represent the sample before NAC and the blue dots represent the sample after NAC. (E) Paired difference analysis of resting NK cells and M1 macrophages from dataset GSE32072 and CD4 memory resting T cells from dataset GSE18728.

References

    1. Axelrod M. L., Nixon M. J., Gonzalez-Ericsson P. I., Bergman R. E., Pilkinton M. A., McDonnell W. J., et al. (2020). Changes in Peripheral and Local Tumor Immunity after Neoadjuvant Chemotherapy Reshape Clinical Outcomes in Patients with Breast Cancer. Clin. Cancer Res. 26 (21), 5668–5681. 10.1158/1078-0432.Ccr-19-3685 - DOI - PMC - PubMed
    1. Chica-Parrado M. R., Godoy-Ortiz A., Jiménez B., Ribelles N., Barragan I., Alba E. (2020). Resistance to Neoadjuvant Treatment in Breast Cancer: Clinicopathological and Molecular Predictors. Cancers 12 (8), 2012. 10.3390/cancers12082012 - DOI - PMC - PubMed
    1. De Re V., Caggiari L., De Zorzi M., Talamini R., Racanelli V., Andrea M. D., et al. (2014). Genetic Diversity of the KIR/HLA System and Outcome of Patients with Metastatic Colorectal Cancer Treated with Chemotherapy. PLoS One 9 (1), e84940. 10.1371/journal.pone.0084940 - DOI - PMC - PubMed
    1. Denkert C., Loibl S., Noske A., Roller M., Müller B. M., Komor M., et al. (2010). Tumor-associated Lymphocytes as an Independent Predictor of Response to Neoadjuvant Chemotherapy in Breast Cancer. Jco 28 (1), 105–113. 10.1200/jco.2009.23.7370 - DOI - PubMed
    1. Denkert C., von Minckwitz G., Brase J. C., Sinn B. V., Gade S., Kronenwett R., et al. (2015). Tumor-infiltrating Lymphocytes and Response to Neoadjuvant Chemotherapy with or without Carboplatin in Human Epidermal Growth Factor Receptor 2-positive and Triple-Negative Primary Breast Cancers. Jco 33 (9), 983–991. 10.1200/jco.2014.58.1967 - DOI - PubMed