. 2022 Oct 15:369:132217.
doi: 10.1016/j.snb.2022.132217. Epub 2022 Jun 17.

Methylene Blue functionalized carbon nanodots combined with different shape gold nanostructures for sensitive and selective SARS-CoV-2 sensing

Affiliations

Methylene Blue functionalized carbon nanodots combined with different shape gold nanostructures for sensitive and selective SARS-CoV-2 sensing

Clara Pina-Coronado et al. Sens Actuators B Chem. .

Abstract

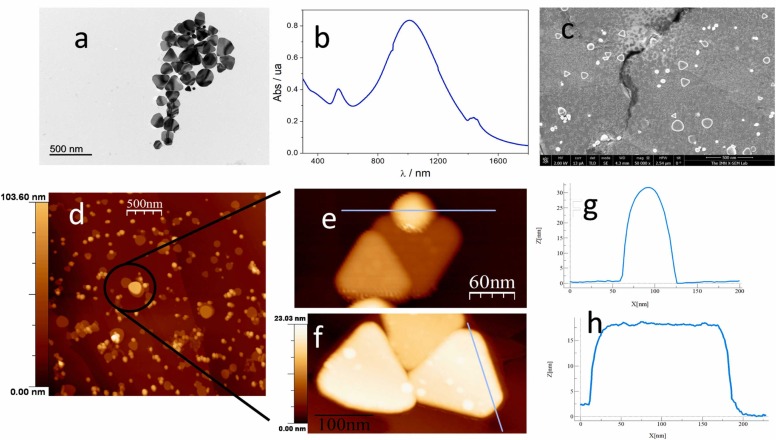
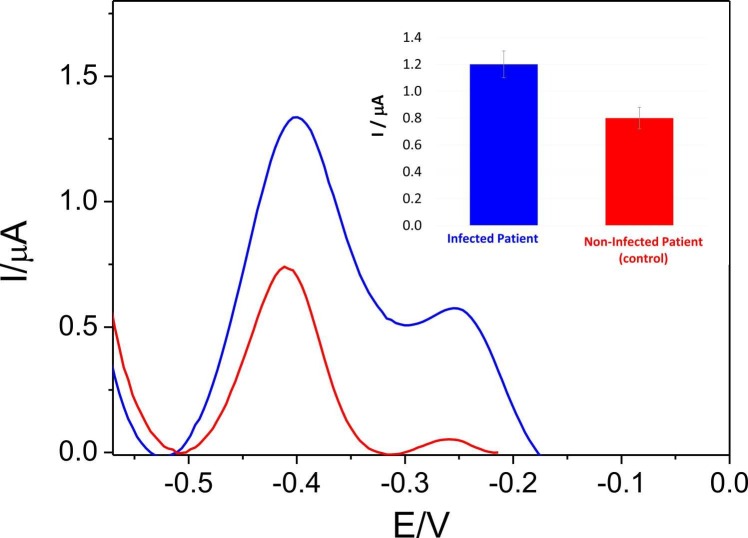
The development of DNA-sensing platforms based on new synthetized Methylene Blue functionalized carbon nanodots combined with different shape gold nanostructures (AuNs), as a new pathway to develop a selective and sensitive methodology for SARS-CoV-2 detection is presented. A mixture of gold nanoparticles and gold nanotriangles have been synthetized to modify disposable electrodes that act as an enhanced nanostructured electrochemical surface for DNA probe immobilization. On the other hand, modified carbon nanodots prepared a la carte to contain Methylene Blue (MB-CDs) are used as electrochemical indicators of the hybridization event. These MB-CDs, due to their structure, are able to interact differently with double and single-stranded DNA molecules. Based on this strategy, target sequences of the SARS-CoV-2 virus have been detected in a straightforward way and rapidly with a detection limit of 2.00 aM. Moreover, this platform allows the detection of the SARS-CoV-2 sequence in the presence of other viruses, and also a single nucleotide polymorphism (SNPs). The developed approach has been tested directly on RNA obtained from nasopharyngeal samples from COVID-19 patients, avoiding any amplification process. The results agree well with those obtained by RT-qPCR or reverse transcription quantitative polymerase chain reaction technique.

Keywords: AuNs; Carbon nanodots; DNA biosensor; MB-CDs; SARS-CoV-2.


Conflict of interest statement

The authors declare that they have no known competing financial interests or personal relationships that could have appeared to influence the work reported in this paper.

Figures

ga1
Graphical abstract
Fig. 1
Fig. 1
(a) TEM micrograph of MB-CDs. (b) FT-IR spectra of Methylene Blue (blue curve), unmodified CDs (black curve) and MB-CDs (red curve). (c) UV-Visible spectra of 12.5 µM Methylene Blue (blue curve), 140 ng mL−1 of unmodified CDs (black curve) and 140 ng mL−1 MB-CDs (red curve) in MilliQ-water. (d) Cyclic voltammograms of: 50 µM Methylene Blue (blue curve) and 600 ng mL−1 of MB-CDs (red curve), in pH 7 0.1 M PB at 100 mV s−1. Ref Ag.
Fig. 2
Fig. 2
Absorption spectra of MB-CDs in the absence (black line) and in the presence of increasing amounts of dsDNA (a) or ssDNA (b) in water solution. c) Cyclic voltammograms of MB-CDs in pH 7.0 0.1 M PB solution at a nacked AuSPE (black curve), a dsDNA/AuSPE (blue curve) and a ssDNA/AuSPE (red curve). Scan rate: 100 mV s−1. d) DPVs of MB-CDs in pH 7.0 0.1 M PB after accumulation in AuSPE (black curve), ssDNA/AuSPE (red curve) and dsDNA/AuSPE (blue curve).
Fig. 3
Fig. 3
a) TEM image, b) UV–visible-NIR spectra, c) SEM image and d) AFM image of gold nanostructures (AuNs). e) Magnification of AuNPs and f) AuNTs and their respective profiles g) and h).
Scheme 1
Scheme 1
Design of the biosensor.
Fig. 4
Fig. 4
a) Cyclic voltammograms from −0.5 to 1.5 V (vs Ag) of a AuSPE (black line) and an AuNs/AuSPE (blue line) in 0.1 M H2SO4. SEM image of a AuSPE (b) and AuNs/AuSPE (c). d) Topography AFM image (derivative) of the prepared AuNs/AuSPE. e) Cyclic voltammograms (CVs) of MB-CDs in 0.1 M PB pH 7.0 at AuNs/AuSPE (black curve) and Probe-SH/AuNs/AuSPE (blue line). Scan rate: 100 mV s−1. f) Fluorescence image of ProbeTAMRA-SH/AuNs/AuSPE.
Fig. 5
Fig. 5
DPVs (a) and bar diagrams (b) of the biosensor response (Probe-SH/AuNs/AuSPE) in pH 7.0 0.1 M PB solution, before (black curve) and after hybridization with a complementary sequence, SARS-CoV-2 (blue curve), and a non-complementary sequence, SARS-CoV2N (red curve), after accumulation of MB-CDs. c) DPVs response of Probe-SH/AuNs/AuSPE in pH 7.0 0.1 M PB solution after hybridization with different concentrations (from 10.0 aM to 10.0 nM) of the complementary sequence, SARS-CoV-2, after MB-CDs accumulation. d) Calibration curve obtained. Error bars correspond to the standard deviation of three different biosensors (n = 3).
Fig. 6
Fig. 6
Bar diagrams of the biosensor response (Probe-SH/AuNs/AuSPE) in pH 7.0 0.1 M PB solution, after hybridization with: a 50.0 pM complementary sequence (SARS-CoV-2) (third bar), a mixture of 50.0 pM of SARS-CoV-2 and 50.0 pM of Influenza A sequences (first bar), a mixture of 50.0 pM of SARS-CoV-2 and 50.0 pM of SARS-CoV sequences (second bar) and a 50.0 pM mutated sequence (SARS-CoV-2SP) (last bar).
Fig. 7
Fig. 7
DPVs and bar diagrams (inset) of the biosensor response (Probe-SH/AuNs/AuSPE) in pH 7.0 0.1 M PB solution, after hybridization with a nasopharinge sample of: an infected patient (blue curve) and non infected patient of COVID-19 (red curve).

References

    1. WHO Director-General’s opening remarks at the media briefing on COVID-19 - 11 March 2020, (2020). 〈https://www.who.int/director-general/speeches/detail/who-director-gener... (accessed June 11, 2021).
    1. Chaibun T., Puenpa J., Ngamdee T., Boonapatcharoen N., Athamanolap P., O’Mullane A.P., Vongpunsawad S., Poovorawan Y., Lee S.Y., Lertanantawong B. Rapid electrochemical detection of coronavirus SARS-CoV-2. Nat. Commun. 2021;12:1–10. doi: 10.1038/s41467-021-21121-7. - DOI - PMC - PubMed
    1. Lee J., Song J.U., Shim S.R. Comparing the diagnostic accuracy of rapid antigen detection tests to real time polymerase chain reaction in the diagnosis of SARS-CoV-2 infection: a systematic review and meta-analysis. J. Clin. Virol. 2021;144 doi: 10.1016/J.JCV.2021.104985. - DOI - PMC - PubMed
    1. Samacoits A., Nimsamer P., Mayuramart O., Chantaravisoot N., Sitthi-amorn P., Nakhakes C., Luangkamchorn L., Tongcham P., Zahm U., Suphanpayak S., Padungwattanachoke N., Leelarthaphin N., Huayhongthong H., Pisitkun T., Payungporn S., Hannanta-anan P. Machine Learning-Driven and Smartphone-Based Fluorescence Detection for CRISPR Diagnostic of SARS-CoV-2. ACS Omega. 2021;6:2727–2733. doi: 10.1021/ACSOMEGA.0C04929. - DOI - PMC - PubMed
    1. Márquez-Ipiña A.R., González-González E., Rodríguez-Sánchez I.P., Lara-Mayorga I.M., Mejía-Manzano L.A., Sánchez-Salazar M.G., González-Valdez J.G., Ortiz-López R., Rojas-Martínez A., Santiago G.T., Alvarez M.M. Serological test to determine exposure to SARS-CoV-2: ELISA based on the receptor-binding domain of the spike protein (S-RBDN318-V510) expressed in escherichia coli. Diagnostics. 2021;Vol. 11:271. doi: 10.3390/DIAGNOSTICS11020271. - DOI - PMC - PubMed

LinkOut - more resources