. 2022 Jun 9;7(24):20719-20730.
doi: 10.1021/acsomega.2c00999. eCollection 2022 Jun 21.

Entropies Derived from the Packing Geometries within a Single Protein Structure

Affiliations

Entropies Derived from the Packing Geometries within a Single Protein Structure

Pranav M Khade et al. ACS Omega. .

Abstract

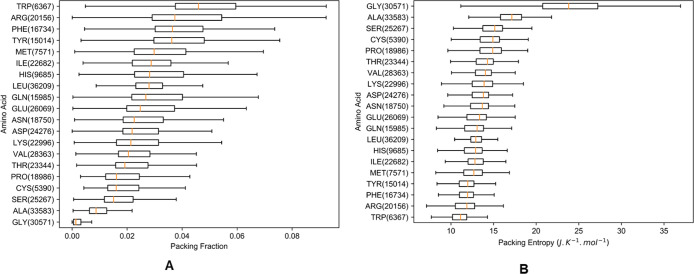
A fast, simple, yet robust method to calculate protein entropy from a single protein structure is presented here. The focus is on the atomic packing details, which are calculated by combining Voronoi diagrams and Delaunay tessellations. Even though the method is simple, the entropies computed exhibit an extremely high correlation with the entropies previously derived by other methods based on quasi-harmonic motions, quantum mechanics, and molecular dynamics simulations. These packing-based entropies account directly for the local freedom and provide entropy for any individual protein structure that could be used to compute free energies directly during simulations for the generation of more reliable trajectories and also for better evaluations of modeled protein structures. Physico-chemical properties of amino acids are compared with these packing entropies to uncover the relationships with the entropies of different residue types. A public packing entropy web server is provided at packing-entropy.bb.iastate.edu, and the application programing interface is available within the PACKMAN (https://github.com/Pranavkhade/PACKMAN) package.


Conflict of interest statement

The authors declare no competing financial interest.

Figures

Figure 1
Figure 1
Voronoi diagram is generated for all atoms and after that atoms belonging to the same residue are combined (A) Voronoi diagram of a hypothetical example of an all-atom 2D structure; each cell is around an atom; lines separating (Voronoi edges) any two hypothetical atoms are equidistant from both atoms. Each pattern represents a Voronoi cell group (atoms belonging to the same residue). (B) Logic behind the Voronoi border determination in 2D space. The border points to limit the Voronoi diagrams should be generated at twice the distance of addition of the probe radius (usually solvent) and van der Waals radius. (C) Example of 3D Voronoi diagram; a Voronoi cell in 3D is derived identical to 2D; however, except that Voronoi edges are replaced by Voronoi planes. The gray-colored structure is an amino acid chain, and the blue points represent the border points described in the Methods section to trim the Voronoi diagram. The red lines represent the Voronoi plane boundaries.
Figure 2
Figure 2
Packing entropy values (X-axis) are plotted against the packing fraction interval (Y-axis). This shows a non-linear relationship between entropy and packing fraction, as shown in eq 3.
Figure 3
Figure 3
Total Entropy vs SASA. The R2 score of the linear regression model (shown as a dotted line) is 0.6828. Pearson’s correlation coefficient is 0.826 for the same data. The values are provided in Table S4.
Figure 4
Figure 4
Box plots of residue type packing fractions and the corresponding packing entropies. The number of occurrences of the different types of amino acids in Dataset 1 for each residue is noted in parentheses following each amino acid three-letter code on Y-axis in both A and B. (A) Highest median value of packing fraction is around 0.05, which means that even for one of the largest amino acids, there is usually a significant volume available to move around and the relative difference in the volume occupied by the amino acids is reflected in the graph, together with overall higher variances for the larger amino acids. (B) There is a general trend for smaller amino acids to have higher entropies as well, with the high value for glycine being particularly notable. This means that they pack less tightly than the larger amino acids; these extreme values for glycine may reflect its frequent appearance on the surface and in turns, but also its lack of any side chain degrees of freedom, which suggests that side-chain flexibility is important to achieve the higher packing densities. Also, the means for most amino acid types lie between 10 and 30 J ° K–1 mol–1. Entropy for each type of amino acid.
Figure 5
Figure 5
Comparison of entropies for the set of 30 proteins from Dataset 2. All entropies are in J ° K–1 mol–1. (A) Packing entropy compared with Schlitter QM entropies. (B) Packing entropy compared with Andricioaei MD entropies. (C) Packing entropies compared with FoldX Entropies. High correlations are observed for all cases as shown in Table 2.
Figure 6
Figure 6
Comparison of entropies for the set of 73 proteins from Dataset 3 from the same study. All entropies are in J K–1 mol–1. (A) Packing entropies compared with QHA. (B) Packing entropies compared with MCC.
Figure 7
Figure 7
Comparison of entropies for the set of 30 proteins from Dataset 2. All entropies are in J ° K–1 mol–1. Normalized entropies are obtained by dividing the total entropy of the protein by 3N – 6, where N is the number of heavy atoms in that protein. (A) Normalized packing entropy compared with Normalized Schlitter QM entropies. (B) Normalized packing entropy compared with Normalized Andricioaei MD entropies. (C) Normalized packing entropies compared with normalized FoldX entropies. High correlations are observed for all cases as shown in Table 2.
Figure 8
Figure 8
Comparison of entropies for the set of 73 proteins from Dataset 3 from the same study. All entropies are in J K–1 mol–1. Normalized entropies are obtained by dividing the total entropy of the protein by 3N – 6, where N is the number of heavy atoms in that protein. (A) Normalized packing entropies compared with normalized QHA. (B) Normalized packing entropies compared with normalized MCC.
Figure 9
Figure 9
Subset of examples in Dataset 2 that are selected from individual clusters as seen in Figure 7C by sorting with normalized FoldX and normalized packing entropy values. (A) Structures sorted from low to high with normalized entropy appear as data points on the bottom left side of Figure 7C (B). Structures sorted from high to low with normalized entropy appear as data points on the bottom left side of Figure 7C.
Figure 10
Figure 10
Subset of examples in Dataset 3 that are selected from individual clusters as seen in Figure 8 by sorting with normalized MCC and normalized packing entropy values. (A) Structures sorted from low to high with normalized entropy appear as data points on the bottom left side of Figure 8C (B). Structures sorted from high to low with normalized entropy appear as data points on the bottom left side of Figure 8C.
Figure 11
Figure 11
Contour plot of the packing entropy vs hydrophobicity. The data displayed is for 396,783 residues, and consequently, the contours are fairly smooth. Several noticeable peaks are observed on the different spectrum of hydrophobicity.
Figure 12
Figure 12
Packing entropy (X-axis) compared with various Kidera factors (Y-axis).

References

    1. Dunker A. K.; Lawson J. D.; Brown C. J.; Williams R. M.; Romero P.; Oh J. S.; Oldfield C. J.; Campen A. M.; Ratliff C. M.; Hipps K. W.; Ausio J.; Nissen M. S.; Reeves R.; Kang C. H.; Kissinger C. R.; Bailey R. W.; Griswold M. D.; Chiu W.; Garner E. C.; Obradovic Z. Intrinsically Disordered Protein. J. Mol. Graphics Modell. 2001, 19, 26.10.1016/S1093-3263(00)00138-8. - DOI - PubMed
    1. Sun Z.; Yan Y. N.; Yang M.; Zhang J. Z. H. Interaction Entropy for Protein-Protein Binding. J. Chem. Phys. 2017, 146, 124124.10.1063/1.4978893. - DOI - PubMed
    1. Gilson M. K.; Zhou H.-X. Calculation of Protein-Ligand Binding Affinities. Annu. Rev. Biophys. Biomol. Struct. 2007, 36, 21–42. 10.1146/ANNUREV.BIOPHYS.36.040306.132550. - DOI - PubMed
    1. Wand A. J.; Sharp K. A. Measuring Entropy in Molecular Recognition by Proteins. Annu. Rev. Biophys. 2018, 47, 41–61. 10.1146/ANNUREV-BIOPHYS-060414-034042. - DOI - PMC - PubMed
    1. Caro J. A.; Harpole K. W.; Kasinath V.; Lim J.; Granja J.; Valentine K. G.; Sharp K. A.; Wand A. J. Entropy in Molecular Recognition by Proteins. Proc. Natl. Acad. Sci. U.S.A. 2017, 114, 6563–6568. 10.1073/PNAS.1621154114. - DOI - PMC - PubMed

LinkOut - more resources