. 2022 May 6;4(3):fcac115.
doi: 10.1093/braincomms/fcac115. eCollection 2022.

Distributed brain co-processor for tracking spikes, seizures and behaviour during electrical brain stimulation

Affiliations

Distributed brain co-processor for tracking spikes, seizures and behaviour during electrical brain stimulation

Vladimir Sladky et al. Brain Commun. .

Abstract

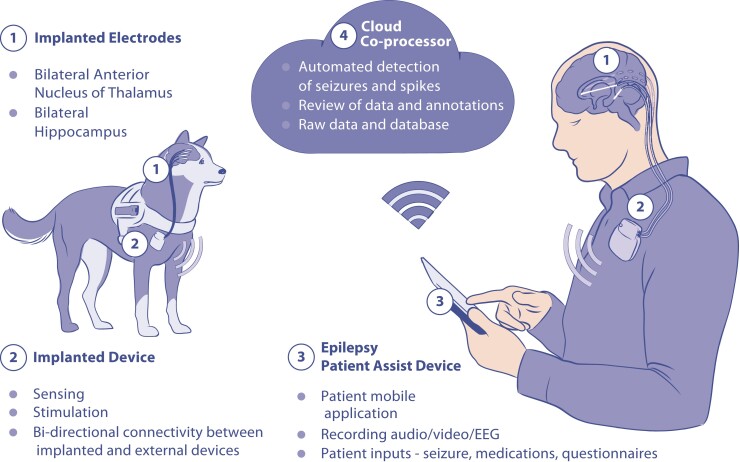
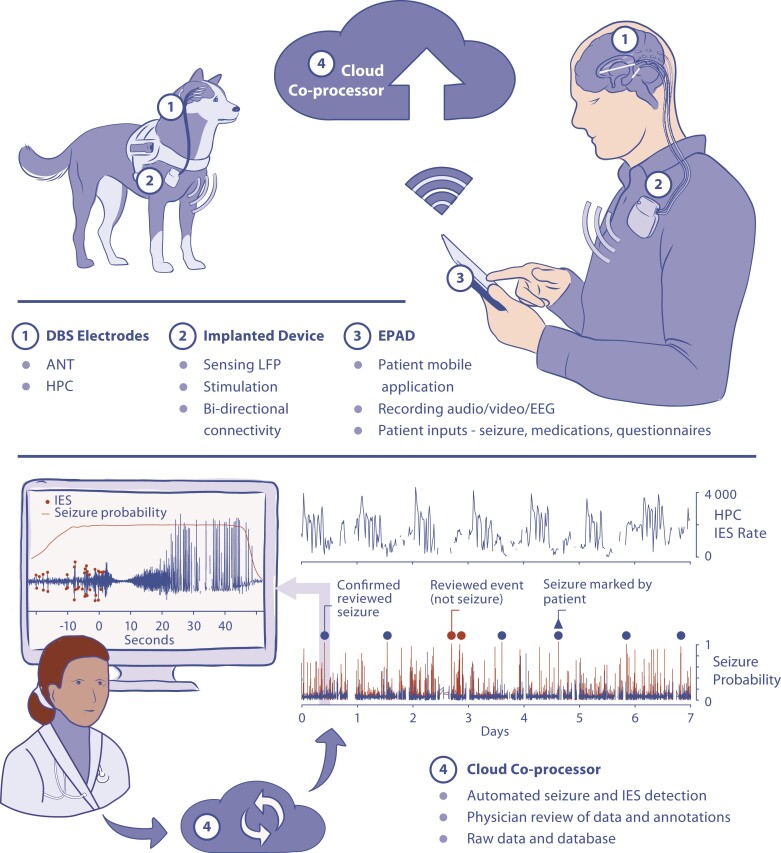
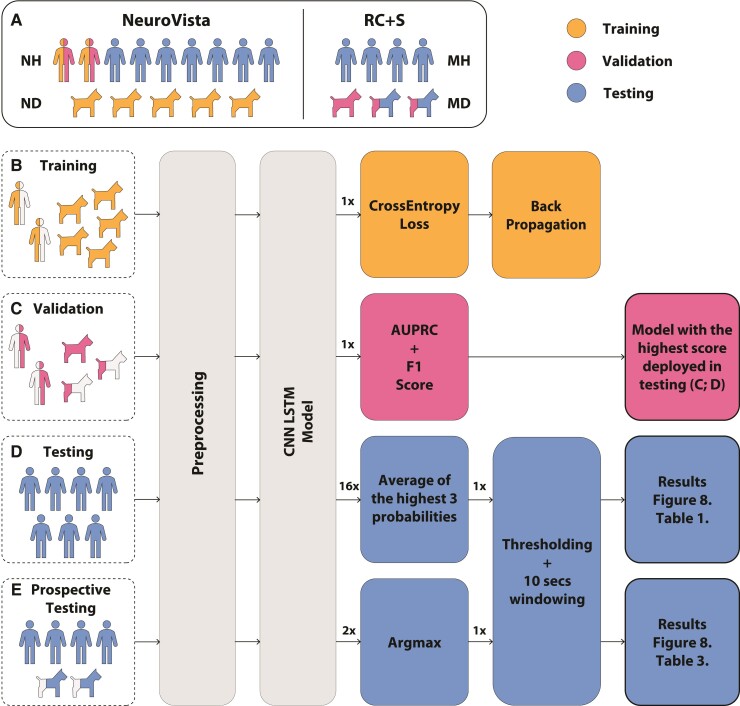
Early implantable epilepsy therapy devices provided open-loop electrical stimulation without brain sensing, computing, or an interface for synchronized behavioural inputs from patients. Recent epilepsy stimulation devices provide brain sensing but have not yet developed analytics for accurately tracking and quantifying behaviour and seizures. Here we describe a distributed brain co-processor providing an intuitive bi-directional interface between patient, implanted neural stimulation and sensing device, and local and distributed computing resources. Automated analysis of continuous streaming electrophysiology is synchronized with patient reports using a handheld device and integrated with distributed cloud computing resources for quantifying seizures, interictal epileptiform spikes and patient symptoms during therapeutic electrical brain stimulation. The classification algorithms for interictal epileptiform spikes and seizures were developed and parameterized using long-term ambulatory data from nine humans and eight canines with epilepsy, and then implemented prospectively in out-of-sample testing in two pet canines and four humans with drug-resistant epilepsy living in their natural environments. Accurate seizure diaries are needed as the primary clinical outcome measure of epilepsy therapy and to guide brain-stimulation optimization. The brain co-processor system described here enables tracking interictal epileptiform spikes, seizures and correlation with patient behavioural reports. In the future, correlation of spikes and seizures with behaviour will allow more detailed investigation of the clinical impact of spikes and seizures on patients.

Keywords: electrophysiology; epilepsy; machine learning; seizures.


Figures

Graphical Abstract
Graphical Abstract
Figure 1
Figure 1
Distributed brain co-processor. Integrating implanted sensing and stimulation devices with off-the-body and cloud computing resources. The system was developed and prospectively tested in canines and humans with drug-resistant epilepsy living in their natural environments. (Top) Schematic for bi-directional data transmission between implanted brain sensing and stimulation device integrated with local handheld computer (epilepsy patient assist device) and cloud environment. Deep brain-stimulation (DBS) electrodes were implanted in anterior nucleus of thalamus (ANT) and hippocampus (HPC). The integrated system provides a platform for chronic ambulatory monitoring of patient reported behaviour, device data (battery, telemetry and electrode impedance), seizures and interictal epileptiform spikes (IESs). (Bottom) The cloud co-processor enables connection to distributed devices, review of electrophysiology data and analytics from a battery of algorithms running on the patient’s local handheld or in the cloud environment. The physician can quickly review and confirm or reject automatically detected and patient reported candidate seizure events. The panel shows 7 days of continuous hippocampal IES rates and seizure detection probability. Triangles show patient reported seizure events. Circles denote automated seizure detections either confirmed as seizures (blue dots) or false positive (red) by expert visual review. Monitor inset shows example of raw data from hippocampus with automated IES detections (red dots). The patient was aware and reported (triangle) one out of the six seizures detected in the continuous intracranial EEG (iEEG) and confirmed by the physician.
Figure 2
Figure 2
Schema of training, validation and testing data sets used in development of a generic, automated seizure detection algorithm for canines and humans. The preprocessing pipeline is the same for all data sets and represents the transition from raw iEEG data to normalized spectrograms. (A) Retrospective data included human and canine data sets acquired with two different investigational devices, NeuroVista (NV) and RC + S™ device. (B) Algorithm training was performed using retrospective data from humans and canines collected with NV devices. (C) The validation data included NV data from two humans (NH1 and NH2) and RC + S™ data from three canines (MD1–3). The validation data set was used to select the optimal convolutional neural network with long-short-term memory (CNN LSTM) model that was subsequently deployed in testing. The area under the precision-recall curve (AUPRC) and F1 score was calculated on the validation data set during training. The model with the highest combined score was deployed in testing. (D) Pseudo-prospective (data from seven humans; NH3-9) and (E) prospective (RC + S™ data from four patients MH1–4 and two pet dogs MD2 and MD3) ambulatory testing in human and canines living in natural environments (human at home and dogs living with their owners) were performed over multiple months (see results in Fig. 8 and Table 3). To get one probability signal from NV and RC + S™ devices, we aggregate CNN LSTM model outputs from multiple channels by average and argmax functions, respectively.
Figure 3
Figure 3
Canine stereotactic implant. (A) A 6-year-old pet dog with drug-resistant epilepsy. High resolution (B), Sagittal (C) and axial (D) coronal T1 MRI. The electrodes were implanted by direct visual targeting of anterior nucleus of thalamus and hippocampus.
Figure 4
Figure 4
Human subject MH1. (A) Papez circuit and implanted electrodes targeting bilateral anterior nucleus thalamus (ANT), Hippocampus (HPC) and amygdala (AMG). (B) MRI—the ANT and HPC electrodes from co-registration of MRI and post-implant CT are highlighted.
Figure 5
Figure 5
From raw iEEG data to probability and seizure detection. (A) One minute of iEEG data recorded with NeuroVista device, 16 neocortical electrode contacts, containing a spontaneous seizure of subject NH7. The seizure is present on a few channels with a good signal to background ratio suitable for automated detection. (B) Time-frequency analysis of iEEG signals shows the different signatures of seizure electrophysiology (shaded area) in different channels: channel 1, where seizure is notable and channel 4 where it is hard to identify. (C) Plots of classifier probabilities for each electrode (channels 1–4 in colour CH1–4) below actual raw data showing that for some electrodes, the seizure is very prominent and for some not differentiable from the background signal. (D) The classifier output probabilities for top three probabilities together with the mean (bold line) and threshold (horizontal line) showing when the detection is raised (time 0).
Figure 6
Figure 6
Long-term analysis of interictal epileptiform spike (IES) rates. Visual example of comparing spike detections between the automated approach and human operators for (A) day/awake and (B) night/sleep period. (C) Daily averaged spike rate per hour in left (top) and right (bottom) hippocampus during night and day periods of time in 8 weeks of MH1 recording. (D) The graph shows peak-to-peak (P2P) amplitudes of automatically detected IES grouped by location in each patient over a 2-month period. Every group has more than 5000 samples. Medians are visualized by symbols (MH1–4) and vertical lines depict standard deviations. Due to non-normal distribution of data the Mann–Whitney U test was used to measure statistical significance between P2P amplitudes during day/night periods of time in each patient. There are significant differences between night/day in left hippocampal IES peak-to-peak amplitudes during the prospective testing period for all four patients implanted with RC + S™.
Figure 7
Figure 7
A representative hippocampal seizure from human subject MH1 (RC + S). (Top) Time-frequency characteristics (z-scored spectrogram), (Bottom) raw intracranial EEG data with the physician annotated seizure (onset denoted by arrow) and model seizure probability (bold trace) for patient MH1 in the out-of-sample data set is shown. The figure demonstrates how the probability of the long-short-term memory (LSTM) network changes over a peri-seizure period (pre-ictal, ictal and post-ictal period). The high probability (near 1) in the peri-seizure region highlights the impact of the LSTM function for raising the probability during and around the seizure time.
Figure 8
Figure 8
The convolution neural network with long-short-term memory network (CNN LSTM) model performance. The model with the highest validation score was deployed in the out-of-sample retrospective testing in human (dotted lines NH3–9), and prospective testing in human (solid lines MH1–4) and canine (dashed lines MD2 and MD3) subjects. (A) Precision-recall curves (PRCs) and (B) receiver operating curves (ROC). The detailed view of the ROC (blow-up view in bottom right panel) shows the results for each subject with optimal detector parameters that minimize the false-positive rate and maximize sensitivity. The PRC and ROC curves are calculated by sequentially changing the model probability threshold and evaluating the results of precision, recall and false-positive rate for all seizures for each subject in the testing data sets.

References

    1. Fiest KM, Sauro KM, Wiebe S, et al. Prevalence and incidence of epilepsy. Neurology. 2017;88(3):296–303. - PMC - PubMed
    1. Murray CJL, Vos T, Lozano R, et al. Disability-adjusted life years (DALYs) for 291 diseases and injuries in 21 regions, 1990–2010: A systematic analysis for the Global Burden of Disease Study 2010. Lancet. 2012;380(9859):2197–2223. - PubMed
    1. Kwan P, Schachter SC, Brodie MJ. Drug-resistant epilepsy. N Engl J Med. 2011;365(10):919–926. - PubMed
    1. Nair DR, Laxer KD, Weber PB, et al. Nine-year prospective efficacy and safety of brain-responsive neurostimulation for focal epilepsy. Neurology. 2020;95(9):e1244–e1256. - PMC - PubMed
    1. Salanova V, Sperling MR, Gross RE, et al. The SANTÉ study at 10 years of follow-up: Effectiveness, safety, and sudden unexpected death in epilepsy. Epilepsia. 2021;62(6):1306–1317. - PubMed