. 2022 Jun 9:13:889811.
doi: 10.3389/fmicb.2022.889811. eCollection 2022.

SARS-CoV-2 Whole-Genome Sequencing Using Oxford Nanopore Technology for Variant Monitoring in Wastewaters

Collaborators, Affiliations

SARS-CoV-2 Whole-Genome Sequencing Using Oxford Nanopore Technology for Variant Monitoring in Wastewaters

Laure Barbé et al. Front Microbiol. .

Abstract

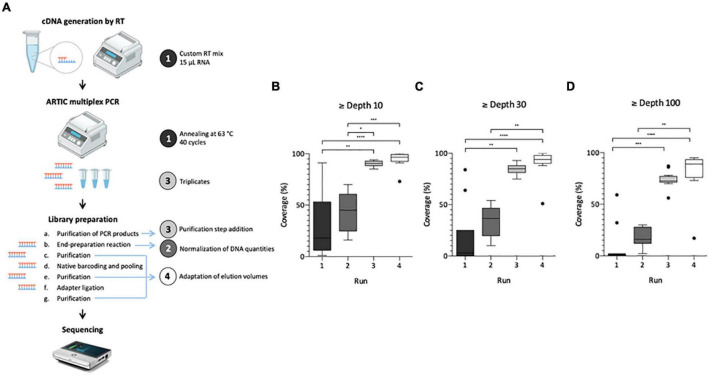
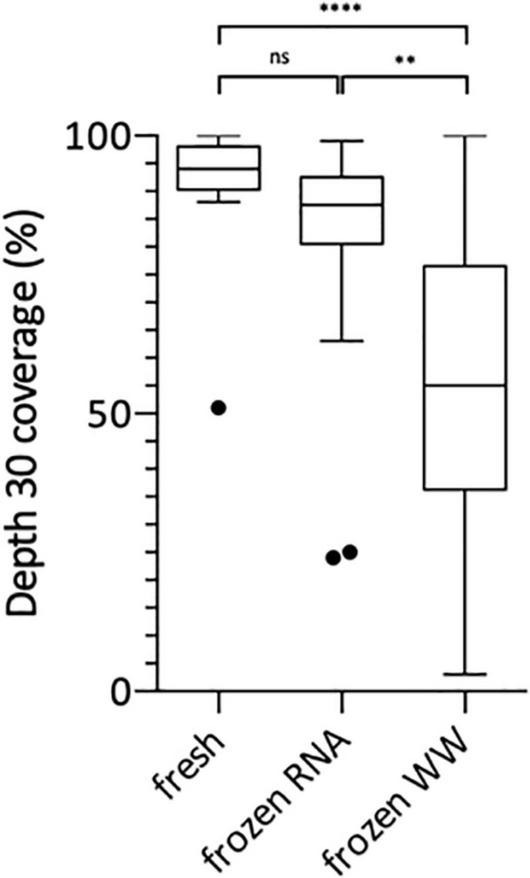
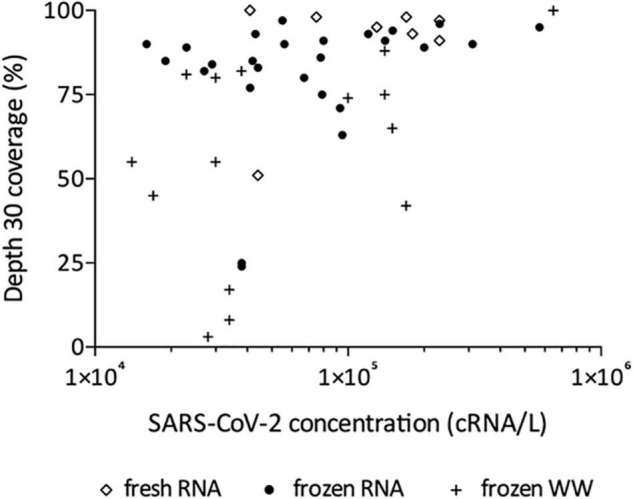
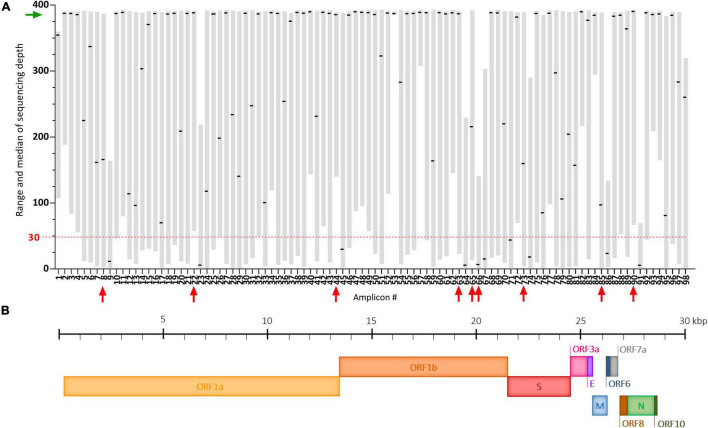
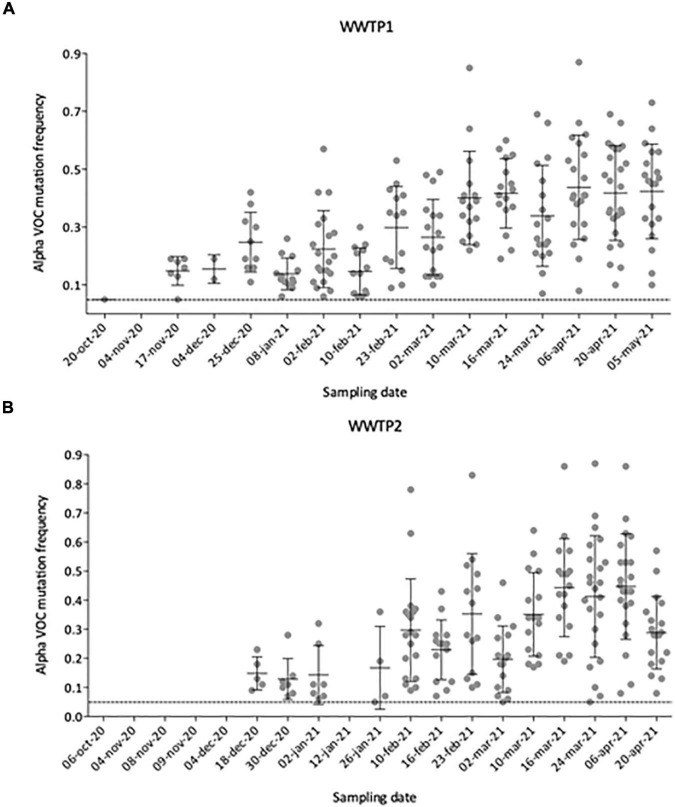
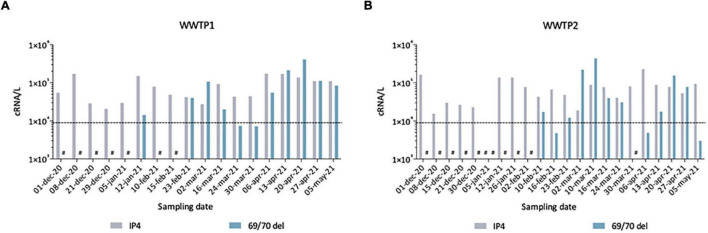
Since the beginning of the Coronavirus Disease-19 (COVID-19) pandemic, multiple Severe Acute Respiratory Syndrome Coronavirus 2 (SARS-CoV-2) mutations have been reported and led to the emergence of variants of concern (VOC) with increased transmissibility, virulence or immune escape. In parallel, the observation of viral fecal shedding led to the quantification of SARS-CoV-2 genomes in wastewater, providing information about the dynamics of SARS-CoV-2 infections within a population including symptomatic and asymptomatic individuals. Here, we aimed to adapt a sequencing technique initially designed for clinical samples to apply it to the challenging and mixed wastewater matrix, and hence identify the circulation of VOC at the community level. Composite raw sewage sampled over 24 h in two wastewater-treatment plants (WWTPs) from a city in western France were collected weekly and SARS-CoV-2 quantified by RT-PCR. Samples collected between October 2020 and May 2021 were submitted to whole-genome sequencing (WGS) using the primers and protocol published by the ARTIC Network and a MinION Mk1C sequencer (Oxford Nanopore Technologies, Oxford, United Kingdom). The protocol was adapted to allow near-full genome coverage from sewage samples, starting from ∼5% to reach ∼90% at depth 30. This enabled us to detect multiple single-nucleotide variant (SNV) and assess the circulation of the SARS-CoV-2 VOC Alpha, Beta, Gamma, and Delta. Retrospective analysis of sewage samples shed light on the emergence of the Alpha VOC with detection of first co-occurring signature mutations in mid-November 2020 to reach predominance of this variant in early February 2021. In parallel, a mutation-specific qRT-PCR assay confirmed the spread of the Alpha VOC but detected it later than WGS. Altogether, these data show that SARS-CoV-2 sequencing in sewage can be used for early detection of an emerging VOC in a population and confirm its ability to track shifts in variant predominance.

Keywords: ARTIC; Oxford Nanopore Technology; SARS-CoV-2; next-generation sequencing; sewage; variant of concern; wastewater-based epidemiology.


Conflict of interest statement

The authors declare that the research was conducted in the absence of any commercial or financial relationships that could be construed as a potential conflict of interest.

Figures

FIGURE 1
FIGURE 1
Adaptation process of SARS-CoV-2 genome sequencing from wastewater samples. Left panel illustrates the protocol summary (A) with adaptation lines 1–4 depicted by a colored circle, same colors are used for box plot panels (B–D). Box Plot (Tukey whiskers) of SARS-CoV-2 genome coverage percentages obtained per run of sequencing on raw wastewater samples at depth 10 (B), 30 (C), and 100 (D) during the adaptation process of the ARTIC protocol. Adaptation lines were for Run 1: cDNA synthesis (15 μ1 RNA extract, random hexamers and SuperScript II reverse transcriptase), ARTIC multiplex PCR (annealing at 63°C, 40 cycles); Run 2: library preparation (normalization of initial DNA quantities); Run 3: ARTIC multiplex PCR (triplicates for each pool), library preparation (addition of an initial purification step of PCR products); Run 4: library preparation (addition of a purification step between the end-preparation and the barcoding reactions, adaptation of elution volumes to maximize recovery). Kruskal-Wallis test followed by Dunn’s multiple comparisons test were used to compare groups (****p < 0.0001, ***p < 0.001, **p < 0.01, *p < 0.05 and not significant if no indication on the plot) Panel A is adapted from Hourdel et al. (2020).
FIGURE 2
FIGURE 2
Box Plot of SARS-CoV-2 genome coverage percentages obtained at depth 30 using the previously adapted method and starting from freshly prepared RNA, frozen RNA and frozen wastewater (WW). Kruskal-Wallis test followed by Dunn’s multiple comparisons test were used to compare groups (****p < 0.0001, **p < 0.01, ns: not significant).
FIGURE 3
FIGURE 3
Effect of SARS-CoV-2 concentration on depth 30 genome coverage using the adapted method and starting from freshly prepared RNA, frozen RNA and frozen wastewater (WW). Spearman test was used to test correlation between the two parameters for all samples (p = 0.0004, r = 0.4881) and each group individually: frozen RNA samples (p = 0.0349, r = 0.4153), fresh RNA samples (r = 0.3253, p > 0.05), and frozen WW samples (r = 0.3522, p > 0.05).
FIGURE 4
FIGURE 4
Coverage analysis of the SARS-CoV-2 genome using our adapted ARTIC sequencing protocol. (A) Plot depicting the range (gray floating bars) and medians (black horizontal lines) of sequencing depth obtained for each of the 98 amplicons of the ARTIC multiplex PCR in 35 raw wastewater samples included in the study. Very poorly covered amplicons (median < 30, red dashed line) are indicated by red arrows and the green arrow shows satisfying medians of sequencing depth. (B) Schematic representation of the SARS-CoV-2 genome.
FIGURE 5
FIGURE 5
Heatmap of the frequency (color shades) of VOC signature mutations (x axis) in raw wastewater samples collected in 2 WWTP from Nantes overtime (y axis). Blue: Alpha VOC, red: Beta VOC and black: shared mutations. White indicates that no mutation was detected after applying quality filtering and detection thresholds.
FIGURE 6
FIGURE 6
Number and individual frequencies (dots) of SARS-CoV-2 Alpha VOC over time in 35 raw wastewater samples from WWTP1 (A) and WWTP2 (B), with median frequency (horizontal lines) and standard deviation (error bars). Only mutation with frequencies above 5% (dotted line) were considered.
FIGURE 7
FIGURE 7
Quantification of total SARS-CoV-2 (IP4) and Alpha VOC (69/70 del) estimated by qRT-PCR in raw wastewater samples from WWTP1 (A) and WWTP2 (B). Some samples gave signals below the theoretical limit of detection (LOD) of 9 × 10³ cRNA/L (dotted line), others gave no signal/no Ct (#).

References

    1. Agrawal S., Orschler L., Lackner S. (2021). Metatranscriptomic analysis reveals SARS-CoV-2 mutations in wastewater of the frankfurt metropolitan area in southern Germany. Microbiol. Resour. Announc. 10:e00280–21. 10.1128/MRA.00280-21 - DOI - PMC - PubMed
    1. Ahmed W., Angel N., Edson J., Bibby K., Bivins A., O’Brien J. W., et al. (2020). First confirmed detection of SARS-CoV-2 in untreated wastewater in Australia: a proof of concept for the wastewater surveillance of COVID-19 in the community. Sci. Total Environ. 728:138764. 10.1016/j.scitotenv.2020.138764 - DOI - PMC - PubMed
    1. Ahmed W., Bivins A., Smith W. J. M., Metcalfe S., Stephens M., Jennison A. V., et al. (2022). Detection of the Omicron (B.1.1.529) variant of SARS-CoV-2 in aircraft wastewater. Sci. Total Environ. 820:153171. 10.1016/j.scitotenv.2022.153171 - DOI - PMC - PubMed
    1. Ai Y., Davis A., Jones D., Lemeshow S., Tu H., He F., et al. (2021). Wastewater SARS-CoV-2 monitoring as a community-level COVID-19 trend tracker and variants in ohio, united states. Sci. Total Environ. 801:149757. 10.1016/j.scitotenv.2021.149757 - DOI - PMC - PubMed
    1. Alamin M., Tsuji S., Hata A., Hara-Yamamura H., Honda R. (2022). Selection of surrogate viruses for process control in detection of SARS-CoV-2 in wastewater. Sci. Total Environ. 823:153737. 10.1016/j.scitotenv.2022.153737 - DOI - PMC - PubMed