. 2022 Jun 10:13:851969.
doi: 10.3389/fmicb.2022.851969. eCollection 2022.

Metagenomic Screening for Lipolytic Genes Reveals an Ecology-Clustered Distribution Pattern

Affiliations

Metagenomic Screening for Lipolytic Genes Reveals an Ecology-Clustered Distribution Pattern

Mingji Lu et al. Front Microbiol. .

Abstract

Lipolytic enzymes are one of the most important enzyme types for application in various industrial processes. Despite the continuously increasing demand, only a small portion of the so far encountered lipolytic enzymes exhibit adequate stability and activities for biotechnological applications. To explore novel and/or extremophilic lipolytic enzymes, microbial consortia in two composts at thermophilic stage were analyzed using function-driven and sequence-based metagenomic approaches. Analysis of community composition by amplicon-based 16S rRNA genes and transcripts, and direct metagenome sequencing revealed that the communities of the compost samples were dominated by members of the phyla Actinobacteria, Proteobacteria, Firmicutes, Bacteroidetes, and Chloroflexi. Function-driven screening of the metagenomic libraries constructed from the two samples yielded 115 unique lipolytic enzymes. The family assignment of these enzymes was conducted by analyzing the phylogenetic relationship and generation of a protein sequence similarity network according to an integrated classification system. The sequence-based screening was performed by using a newly developed database, containing a set of profile Hidden Markov models, highly sensitive and specific for detection of lipolytic enzymes. By comparing the lipolytic enzymes identified through both approaches, we demonstrated that the activity-directed complements sequence-based detection, and vice versa. The sequence-based comparative analysis of lipolytic genes regarding diversity, function and taxonomic origin derived from 175 metagenomes indicated significant differences between habitats. Analysis of the prevalent and distinct microbial groups providing the lipolytic genes revealed characteristic patterns and groups driven by ecological factors. The here presented data suggests that the diversity and distribution of lipolytic genes in metagenomes of various habitats are largely constrained by ecological factors.

Keywords: comparative analysis; compost; function-driven metagenomics; lipolytic enzyme classification; lipolytic enzymes; profile HMM; sequence-based metagenomics.


Conflict of interest statement

The authors declare that the research was conducted in the absence of any commercial or financial relationships that could be construed as a potential conflict of interest.

Figures

FIGURE 1
FIGURE 1
Classification of LEs identified through the function-driven approach. (A) Scheme of a phylogenetic tree. The unrooted phylogenetic tree was constructed using FA-identified LEs in this study obtained and references retrieved from GenBank (Supplementary Table 2). Phylogenetic tree was constructed using MEGA 7 with neighbor-joining method. The robustness of the tree was tested by bootstrap analysis with 500 replications. Inner tree: the circles represent LEs detected in compost55 (blue) and compost76 (red), sized by abundance (counts of replicates). LEs assigned to families of I-XIX were shaded in green background. Patatin-like-proteins and tannases (designated as P and T, respectively) were shaded in yellow. Other recent reported lipolytic families were shaded in magenta: 1, Est22 (Li et al., 2017); 2, EstL28 (Seo et al., 2014); 3, Rv0045c (Guo et al., 2010); 4, EstGX1 (Jiménez et al., 2012); 5, EstLiu (Rahman et al., 2016); 6, EstY (Wu and Sun, 2009); 7, EstGS (Nacke et al., 2011); 8, EM3L4 (Jeon et al., 2011b); 9, FLS18 (Hu Y. et al., 2010); 10, Est903 (Jia et al., 2019); 11, EstJ (Choi et al., 2013); 12, PE10 (Jiang et al., 2012); 13, Est12 (Wu et al., 2013); 14, EstDZ2 (Zarafeta et al., 2016); 15, Est9x (Jeon et al., 2009); 16, Lip10 (Guo et al., 2016); 17, EstGH (Nacke et al., 2011); 18, EML1 (Jeon et al., 2009); 19, FnL (Yu et al., 2010); 20, EstP2K (Ouyang et al., 2013); 21, LipA (Couto et al., 2010); 22, LipSM54 (Li et al., 2016); 23, MtEst45 (Lee, 2016); 24, LipT (Chow et al., 2012); 25, EstSt7 (Wei et al., 2013); 26, Rlip1 (Liu et al., 2009); 27, EstA (Chu et al., 2008); 28, FLS12 (Hu Y. et al., 2010); 29, lp_3505 (Esteban-Torres et al., 2014). Outer ring: substrate specificity of corresponding clones toward different carbon chain length (C4–C14) of triglycerides. (B) Protein sequence similarity network of LEs belonging to different families. Networks were generated from all-by-all BLAST comparisons of amino acid sequences from the same dataset used for the construction of the phylogenetic tree. Each node represents a sequence. Larger square nodes represent LEs derived from function-based screening performed in this study. Small circle nodes represent LEs retrieved from GenBank. Nodes were arranged using the yFiles organic layout provided in Cytoscape version 3.4.0. Each edge in the network represents a BLAST connection with an E-value cutoff of ≤1e–16. At this cut-off, sequences have a mean percent identity and alignment length of 36.3% and 273 amino acids, respectively.
FIGURE 2
FIGURE 2
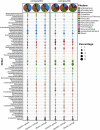
Phylogenetic distribution of assigned PLP-encoding genes identified in compost55 and compost76 metagenomes. The phylogenetic origin of PLP-encoding genes, the contigs harboring these genes, and the whole assembled contigs were annotated by Kaiju (Menzel et al., 2016), and expressed as the proportion of the respective total counts in each sample. The pie charts represent the taxonomic composition at phylum level. Taxa with an abundance of less than 1% were grouped into “others.”
FIGURE 3
FIGURE 3
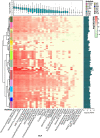
Lipolytic family profile of assigned PLPs across samples. Hierarchical clustering analysis of the lipolytic family profile in each sample was performed using the Ward.D clustering method and Bray-Curtis distance matrices. LPGM values were log10 transformed. The color intensity of the heat map (light green to red) indicates the change of LPGM values (low to high). The habitats are depicted by different colors. The lipolytic family profile in each sample was generally clustered by habitat (overall R value = 0.621, P < 0.001, ANOSIM test). The boxplot (top) represents the distribution of the assigned PLPs in each ELF across samples. Mean values (n = 175 samples) are given. The bar plot (right) shows the total abundance of assigned PLPs by summing up the abundance in each family of each sample. Abbreviations of habitats: ADAS, anaerobic digestor active sludge; AS, agricultural soil; COM, compost; GS, grassland soil; HG, human gut; HM, hypersaline mat; HRE, hydrocarbon resource environment; HS, hot spring; LL, landfill leachate; MS, marine sediment; MW, marine water; OR, oil reservoir; RW, river water; TFS, tropical forest soil; WB, wastewater bioreactor; ELF, ESTHER lipolytic family.
FIGURE 4
FIGURE 4
Taxonomic distribution of assigned PLPs. Taxonomic distributions of assigned PLPs in abundant bacterial phyla possessing PLP-encoding genes across all the samples. The abundance inferred from LPGM values matrix of assigned PLPs per family identified in each bacterial phylum was generated by summing the corresponding LPGM values across all samples. The width of each seperated sector from each bacterial phylum (A-J) and lipolytic family (1–21) indicates their relative abundances across all samples. The corresponding colors were shown in the third ring (from outside in). In the outermost ring, sectors A–J indicate the distribution of lipolytic families in each bacterial phylum. This is also the case for bacterial phyla in each lipplytic family of sectors 1–21. A, Acidobacteria; B, Actinobacteria; C, Bacteroidetes; D, Chloroflexi; E, Cyanobacteria; F, Deinococcus-Thermus; G, Firmicutes; H, Planctomycetes; I, Proteobacteria; J, Verrucomicrobia; 1, Hormone-sensitive_lipase_like; 2, patatin-like-protein; 3, A85-EsteraseD-FGH; 4, Bacterial_lip_FamI.1; 5, VIII; 6, Homoserine_transacetylase; 7, II; 8, Lipase_3; 9, A85-Feruloyl-Esterase; 10, ABHD6-Lip; 11, Carb_B_Bacteria; 12, Bacterial_lip_FamI.3; 13, Lysophospholipase_carboxylesterase; 14, Carboxymethylbutenolide_lactonase; 15, CarbLipBact_2; 16, Chlorophyllase; 17, Tannase; 18, Polyesterase-lipase-cutinase; 19, Duf_3089; 20, Fungal_Bact_LIP; 21, Lipase_2. Only phyla and lipolytic families with a relative abundance >0.5% are shown.
FIGURE 5
FIGURE 5
Association networks between bacterial origin of assigned PLPs at genus level and habitats. The abundance of PLPs in each genus per sample was presented by LPGM values, and only genera with mean LPGM values of ≥0.5 across all the samples were used. Source nodes (rounded squares) represent habitats, target node represent bacterial genera (circles, diamonds, and triangles), and edges represent associations between habitats and bacterial genera. Target node size represent its mean abundance inferred from LPGM values across habitats. Target node is colored according to its phylogenetic origin at phylum level. The length of edges is weighted according to association strength. Unique clusters, which associate with only one habitat, consist of nodes shaped as diamond. Triangle and circle nodes represent genera with significant cross association between two and more habitats, respectively. Data only represents genera that showed significant positive association with habitats (P = 0.05). For ease of visualization, edges were bundled together, with a stress value of 3. Abbreviations of habitats: ADAS, anaerobic digestor active sludge; AS, agricultural soil; COM, compost; GS, grassland soil; HG, human gut; HM, hypersaline mat; HRE, hydrocarbon resource environment; HS, hot spring; LL, landfill leachate; MS, marine sediment; MW, marine water; OR, oil reservoir; RW, river water; TFS, tropical forest soil; WB, wastewater bioreactor; ELF, ESTHER lipolytic family.

Similar articles

Cited by

References

    1. Akmoussi-Toumi S., Khemili-Talbi S., Ferioune I., Kebbouche-Gana S. (2018). Purification and characterization of an organic solvent-tolerant and detergent-stable lipase from Haloferax mediterranei CNCMM 50101. Int. J. Biol. Macromol. 116 817–830. 10.1016/j.ijbiomac.2018.05.087 - DOI - PubMed
    1. Akoh C. C., Lee G. C., Liaw Y. C., Huang T. H., Shaw J. F. (2004). GDSL family of serine esterases/lipases. Prog. Lipid Res. 43 534–552. 10.1016/j.plipres.2004.09.002 - DOI - PubMed
    1. Alisch M., Feuerhack A., Müller H., Mensak B., Andreaus J., Zimmermann W. (2004). Biocatalytic modification of polyethylene terephthalate fibres by esterases from actinomycete isolates. Biocatal. Biotransform. 22 347–351. 10.1080/10242420400025877 - DOI
    1. Altschul S. F., Gish W., Miller W., Myers E. W., Lipman D. J. (1990). Basic local alignment search tool. J. Mol. Biol. 215 403–410. 10.1016/S0022-2836(05)80360-2 - DOI - PubMed
    1. Andrews S. (2010). FastQC: A Quality Control Tool for High Throughput Sequence Data. Available online at: http://www.bioinformatics.babraham.ac.uk/projects/fastqc/

LinkOut - more resources