

A Regional Pooling Intervention in a High-Throughput COVID-19 Diagnostic Laboratory to Enhance Throughput, Save Resources and Time Over a Period of 6 Months
- PMID: 35756046
- PMCID: PMC9218601
- DOI: 10.3389/fmicb.2022.858555
A Regional Pooling Intervention in a High-Throughput COVID-19 Diagnostic Laboratory to Enhance Throughput, Save Resources and Time Over a Period of 6 Months
Abstract
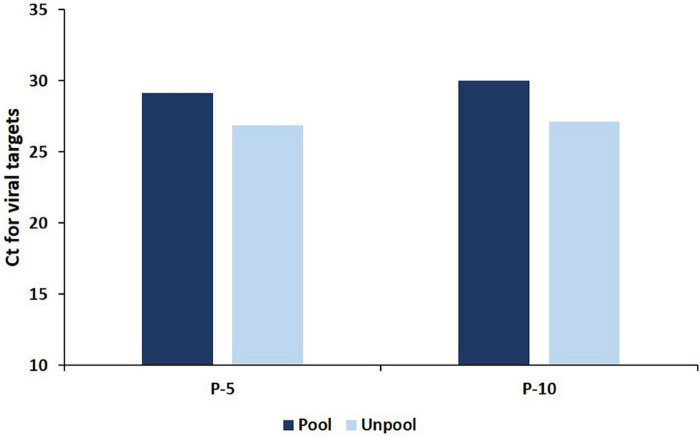
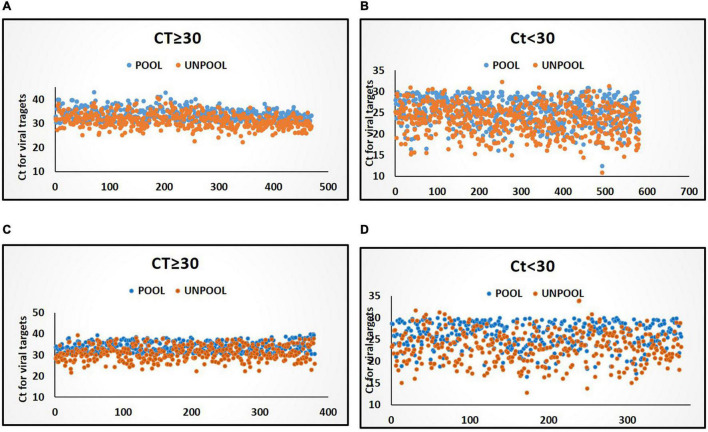
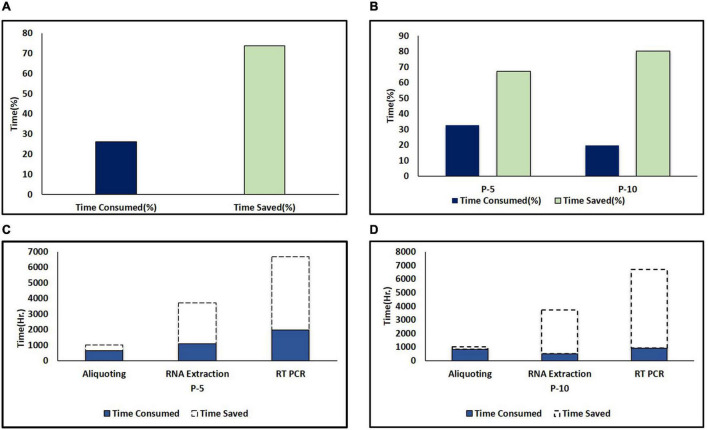
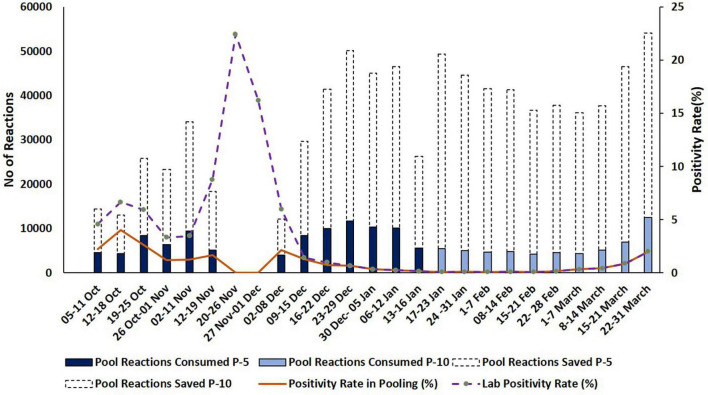
An effective and rapid diagnosis has great importance in tackling the ongoing COVID-19 pandemic through isolation of the infected individuals to curb the transmission and initiation of specialized treatment for the disease. It has been proven that enhanced testing capacities contribute to efficiently curbing SARS-CoV-2 transmission during the initial phases of the outbreaks. RT-qPCR is considered a gold standard for the diagnosis of COVID-19. However, in resource-limited countries expenses for molecular diagnosis limits the diagnostic capacities. Here, we present interventions of two pooling strategies as 5 sample pooling (P-5) and 10 sample pooling (P-10) in a high-throughput COVID-19 diagnostic laboratory to enhance throughput and save resources and time over a period of 6 months. The diagnostic capacity was scaled-up 2.15-folds in P-5 and 1.8-fold in P-10, reagents (toward RNA extraction and RT-qPCR) were preserved at 75.24% in P-5 and 86.21% in P-10, and time saved was 6,290.93 h in P-5 and 3147.3 h in P-10.
Keywords: COVID-19; RT-qPCR–real-time quantitative polymerase chain reaction; SARS-CoV-2; high-throughput diagnosis; pooling interventions.
Copyright © 2022 Mandhan, Sharma, Pandey, Chandel, Chourasia, Moun, Sharma, Sukar, Singh, Mathur, Kotnala, Negi, Gupta, Kumar, Suresh Kumar, Kumar and Singh.
Conflict of interest statement
The authors declare that the research was conducted in the absence of any commercial or financial relationships that could be construed as a potential conflict of interest.
Figures
Similar articles
-
COVID-19 Sample Pooling: From RNA Extraction to Quantitative Real-time RT-PCR.Bio Protoc. 2021 May 5;11(9):e4005. doi: 10.21769/BioProtoc.4005. eCollection 2021 May 5. Bio Protoc. 2021. PMID: 34124305 Free PMC article.
-
Comparing two sample pooling strategies for SARS-CoV-2 RNA detection for efficient screening of COVID-19.J Med Virol. 2021 May;93(5):2805-2809. doi: 10.1002/jmv.26632. Epub 2021 Mar 11. J Med Virol. 2021. PMID: 33107614
-
Detection of SARS-CoV-2 RNA in Upper Respiratory Swap Samples by Pooling Method.Balkan Med J. 2022 Jan 25;39(1):48-54. doi: 10.5152/balkanmedj.2021.21135. Epub 2021 Dec 20. Balkan Med J. 2022. PMID: 34928231 Free PMC article.
-
High-throughput and automated screening for COVID-19.Front Med Technol. 2022 Sep 15;4:969203. doi: 10.3389/fmedt.2022.969203. eCollection 2022. Front Med Technol. 2022. PMID: 36188187 Free PMC article. Review.
-
Etablierung der PCR-basierten SARS-CoV-2-Testung im Hochdurchsatz.Biospektrum (Heidelb). 2020;26(5):500-503. doi: 10.1007/s12268-020-1431-1. Epub 2020 Sep 5. Biospektrum (Heidelb). 2020. PMID: 32921925 Free PMC article. Review. German.
Cited by
-
Genome sequencing of SARS-CoV-2 omicron variants in Delhi reveals alterations in immunogenic regions in spike glycoprotein.Front Immunol. 2023 Oct 2;14:1209513. doi: 10.3389/fimmu.2023.1209513. eCollection 2023. Front Immunol. 2023. PMID: 37849762 Free PMC article.
-
Improving the detection capability and efficiency of SARS-CoV-2 RNA specimens by the specimen turn-around process with multi-department cooperation.Front Public Health. 2024 Jan 5;11:1294341. doi: 10.3389/fpubh.2023.1294341. eCollection 2023. Front Public Health. 2024. PMID: 38249400 Free PMC article.
References
LinkOut - more resources
Full Text Sources
Miscellaneous