. 2022 Jun 9:16:886925.
doi: 10.3389/fnana.2022.886925. eCollection 2022.

The Connectome and Chemo-Connectome Databases for Mice Brain Connection Analysis

Affiliations

The Connectome and Chemo-Connectome Databases for Mice Brain Connection Analysis

Yang Wang et al. Front Neuroanat. .

Abstract

The various brain functions rely on the intricate connection networks and certain molecular characteristics of neurons in the brain. However, the databases for the mouse brain connectome and chemo-connectome are still inadequate, hindering the brain circuital and functional analysis. Here, we created mice brain connectome and chemo-connectome databases based on mouse brain projection data of 295 non-overlapping brain areas and in situ hybridization (ISH) data of 50 representative neurotransmission-related genes from the Allen Brain Institute. Based on this connectome and chemo-connectome databases, functional connection patterns and detailed chemo-connectome for monoaminergic nuclei were analyzed and visualized. These databases will aid in the comprehensive research of the mouse connectome and chemo-connectome in the whole brain and serve as a convenient resource for systematic analysis of the brain connection and function.

Keywords: chemo-connectome; connectome; database; mesoscale connection; monoaminergic nuclei.


Conflict of interest statement

The authors declare that the research was conducted in the absence of any commercial or financial relationships that could be construed as a potential conflict of interest.

Figures

FIGURE 1
FIGURE 1
The database processing flow for connectome and chemo-connectome. (A) Data processing flowchart for creating connectome and chemo-connectome databases. (B) Heatmap of the whole-brain connectivity at mesoscale level. The full names of abbreviations for all the source and target areas are listed in Supplementary Table 6. (C) Diagram of the ISH data processing. ISH, in situ hybridization; CCF, common coordinate framework.
FIGURE 2
FIGURE 2
Visualization of the connection network in mice brain. (A) The top 2,000 three-dimensional (3D) connection network. (B) The top 50 connection networks. (C,D) The input and output 3D connection networks of auditory nuclei. (E,F) The input and output 3D connection networks of olfactory nuclei. The arrows between the nuclei represent the projection direction, and the width of the line represents the projection intensity. Red circles and stars respectively represent the source and target nuclei in the auditory and olfactory networks.
FIGURE 3
FIGURE 3
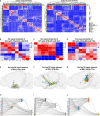
The results of connection similarity processing. (A) Heatmaps for input and output similarity clusters of mice whole brain. (B–D) Heatmaps of the input similarity nuclei. (E–G) The 3D network of input similarity nuclei in panels (B–D). (H–J) The Sankey diagram of input similarity nuclei in panels (B–D).
FIGURE 4
FIGURE 4
Overall view of the chemo-connectome database. (A) Heatmap of the chemo-connectome database. (B,C) Circos diagram of neurotransmission- related gene expression in dorsal raphe (DR) and locus coeruleus (LC). The color represents the expression density.
FIGURE 5
FIGURE 5
Chemo-connectome of monoaminergic nuclei. (A) The expression heatmap of monoaminergic neurotransmission-related genes in mice whole brain. (B) The connectivity network and gene expression of monoaminergic nuclei were integrated to generate chemo-connection network. Arrows between the nuclei represent the projection direction, and the width of the line represents the projection intensity. The color in the circos diagram represents the expression density.

References

    1. Beier K. T., Steinberg E. E., DeLoach K. E., Xie S., Miyamichi K., Schwarz L., et al. (2015). Circuit architecture of VTA dopamine neurons revealed by systematic input-output mapping. Cell 162 622–634. 10.1016/j.cell.2015.07.015 - DOI - PMC - PubMed
    1. Butler A. B., Hodos W. (2005). Comparative Vertebrate Neuroanatomy: Evolution and Adaptation, Second Edn. Hoboken, NJ: Wiley.
    1. Calabresi P., Picconi B., Tozzi A., Ghiglieri V., Di Filippo M. (2014). Direct and indirect pathways of basal ganglia: a critical reappraisal. Nat. Neurosci. 17 1022–1030. 10.1038/nn.3743 - DOI - PubMed
    1. Chen S., Liu Z., Li A., Gong H., Long B., Li X. (2021). High-throughput strategy for profiling sequential section with multiplex staining of mouse brain. Front. Neuroanat. 15:771229. 10.3389/fnana.2021.771229 - DOI - PMC - PubMed
    1. Cook S. J., Jarrell T. A., Brittin C. A., Wang Y., Bloniarz A. E., Yakovlev M. A., et al. (2019). Whole-animal connectomes of both Caenorhabditis elegans sexes. Nature 571 63–71. 10.1038/s41586-019-1352-7 - DOI - PMC - PubMed

LinkOut - more resources