. 2022 Jun 12:15:100317.
doi: 10.1016/j.mtbio.2022.100317. eCollection 2022 Jun.

Imaging of fluorescent polymer dots in relation to channels and immune cells in the lymphatic system

Affiliations

Imaging of fluorescent polymer dots in relation to channels and immune cells in the lymphatic system

Yufan Zhang et al. Mater Today Bio. .

Abstract

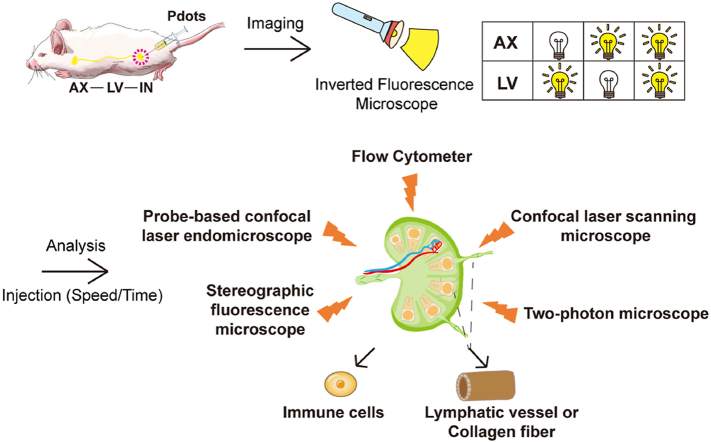
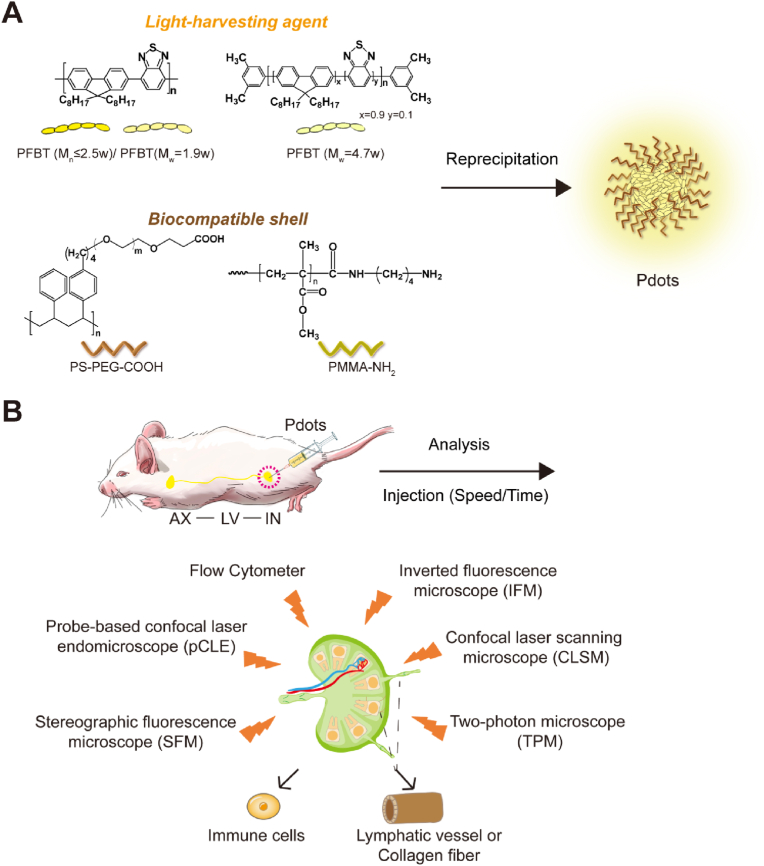
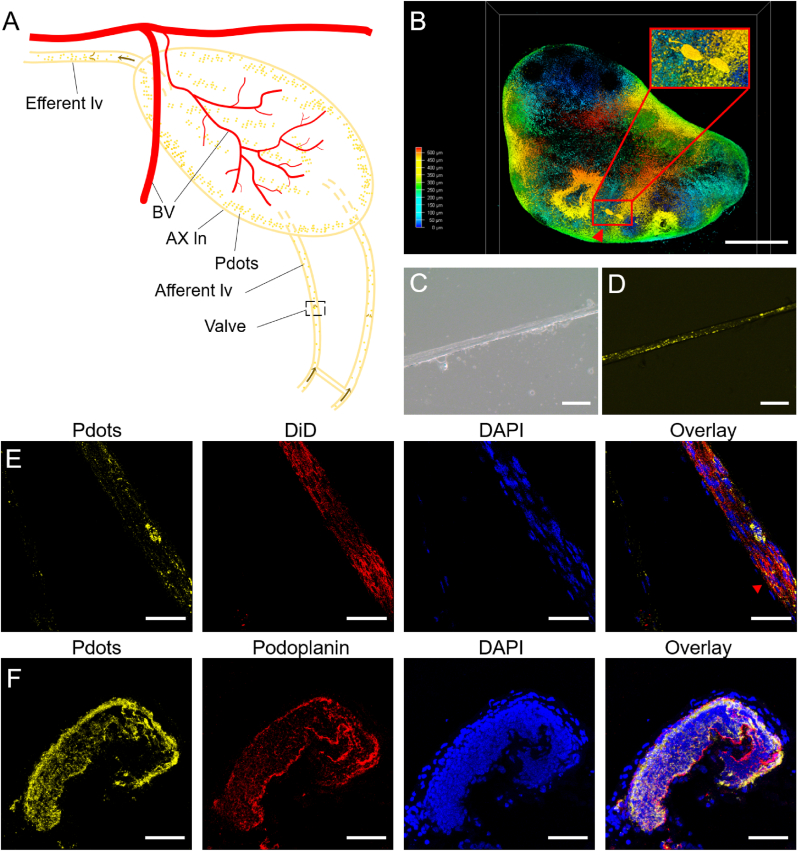
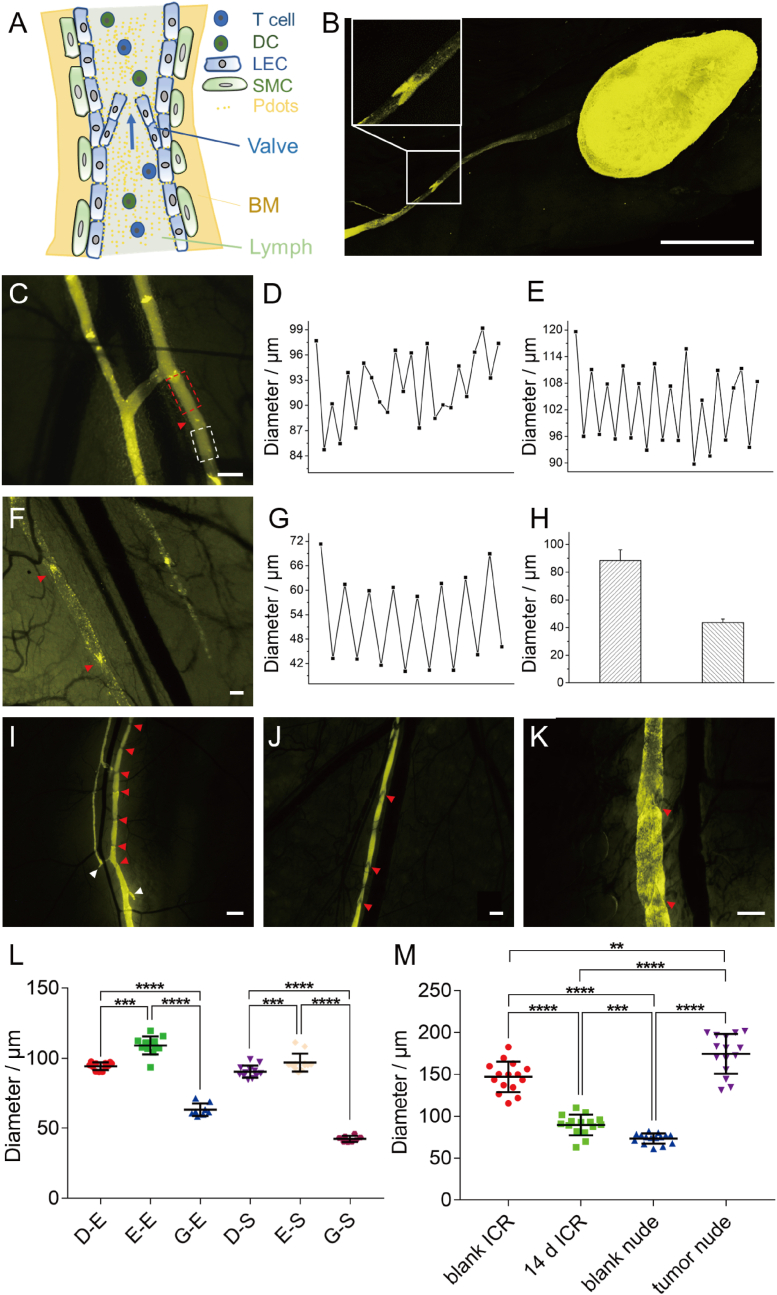
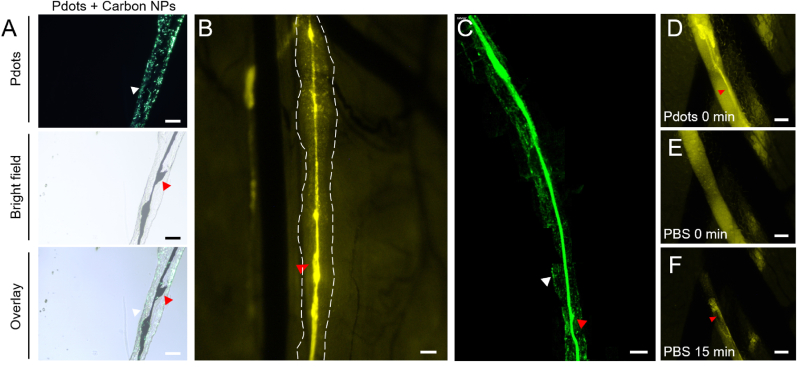
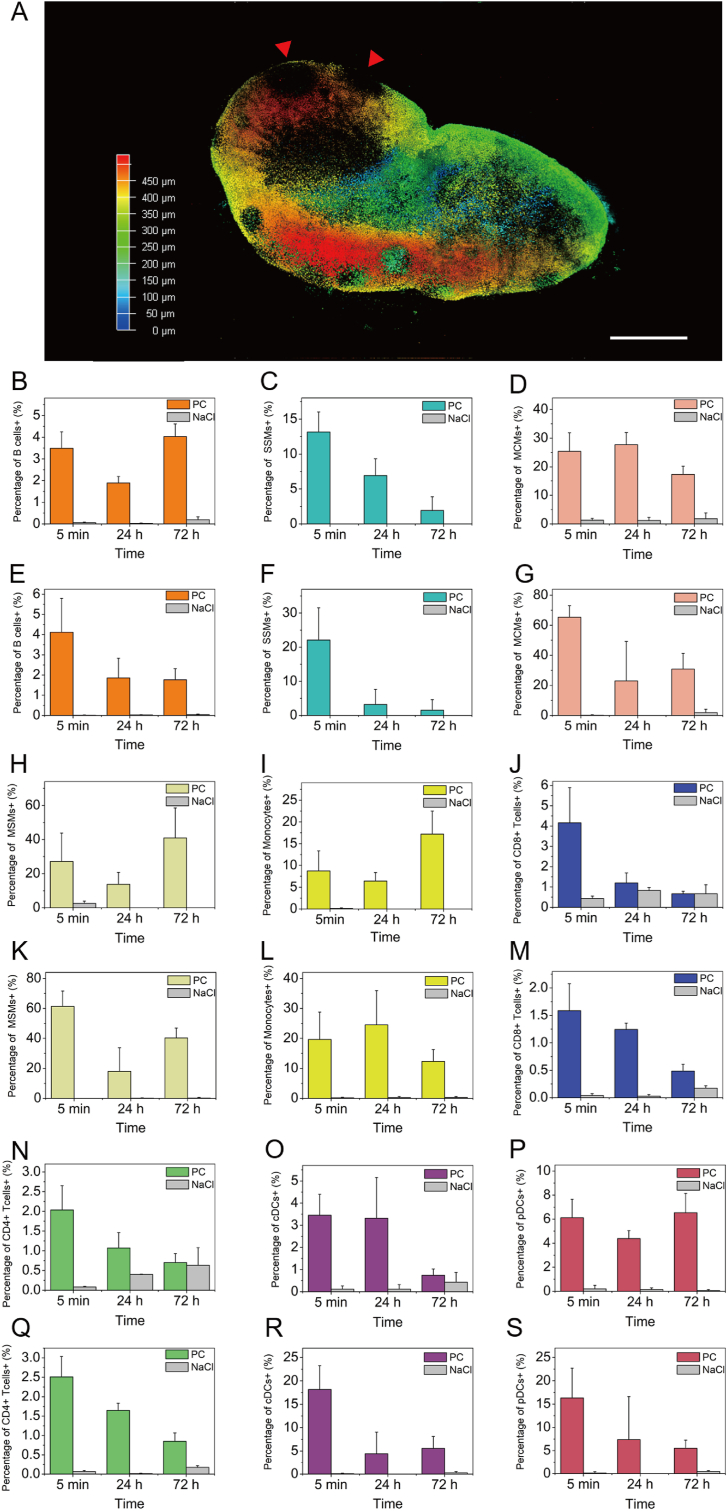
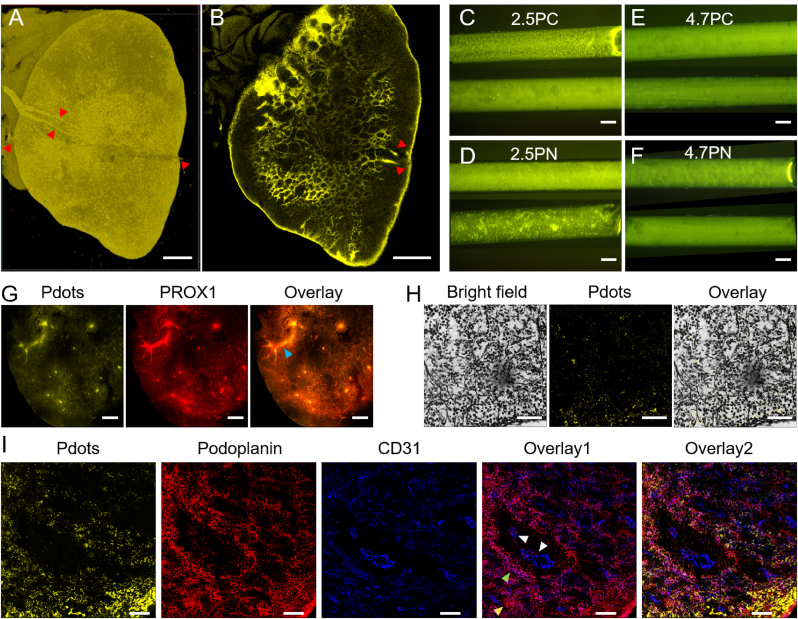
Polymer dots (Pdots) have been applied to imaging lymph nodes (LNs) and lymphatic vessels (LVs) in living mice and rats. However, the mechanism of absorption, distribution, metabolism, and excretion of Pdots in LNs and LVs is still unclear. Therefore, the relationship between Pdots and immune cells, LVs and collagen fibers in lymphatics was studied by multiple in vivo and ex vivo microscopic imaging methods and detection techniques. Flow cytometry showed that Pdots could be phagocytosed by macrophages and monocytes, and had no relationship with B cells, T cells and dendric cells in LNs. Silver staining, immunofluorescence and two-photon microscope showed that Pdots gathered in collagen fibers and LVs of LNs. Furthermore, immunofluorescence imaging results verified that Pdots were distributed in the extracellular space of collecting LVs endothelial cells. In addition, Pdots in the collecting LVs were basically cleared by leaking into the surrounding tissue or draining LNs after 21 days of injection. During the long-time observation, Pdots also helped monitor the contraction frequency and variation range of LV. Our study lays a foundation on the research of Pdots as the carrier to study lymphatic structure and function in the future.

Keywords: Collagen fibers; Immune cells; Lymphatic system; Lymphatic vessels; Polymer dots.


Conflict of interest statement

The authors declare that they have no known competing financial interests or personal relationships that could have appeared to influence the work reported in this paper.

Figures

Image 1
Graphical abstract
Scheme 1
Scheme 1
A) Chemical structures of PFBT (Mn ​< ​25000), PFBT (Mn ​= ​19000), PFBT (Mn ​= ​47000), PS-PEG-COOH, and PMMA-NH2, and the reprecipitation of polymer dots (Pdots). Pdots are prepared via one of light-harvesting agents and one of biocompatible shells. B) The schematic depicted the selection, and lymphatic imaging of Pdots. The relationship between Pdots and immune cells or channels in the LNs and LVs was studied by using multiple imaging microscopy, including inverted fluorescence microscope (IFM), probe-based confocal laser endomicroscope (pCLE), stereographic fluorescence microscope (SFM), confocal laser scanning microscope (CLSM), two-photon microscope (TPM), and flow cytometer.
Fig. 1
Fig. 1
The imaging of lymphatic system injected via Pdots. A) The simple drawing of axillary lymph node (LN) connected with afferent and efferent lymphatic vessels (LVs) imaged by Pdots. B) The TPM image of axillary LN and connected afferent LV which red triangle points at. The red box represents the magnified connected afferent LV. C-D) The brightfield and fluorescence channel of stripped collecting LV were taken by SFM ex vivo. E) The CLSM imaging of the whole collecting LV includes Pdots channel, DiD cytomembrane channel, DAPI cytoblast channel, overlap channel. F) The CLSM imaging of the collecting LV frozen section includes Pdots channel, Podoplanin LV channel, DAPI cytoblast channel, and overlap channel. Red triangles point at the connected LV in B and the Pdots aggregation sites in E. Scale bars represent 500 ​μm in B, 100 ​μm in C-D, and 50 ​μm in E-F, respectively. (For interpretation of the references to color in this figure legend, the reader is referred to the Web version of this article.)
Fig. 2
Fig. 2
The observation of lymphatic valves and changes in LVs. A) The schematic diagram of collecting LV including lymphatic valve imaged by Pdots. B) The 3D picture of lymphatic valve, collecting LV and LN imaged by Pdots. The white box represents magnified lymphatic valve. C) The screenshot of the contraction and relaxation in collecting LV imaged via SFM after injection of Pdots. D-E) The different diameters change line charts of the collecting LV labelled by the red and white dashed box in B. F) The SFM image of LV at 14 ​d post-injection of Pdots. G) The different diameters change line charts of the collecting LV 7 ​d post-injection of Pdots in Figure S5C. H) The diameter of the LV 28 ​d post-injection of Pdots in Figure S5E and F. I) The branches and lymphatic valves of lv 5 ​min post-injection. J-K) The lymphatic valves of lv 5 ​min post-injection in nude mouse and tumor mouse, respectively. L) The comparison between diameters of expansion and shrinkage in lymphatic vessels is shown as mean ​± ​SD from 5 ​min in D and E and 7 ​d in G after injection of Pdots. D-E, E-E and G-E represent the diameter measurement of every expansion in D, E and G, respectively. D-S, E-S and G-S represent the diameter measurement of every shrinkage in D, E and G, respectively. M) The diameter comparison of LV among 4 min-imaging of blank 3-week-year-old ICR mouse in I, 14 d-imaging of ICR mouse in F, blank nude mouse in J and tumor mouse in K is shown as mean ​± ​SD. Red triangles point at lymphatic valves, and white triangles point at the branches of LV. ∗∗∗P ​< ​0.001. Scale bars represent 2 ​mm in B, 100 ​μm in C and F, 500 ​μm in I, and 200 ​μm in J and K, respectively. (For interpretation of the references to color in this figure legend, the reader is referred to the Web version of this article.)
Fig. 3
Fig. 3
The observation of PV inside the LV. A) Two channels including Pdots channel and Carbon NPs channel drew the outline of LV and PV imaged by IFM. B–C) The SFM and pCLE images of PV in the collecting LV. D-F) The changes of PV in the collecting LV were imaged immediately after injection of Pdots, and 0 ​min and 15 ​min after injection of PBS via SFM. Red triangles point at PV inside the LV, and white triangles point at the outer LV. Scale bars represent 100 ​μm. (For interpretation of the references to color in this figure legend, the reader is referred to the Web version of this article.)
Fig. 4
Fig. 4
The relationship verification between Pdots and immune cells in LN via imaging and flow cytometry database. A) The 3D TPM image of axillary LN with the injection of 15 ​μL Pdots in 1 ​min after 24 ​h. B–I, K-L) The relevance between Pdots and four kinds of cells as B cells, SSMs, MCMs, MSMs and monocytes at different time points of 5 ​min, 24 ​h and 72 ​h. The experimental and control groups are based on two rates of 3 ​s and 1 ​min injected via Pdots and normal saline solution, respectively. J, M ​− ​S) The relevance between Pdots and CD4+/CD8+ T cells or pDCs and cDCs. Red triangles point at B cell zone. The injection time is 1 ​min in B-D, H-J and N–P, and the injection time is 3 ​s in E-G, K-M and Q-S. Scale bar represents 500 ​μm in A. (For interpretation of the references to color in this figure legend, the reader is referred to the Web version of this article.)
Fig. 5
Fig. 5
The relationship verification between Pdots and channels in LN. A-B) The TPM 3D image and single picture of axillary LN includes four vessels pointed by red triangles. C–F) The penetration of Pdots in collagen hydrogels including 2.5 ​PC, 2.5 ​PN, 4.7 ​PC and 4.7 ​PN was imaged by IFM in vitro. The top row represents empty capillary tubes, and the bottom row represents capillary tubes filled with collagen hydrogels. G) The transparent axillary LN includes Pdots channel, PROX1 channel and overlay channel was imaged via FCFM. H) The relationship between Pdots and collagen fibers was imaged via silver staining. I) The axillary LN frozen sections include Pdots channel, podoplanin channel, CD31 channel and two overlay channels were imaged via FCFM. Overlay1 includes podoplanin channel and CD31 channel. Overlay2 includes Pdots channel, podoplanin channel and CD31 channel. Red triangles point at the connected LV of axillary LN in A and B. Blue triangles point at the large LV containing yellow Pdots signals in G. White triangles point at blue blood endothelial cells, green triangles point at purple lymphatic endothelial cells, and yellow triangles point at red fibroblast reticular cells in I. Scale bars represent 500 ​μm in A-B, 100 ​μm in C–F, 200 ​μm in G, and 50 ​μm in H and I, respectively. (For interpretation of the references to color in this figure legend, the reader is referred to the Web version of this article.)

Similar articles

Cited by

References

    1. Hu D., Li L., Li S., Wu M., Ge N., Cui Y., Lian Z., Song J., Chen H. Lymphatic system identification, pathophysiology and therapy in the cardiovascular diseases. J. Mol. Cell. Cardiol. 2019;133:99–111. doi: 10.1016/j.yjmcc.2019.06.002. - DOI - PubMed
    1. Xiong L., Engel H., Gazyakan E., Rahimi M., Hünerbein M., Sun J., Kneser U., Hirche C. Current techniques for lymphatic imaging: state of the art and future perspectives. Eur. J. Surg. Oncol. 2014;40(3):270–276. doi: 10.1016/j.ejso.2013.11.027. - DOI - PubMed
    1. Munn L.L., Padera T.P. Imaging the lymphatic system. Microvasc. Res. 2014;96:55–63. doi: 10.1016/j.mvr.2014.06.006. - DOI - PMC - PubMed
    1. Chong C., Scholkmann F., Bachmann S.B., Luciani P., Leroux J.C., Detmar M., Proulx S.T. In vivo visualization and quantification of collecting lymphatic vessel contractility using near-infrared imaging. Sci. Rep. 2016;6 doi: 10.1038/srep22930. - DOI - PMC - PubMed
    1. Schineis P., Runge P., Halin C. Cellular traffic through afferent lymphatic vessels. Vasc. Pharmacol. 2019;112:31–41. doi: 10.1016/j.vph.2018.08.001. - DOI - PubMed

LinkOut - more resources