. 2022 Jun 20:10:e13512.
doi: 10.7717/peerj.13512. eCollection 2022.

The influence of a manipulation of threat on experimentally-induced secondary hyperalgesia

Affiliations

The influence of a manipulation of threat on experimentally-induced secondary hyperalgesia

Gillian J Bedwell et al. PeerJ. .

Abstract

Pain is thought to be influenced by the threat value of the particular context in which it occurs. However, the mechanisms by which a threat achieves this influence on pain are unclear. Here, we explore how threat influences experimentally-induced secondary hyperalgesia, which is thought to be a manifestation of central sensitization. We developed an experimental study to investigate the effect of a manipulation of threat on experimentally-induced secondary hyperalgesia in 26 healthy human adults (16 identifying as female; 10 as male). We induced secondary hyperalgesia at both forearms using high-frequency electrical stimulation. Prior to the induction, we used a previously successful method to manipulate threat of tissue damage at one forearm (threat site). The effect of the threat manipulation was determined by comparing participant-rated anxiety, perceived threat, and pain during the experimental induction of secondary hyperalgesia, between the threat and control sites. We hypothesized that the threat site would show greater secondary hyperalgesia (primary outcome) and greater surface area (secondary outcome) of induced secondary hyperalgesia than the control site. Despite a thorough piloting procedure to test the threat manipulation, our data showed no main effect of site on pain, anxiety, or threat ratings during high-frequency electrical stimulation. In the light of no difference in threat between sites, the primary and secondary hypotheses cannot be tested. We discuss reasons why we were unable to replicate the efficacy of this established threat manipulation in our sample, including: (1) competition between threats, (2) generalization of learned threat value, (3) safety cues, (4) trust, and requirements for participant safety, (5) sampling bias, (6) sample-specific habituation to threat, and (7) implausibility of (sham) skin examination and report. Better strategies to manipulate threat are required for further research on the mechanisms by which threat influences pain.

Keywords: Electrical stimulation; Healthy volunteers; Mechanical hyperalgesia; Pain; Secondary hyperalgesia; Threat.


Conflict of interest statement

Gillian J. Bedwell receives speakers’ fees for talks on pain and rehabilitation. Victoria J. Madden receives speakers’ fees for talks on pain and rehabilitation. Romy Parker receives speakers’ fees for talks on pain and rehabilitation, is a director of the not for profit organization Train Pain Academy, and serves as a councilor for the International Association for the Study of Pain. G. Lorimer Moseley has received support from: Reality Health, ConnectHealth UK, Seqirus, Kaiser Permanente, Workers’ Compensation Boards in Australia, Europe and North America, AIA Australia, the International Olympic Committee, Port Adelaide Football Club, Arsenal Football Club. Professional and scientific bodies have reimbursed him for travel costs related to presentation of research on pain at scientific conferences/symposia. He has received speaker fees for lectures on pain and rehabilitation. He receives book royalties from NOI group publications, Dancing Giraffe Press & OPTP for books on pain and rehabilitation. Caron Louw and Johan W. Vlaeyen have no conflicts of interest to declare. G. Lorimer Moseley is an Academic Editor for PeerJ.

Figures

Figure 1
Figure 1. Study procedure.
Figure 2
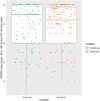
Figure 2. Individual SPARS ratings of each HFS train (5 trains × 26 participants) delivered to the control site (green) and the threat site (red).
Each dot represents a rating from one participant for one train. The SPARS has a non-painful range between −50 and 0, however, only the painful range (+5 to +50) is shown here because all train ratings were in the ‘painful’ range. Boxplot whiskers represent the maximum and minimum values, the ends of the box represent the upper and lower quartiles, and the horizontal line within the box represents the median.
Figure 3
Figure 3. The relationship between condition and anxiety rating (n = 26).
Anxiety rating reflects response to the statement, “At the time of receiving the intense electrical stimulation on my right/left arm, I felt anxious”, where 1 = strongly disagree and 5 = strongly agree. Each dot represents each participant’s response with reference to the control site (green) and the threat site (red), with horizontal jitter added to aid visibility. Boxplot whiskers represent the maximum and minimum values, the ends of the box represent the upper and lower quartiles, and the horizontal line within the box represents the median.
Figure 4
Figure 4. The relationship between condition and threat rating n = 26.
Threat rating reflects responses to the statement “At the time of receiving the intense electrical stimulation, I was concerned that it would cause damage to my skin on my right/left arm”, where 1 = strongly disagree and 5 = strongly agree. Each dot represents each participant’s response with reference to the control site (green) and the threat site (red). Boxplot whiskers represent the maximum and minimum values, the ends of the box represent the upper and lower quartiles, and the horizontal line within the box represents the median.
Figure 5
Figure 5. Magnitude of secondary hyperalgesia at each time point, by condition.
Each dot represents the SPARS rating to pinprick at the control site (green) and threat site (red) at each time point for each participant, with the exception that each dot at time −4 represents a mean of three baseline trials. A negative SPARS rating indicates that the pinprick stimulus was non-painful; a positive SPARS rating indicates that the pinprick stimulus was painful. The vertical orange line shows the time of induction, which was 20 min before the first follow-up time point. The horizontal blue line represents ratings of 0—the exact point of transition from non-painful to painful. Boxplot whiskers represent the maximum and minimum values, the ends of the box represent the upper and lower quartiles, and the horizontal line within the box represents the median.
Figure 6
Figure 6. Between-condition difference in magnitude of secondary hyperalgesia at each time point, within each participant (n = 26).
Each dot represents the difference for one participant at each time point. The vertical orange line represents the time of HFS induction, which was 20 min before the first follow-up time point. The horizontal blue line represents ratings of 0—the exact point at which ratings transition from non-painful to painful. Boxplot whiskers represent the maximum and minimum values, the ends of the box represent the upper and lower quartiles, and the horizontal line within the box represents the median.
Figure 7
Figure 7. Surface area of secondary hyperalgesia for each time point, by condition, and within participant (n = 26).
Each dot represents the surface area at the control site (green) or threat site (red) at each time point for each participant. Boxplot whiskers represent the maximum and minimum values, the ends of the box represent the upper and lower quartiles, and the horizontal line within the box represents the median.

References

    1. Arntz A, Claassens L. The meaning of pain influences its experienced intensity. Pain. 2004;109(1–2):20–25. doi: 10.1016/j.pain.2003.12.030. - DOI - PubMed
    1. Auguie B. gridExtra: miscellaneous functions for graphics. R package version 2.3. 2017. https://CRAN.R-project.org/package=gridExtra https://CRAN.R-project.org/package=gridExtra
    1. Baron R, Wasner G, Borgstedt R, Hastedt E, Schulte H, Binder A, Kopper F, Rowbotham M, Levine JD, Fields HL. Effect of sympathetic activity on capsaicin-evoked pain, hyperalgesia, and vasodilatation. Neurology. 1999;52(5):923. doi: 10.1212/WNL.52.5.923. - DOI - PubMed
    1. Bates D, Maechler M, Bolker B, Walker S, Christensen HBR. lme4: Linear mixed-effects models using Eigen and S4. R package version 1.1-7. 2015. https://cran.r-project.org/web/packages/lme4/index.html https://cran.r-project.org/web/packages/lme4/index.html
    1. Beecher HK. Pain in men wounded in battle. Annals of Surgery. 1946;123(1):96–105. doi: 10.1097/00000658-194601000-00008. - DOI - PMC - PubMed

Publication types