. 2022 Jun 10:16:880742.
doi: 10.3389/fncom.2022.880742. eCollection 2022.

Rapid Spectral Dynamics in Hippocampal Oscillons

Affiliations

Rapid Spectral Dynamics in Hippocampal Oscillons

M S Zobaer et al. Front Comput Neurosci. .

Abstract

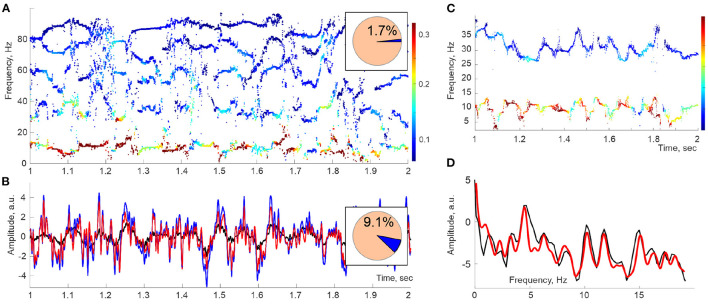
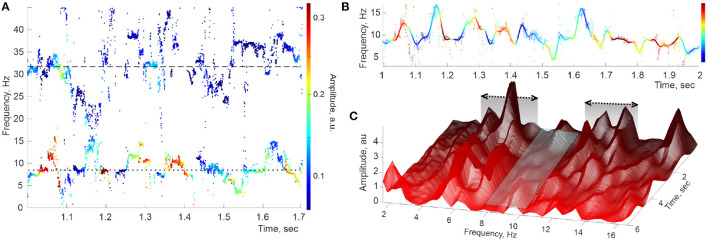
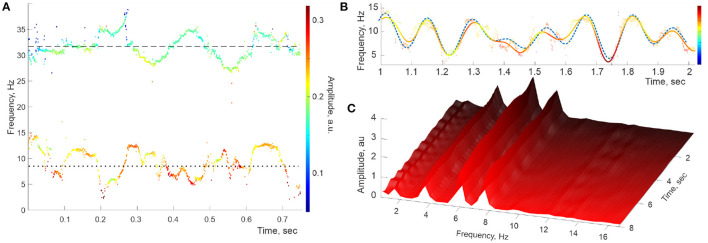
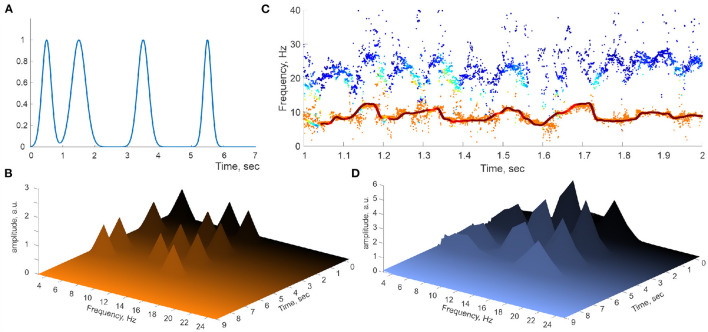
Neurons in the brain are submerged into oscillating extracellular potential produced by synchronized synaptic currents. The dynamics of these oscillations is one of the principal characteristics of neurophysiological activity, broadly studied in basic neuroscience and used in applications. However, our interpretation of the brain waves' structure and hence our understanding of their functions depend on the mathematical and computational approaches used for data analysis. The oscillatory nature of the wave dynamics favors Fourier methods, which have dominated the field for several decades and currently constitute the only systematic approach to brain rhythms. In the following study, we outline an alternative framework for analyzing waves of local field potentials (LFPs) and discuss a set of new structures that it uncovers: a discrete set of frequency-modulated oscillatory processes-the brain wave oscillons and their transient spectral dynamics.

Keywords: brain rhythms; hippocampus; oscillons; spectral wave; theta.


Conflict of interest statement

The authors declare that the research was conducted in the absence of any commercial or financial relationships that could be construed as a potential conflict of interest.

Figures

Figure 1
Figure 1
Spectral waves. (A) A second-long segment of the Discrete Pade' Transform (DPT) spectrogram computed for Local Field Potentials (LFPs) recorded in the hippocampal CA1 area of an actively moving rat exhibits a series of traces—the spectral waves, which can be viewed as timelines of time-dependent frequencies ωq(t). The dot colors designate the instantaneous amplitudes Aq(t) of the corresponding oscillons (colorbar). Here, the sliding window width is TW ≈ 50 ms, and the full number of DPT harmonics is N = 200, of which 1.7% are stable and produce spectral waves (pie diagram). (B) Oscillatory part of the LFP signal reconstructed from the stable frequencies (red) differs from the original signal (blue) by ≈ 9% of the signal's power (pie diagram). The mismatch is due to the discarded unstable frequencies, i.e., to the removed noise component ξ(t) (black curve). (C) At higher time resolutions (TW ≈ 20 ms), spectral waves exhibit a quasiperiodic pattern. Shown are the θ (below) and the slow-γ (above) spectral waves. (D) The spectral power profiles constructed using Fourier (black line) and Welch's (red line) techniques show a set of peaks indicating the individual embedded frequencies.
Figure 2
Figure 2
Hippocampal theta wave. (A) Stable frequencies falling under 40 Hz form intermittent traces occupying the θ-domain (lower trace) and the slow-γ domain (upper trace), with the means ωθ,0 ≈ 8 Hz and ωγ1,0 ≈ 32 Hz (doted and dashed lines, respectively). Color of the dots represents the instantaneous amplitude of the corresponding oscillons (colorbar). (B) Interpolating the raw θ-trace (dimmed pattern in the background) over uniformly spaced time points yields the reconstructed spectral wave ωθ(t) (solid colored line). (C) Welch's spectrogram of ωθ(t) exhibits domains of “peak ranges” (within the domains ΔΩθ1 ≈ 4 − 7 Hz and ΔΩθ2 ≈ 10 − 14 Hz), separated by a “valley” extending over ΔΩ¯θ1=7-10 Hz.
Figure 3
Figure 3
Simulated signal with constant embedded frequencies. (A) The power spectra of the simulated LFP wave—a combination of two synthetic oscillons produced at the same sampling rate as the recorded data. The timelines of the reconstructed stable frequencies undulate around the imputed mean values, ω~θ,08 Hz (dotted line) and ω~γ1,032 Hz (dashed line). (B) Interpolating the “raw” θ-trace (both frequencies and amplitudes) over the full set of timepoints yields the reconstructed spectral wave (solid colored line), which also matches the inputted ω~θ (dashed line), with the embedded frequencies Ωθ,1 ≈ 1.9 Hz, Ωθ,2 ≈ 4.4 Hz, Ωθ,3 ≈ 6.2 Hz, and Ωθ,3 ≈ 8.2. (C) The “evolvent” Welch spectrogram reveals the embedded frequencies Ωθ,1, Ωθ,2 Hz, and Ωθ,3 that are sharply defined and approximately constant.
Figure 4
Figure 4
Perturbed spectral waves. (A) Series of Gaussian pulses applied to a simulated spectral harmonic. (B) Spectral pulses on Welch's spectrogram. (C) The corresponding spectral θ-wave (continuous line) and the underlying raw traces of the DPT-reconstructed stable θ and γ frequencies. (D) Welch's spectrogram of the spectral θ-waves reproduce the locations of the spectral pulses.

References

    1. Amin M., Shirokoff D. (2010). Flat-top oscillons in an expanding universe. Phys. Rev. D 81, 085045. 10.1103/PhysRevD.81.085045 - DOI
    1. Arenas A., Díaz-Guilera A., Kurths J., Moreno Y., Zhou C. (2008). Synchronization in complex networks. Phys. Rep. 469, 93–153. 10.1016/j.physrep.2008.09.002 - DOI
    1. Aru J., Aru J., Priesemann V., Wibral M., Lana L., Pipa G., et al. . (2015). Untangling cross-frequency coupling in neuroscience. Curr. Opin. Neurobiol. 31, 51–61. 10.1016/j.conb.2014.08.002 - DOI - PubMed
    1. Babb S. (1977). Accuracy of planetary theories, particularly for Mars. Isis 68, 426–434. 10.1086/351818 - DOI
    1. Baker G., Graves-Morris P. (1996). Padé Approximants, 2nd Edn.. Cambridge, UK: Cambridge University Press.

LinkOut - more resources