. 2022 Jun 9:9:858097.
doi: 10.3389/fcvm.2022.858097. eCollection 2022.

Sex-Specific Associations of Anxiety With Left Ventricular Hypertrophy and Transmural Dispersion of Repolarization in Hypertensive Patients

Affiliations

Sex-Specific Associations of Anxiety With Left Ventricular Hypertrophy and Transmural Dispersion of Repolarization in Hypertensive Patients

Ling Zhu et al. Front Cardiovasc Med. .

Abstract

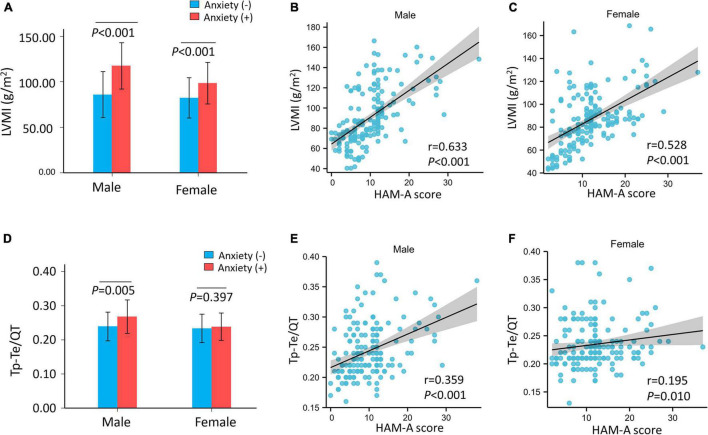
Background: The previous studies have shown that individuals with hypertension and anxiety have a higher mean left ventricular mass index (LVMI) and QTc dispersion. We explored the associations between anxiety and left ventricular hypertrophy (LVH) and between anxiety and transmural dispersion of repolarization (TDR) (as detected by T peak-T end interval/QT interval, Tp-Te/QT ratio) in patients with hypertension.

Methods: A total of 353 patients with uncomplicated hypertension from the Shaanxi Provincial People's Hospital were enrolled between 2017 and 2021. Anxiety was defined as a Hamilton Anxiety Scale (HAM-A) score ≥ 14. Logistic regression models were used to estimate the association between HAM-A and LVH. The association between HAM-A score and Tp-Te/QT was estimated using linear regression.

Results: Participants were divided into two groups based on the presence of anxiety. LVMI was significantly higher in patients with hypertension and anxiety than in those with hypertension without anxiety (no anxiety: 84.36 ± 23.82, anxiety: 105.75 ± 25.45 g/m2, p < 0.001). HAM-A score was positively correlated with LVMI (r = 0.578, p < 0.001) and with Tp-Te/QT (r = 0.252, p < 0.001). Logistic regression models showed that patients with hypertension and anxiety were at higher risk of LVH than were patients with hypertension without anxiety (adjusted OR, 2.44, 95% CI, 1.35-4.43, p = 0.003). The linear regression analysis showed that the HAM-A score was associated with Tp-Te/QT ratio (adjusted β, 0.001, 95% CI, 0.001-0.002, p = 0.013). There was an interaction between sex and anxiety for LVH risk (p for interaction = 0.035) and for increased Tp-Te/QT (p for interaction = 0.014). After stratification by sex, anxiety was associated with increased risk for LVH in men with hypertension (adjusted OR, 5.56, 95% CI, 2.07-14.98, p = 0.001), but not in women (adjusted: OR, 1.44, 95% CI, 0.64-3.26, p = 0.377) with hypertension. The HAM-A score was also positively associated with Tp-Te/QT ratio in male (adjusted β, 0.002, 95% CI, 0.001-0.003, p < 0.001), but not in women (adjusted β, 0.001, 95% CI, -0.0002-0.002, p = 0.165).

Conclusion: Our results indicated that anxiety was associated with LVH and with increased TDR in men with hypertension, but not in women with hypertension.

Keywords: anxiety; hypertension; left ventricular hypertrophy; sex; transmural dispersion of repolarization.


Conflict of interest statement

The authors declare that the research was conducted in the absence of any commercial or financial relationships that could be construed as a potential conflict of interest.

Figures

FIGURE 1
FIGURE 1
The left ventricular mass index (LVMI) and Tp–Te/QT ratio of hypertensive patients and correlation with Hamilton anxiety scale (HAM-A) score. (A) The LVMI was significantly higher in hypertensive patients with anxiety than hypertensive patients without anxiety (p < 0.001). (B) The HAM-A score was significantly positive correlated with LVMI (r = 0.578, p < 0.001). (C) The Tp–Te/QT ratio was significantly higher in hypertensive patients with anxiety than hypertensive patients without anxiety (p < 0.001). (D) HAM-A score was weakly positively correlated with Tp–Te/QT ratio in hypertensive patients (r = 0.252, p < 0.001). HAM-A, Hamilton anxiety scale; LVMI, left ventricular mass index; QT interval, Q wave start to T wave end interval; Tp–Te interval, T-wave peak to T-wave end interval.
FIGURE 2
FIGURE 2
The LVMI and Tp–Te/QT ratio of hypertensive patients and correlation with HAM-A score after stratified by sex. (A) The LVMI was significantly higher in hypertensive patients with anxiety than hypertensive patients without anxiety both in male (p < 0.001) and female (p < 0.001). (B,C) HAM-A score was significantly positive correlated with LVMI both in male (r = 0.633, p < 0.001) and female (r = 0.528, p < 0.001). The Tp–Te/QT ratio was significantly higher in hypertensive patients with anxiety than hypertensive patients without anxiety (p < 0.001). (D) Tp–Te/QT ratio was higher in male (p = 0.005) with anxiety but not in female (p = 0.397) with anxiety in hypertensive patients. (E,F) HAM-A score was positively correlated with Tp–Te/QT ratio (male: r = 0.359, p < 0.001; female: r = 0.195, p = 0.010). HAM-A, Hamilton anxiety scale; LVMI, left ventricular mass index; QT interval, Q wave start to T wave end interval; Tp–Te interval, T-wave peak to T-wave end interval.
FIGURE 3
FIGURE 3
Logistic analysis of anxiety for LVH in subgroup analyses stratified by sex, age, body mass index (BMI), and smoking. The associations of anxiety with LVH showed interaction with sex, while there was no interaction with age (<60 years vs. ≥60 years), BMI (<24 kg/m2 vs. ≥24 kg/m2), and smoking. BMI, body mass index; LVH, left ventricular hypertrophy.
FIGURE 4
FIGURE 4
Linear regression model of HAM-A score for Tp–Te/QT ratio in subgroup analyses stratified by sex, age, BMI, and smoking. The associations of HAM-A score with Tp–Te/QT ratio showed significant interaction with sex, while there was no interaction with age (<60 years vs. ≥60 years), BMI (<24 kg/m2 vs. ≥24 kg/m2), and smoking. BMI, body mass index; HAM-A, Hamilton anxiety scale; QT interval, Q wave start to T wave end interval; Tp–Te interval, T-wave peak to T-wave end interval.

References

    1. Giamouzis G, Dimos A, Xanthopoulos A, Skoularigis J, Triposkiadis F. Left ventricular hypertrophy and sudden cardiac death. Heart Fail Rev. (2021) 27:711–24. 10.1007/s10741-021-10134-5 - DOI - PubMed
    1. Stewart MH, Lavie CJ, Shah S, Englert J, Gilliland Y, Qamruddin S, et al. Prognostic implications of left ventricular hypertrophy. Prog Cardiovasc Dis. (2018) 61:446–55. 10.1016/j.pcad.2018.11.002 - DOI - PubMed
    1. Dimopoulos S, Nicosia F, Donati P, Prometti P, De Vecchi M, Zulli R, et al. QT dispersion and left ventricular hypertrophy in elderly hypertensive and normotensive patients. Angiology. (2008) 59:605–12. 10.1177/0003319707310276 - DOI - PubMed
    1. Wolk R. Arrhythmogenic mechanisms in left ventricular hypertrophy. Europace. (2000) 2:216–23. 10.1053/eupc.2000.0110 - DOI - PubMed
    1. Galetta F, Franzoni F, Fallahi P, Tocchini L, Graci F, Carpi A, et al. Effect of telmisartan on QT interval variability and autonomic control in hypertensive patients with left ventricular hypertrophy. Biomed Pharmacother. (2010) 64:516–20. 10.1016/j.biopha.2009.09.016 - DOI - PubMed

LinkOut - more resources