. 2022 Jun 10:13:883092.
doi: 10.3389/fendo.2022.883092. eCollection 2022.

Severe Hyperprolactinemia Promotes Brown Adipose Tissue Whitening and Aggravates High Fat Diet Induced Metabolic Imbalance

Affiliations

Severe Hyperprolactinemia Promotes Brown Adipose Tissue Whitening and Aggravates High Fat Diet Induced Metabolic Imbalance

Felicitas Lopez-Vicchi et al. Front Endocrinol (Lausanne). .

Abstract

Background: The association of high serum prolactin and increased body weight is positive but controversial, therefore we hypothesized that additional factors such as diets and the impact of prolactin on brown adipose tissue may condition its metabolic effects.

Methods: We used LacDrd2KO females with lifelong severe hyperprolactinemia due dopamine-D2 receptor deletion from lactotropes, and slow onset of metabolic disturbances, and compared them to their respective controls (Drd2 loxP/loxP ). Food intake, and binge eating was evaluated. We then challenged mice with a High Fat (HFD) or a Control Diet (CD) for 8 weeks, beginning at 3 months of age, when no differences in body weight are found between genotypes. At the end of the protocol brown and white adipose tissues were weighed, and thermogenic and lipogenic markers studied, using real time PCR (Ucp1, Cidea, Pgc1a, Lpl, adiponectin, Prlr) or immunohistochemistry (UCP1). Histochemical analysis of brown adipose tissue, and glucose tolerance tests were performed.

Results: Hyperprolactinemic mice had increased food intake and binge eating behavior. Metabolic effects induced by a HFD were exacerbated in lacDrd2KO mice. Hyperprolactinemia aggravated HFD-induced body weight gain and glucose intolerance. In brown adipose tissue pronounced cellular whitening as well as decreased expression of the thermogenic markers Ucp1 and Pgc1a were observed in response to high prolactin levels, regardless of the diet, and furthermore, hyperprolactinemia potentiated the decrease in Cidea mRNA expression induced by HFD. In subcutaneous white adipose tissue hyperprolactinemia synergistically increased tissue weight, while decreasing Prlr, Adiponectin and Lpl mRNA levels regardless of the diet.

Conclusions: Pathological hyperprolactinemia has a strong impact in brown adipose tissue, lowering thermogenic markers and evoking tissue whitening. Furthermore, it modifies lipogenic markers in subcutaneous white adipose, and aggravates HFD-induced glucose intolerance and Cidea decrease. Therefore, severe high prolactin levels may target BAT function, and furthermore represent an adjuvant player in the development of obesity induced by high fat diets.

Keywords: CIDEA; PGC1 alpha; UCP1; brown adipose tissue; obesity; prolactin; thermogenic markers; whitening.


Conflict of interest statement

The authors declare that the research was conducted in the absence of any commercial or financial relationships that could be construed as a potential conflict of interest.

Figures

Figure 1
Figure 1
LacDrd2KO female mice have increased binge eating behavior. Characterization of binge-eating behavior in 5-month old lacDrd2KO and Drd2loxP/loxP female mice. (A) Regular pellet intake in grams during 2 hours for 4 consecutive days, n= 6 and 6 for Drd2loxP/loxP and lacDrd2KO mice, respectively. (B) High Fat pellet intake in grams during 2 hours for 4 consecutive days, n= 6 and 5 for Drd2loxP /loxP and lacDrd2KO mice, respectively. Repeated measures TWO ANOVA; “a” P ≤ 0.05 vs. genotype-matched HF mice on day 1; *P ≤ 0.05 vs. Drd2loxP/loxP HF- fed, day-matched mice.
Figure 2
Figure 2
Serum prolactin, body weight and food intake in response to a high-fat diet and hyperprolactinemia. (A) Serum prolactin levels in ng/ml at the end to the feeding protocol (Two Way Anova, *P ≤0.05 vs. diet- matched Drd2 loxP/loxP mice). (B) Weekly measured body weight in grams; (C) food intake in grams (g); (D) fat intake in grams (g); and (E) energy intake in calories consumed (cal) (n= 6, and 6 Drd2 loxP/loxP control diet (CD) and high fat diet (HFD) respectively, and 5 and 5 for lacDrd2KO mice fed with CD or HFD, respectively. Three-way ANOVA, “a” = P ≤ 0. 05 vs. genotype- and time- matched mice fed with CD *P ≤0.05 vs diet- and time-matched Drd2 loxP/loxP mice.
Figure 3
Figure 3
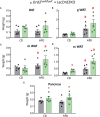
Effect of high-fat diet and hyperprolactinemia on tissue/organ weight. (A) brown adipose tissue (BAT), (B) gonadal white adipose tissue (gWAT), (C) mesenteric white adipose tissue (mWAT), and (D) subcutaneous white adipose tissue (scWAT) weights in g, (E) pancreas in 5-month-old Drd2 loxP/loxP and lacDrd2KO female mice fed a CD or HFD for two months. N (for this figure the number of samples is defined from left to right within each panel) = 6, 5, 6, 5 (A–C, E); and 5, 4, 6, 5 (D). Two-way ANOVA; “a” = P ≤ 0. 05 vs. genotype- matched mice fed with control diet; *P ≤0.05 vs. diet- matched Drd2 loxP/loxP mice.
Figure 4
Figure 4
Effect of a high-fat diet and hyperprolactinemia on glucose homeostasis. Intraperitoneal glucose tolerance test (GTT, 2 mg/g) in fasted 5-month-old Drd2 loxP/loxP and lacDrd2KO mice fed a CD or HFD. Three-way ANOVA with repeated-measures design for the effects of time, diet and genotype; “a” P< 0.01 vs. time 0 for genotype- and diet- matched mice, and *P <0.01 vs. time-matched Drd2 loxP/loxP CD mice, n = 6,6, for Drd2 loxP/loxP mice fed control diet and HFD, respectively, and n=5,5 for lacDrd2KO mice fed a control diet and a HFD. Inset: Area Under the Curve (AUC). Two-way ANOVA; “a” = P ≤ 0. 05 vs. genotype- matched mice fed with control diet; *P ≤0.05 vs. diet- matched Drd2 loxP/loxP mice.
Figure 5
Figure 5
Impact of hyperprolactinemia and high-fat diet on gene expression profile of subcutaneous white adipose tissue. mRNA levels of (A) Prlr, (B) Ucp1, (C) adiponectin and (D) Lpl, in 5- month-old Drd2 loxP/loxP and lacDrd2KO female mice with free access to a control diet (CD) or a HFD. Drd2 loxP/loxP mice (CD, n = 5; HFD, n = 6), lacDrd2KO mice (CD, n = 5; HFD n = 5). Two-way ANOVA; “a” =P ≤ 0. 05 vs. genotype-matched mice fed with control diet, * P ≤0.05 vs. diet-matched Drd2 loxP/loxP mice.
Figure 6
Figure 6
Impact of hyperprolactinemia and high fat diet on gene expression profile of brown adipose tissue. mRNA levels of (A) Prlr, (B-D) Ucp1, Cidea and Pgc1a, indicators of thermogenic capacity (E) adiponectin, (F) Lpl, and (G) Il1b in Drd2 loxP/loxP and lacDrd2KO 5-month-old female mice with free access to a control diet (CD) or a HFD during two months. Drd2 loxP/loxP (CD, n = 6; HFD, n = 6), lacDrd2KO (CD, n = 5; HFD, n = 5). Two-way ANOVA; “a” P ≤ 0. 05 vs. genotype-matched mice fed with control diet, *P ≤0.05 vs. diet-matched Drd2 loxP/loxP mice.
Figure 7
Figure 7
Impact of hyperprolactinemia and high fat diet on brown adipose tissue architecture, and UCP1 staining (A) H&E staining of paraffin embedded samples of BAT from Drd2 loxP/loxP and lacDrd2KO female mice fed with control diet (CD) or HFD. Representative images captured at 40X magnification using light microscopy. (B) Average adipocyte size (μm2) in BAT tissue from Drd2 loxP/loxP and lacDrd2KO female mice fed with control diet (CD) or HFD, n=3 for each group, *P = 0.0036 vs. Drd2 loxP/loxP diet-matched mice; (C) Average droplet size (μm2) within brown adipocytes from Drd2 loxP/loxP and lacDrd2KO female mice fed with control diet (CD) or HFD, n = 3 for each group, *P = 0.0051 vs. Drd2 loxP/loxP diet-matched mice; “a” P = 0.037 vs CD, genotype-matched mice; (D) Percentage of droplets according to size (small ≤ 3 μm2, medium from 3.01 to 8 μm2, and big ≥ 8.01 μm2 in the four experimental groups; (E) Representative images of UCP1 staining, (F) quantification of immunoreactive UCP1 from BAT samples from Drd2 loxP/loxP and lacDrd2KO female mice fed with control diet (CD) or HFD; n = 3 for each group, * P = 0.041 vs. Drd2 loxP/loxP diet-matched mice.

Similar articles

Cited by

References

    1. Tovar S, Dieguez C. Prolactin and Energy Homeostasis: Pathophysiological Mechanisms and Therapeutic Considerations. Endocrinology (2014) 155:659–62. doi: 10.1210/en.2013-2167 - DOI - PubMed
    1. Lopez-Vicchi F, Becu-Villalobos D. Prolactin: The Bright and the Dark Side. Endocrinology (2017) 158:1556–9. doi: 10.1210/en.2017-00184 - DOI - PubMed
    1. Lopez-Vicchi F, De Winne C, Brie B, Sorianello E, Ladyman SR, Becu-Villalobos D. Metabolic Functions of Prolactin: Physiological and Pathological Aspects. J Neuroendocrinol (2020) 32:e12888. doi: 10.1111/jne.12888 - DOI - PubMed
    1. Aoki M, Wartenberg P, Grunewald R, Phillipps HR, Wyatt A, Grattan DR, et al. . Widespread Cell-Specific Prolactin Receptor Expression in Multiple Murine Organs. Endocrinology (2019) 160:2587–99. doi: 10.1210/en.2019-00234 - DOI - PubMed
    1. Moore BJ, Gerardo-Gettens T, Horwitz BA, Stern JS. Hyperprolactinemia Stimulates Food Intake in the Female Rat. Brain Res Bull (1986) 17:563–9. doi: 10.1016/0361-9230(86)90226-1 - DOI - PubMed

Publication types

LinkOut - more resources