. 2022 Apr;4(4):2100254.
doi: 10.1002/aisy.202100254. Epub 2022 Feb 20.

A Soft Sensor for Bleeding Detection in Colonoscopies

Affiliations

A Soft Sensor for Bleeding Detection in Colonoscopies

Arincheyan Gerald et al. Adv Intell Syst. 2022 Apr.

Abstract

Colonoscopies allow surgeons to detect common diseases i.e. colorectal cancer, ulcers and other ailments. However, there is a risk of bleeding in the lower gastrointestinal (GI) tract while maneuvering endoscopes. This may be due to perforations, hemorrhaging, polyps, diverticuli or post-biopsy complications. Thus, it is essential for the surgeon to be able to detect bleeding at the site and evaluate the severity of blood leakage. This paper presents a soft sensor that can detect the presence of blood at the bleeding site during colonoscopies. The sensor consists of optical waveguides that interface with a microfluidic channel. Blood flow causes absorption and scattering of incident light that can be picked up by the optical sensing apparatus via light transmission through the waveguide. The surgeon can be alerted when bleeding occurs through a graphical user interface. The device is compact and measures only 1 mm thick. This allows the sensor to be circumferentially mounted onto a colonoscope at different locations. The sensor is able to record the presence of blood as an optical loss, rapidly detect the presence of blood in under 100 milliseconds as it enters the microchannel, and differentiate between gastric fluid and blood through changes in measured optical loss.

Keywords: Blood Detection; Colonoscopy; Medical Robotics; Soft Robotics; Soft Sensors.


Figures
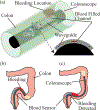
Figure 1:
Figure 1:
Soft sensor for bleeding detection in colonoscopy. a) Three blood sensors mounted onto the colonoscope showing the device layout in an isometric view and a sectional front view showing one of the mounted sensors. b) The workflow of the device showing the colonoscope pressing against the intestinal wall and causing bleeding and c) the blood sensor detecting bleeding as it passes through the region and picks up the blood via capillary action.
Figure 2:
Figure 2:
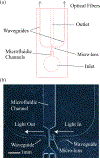
Soft sensor design. a) Schematic layout of the device. b) Microscope image showing the waveguide channels, focusing lens, and the inlet and outlet of the blood sensor.
Figure 3:
Figure 3:
a) Diagram showing layout and path of light passing through waveguide-microchannel interface and lens. b) Diagram showing layout and path of light passing through waveguide-microchannel interface without lens. c) Non-sequential ray tracing model illustrating focusing of divergent light rays in the microchannel by the in-plane lens. d) Non-sequential ray tracing model illustrating divergent light rays escaping the microchannel and the output waveguide in the absence of the lens.
Figure 4:
Figure 4:
Soft sensor fabrication. a) SU-8 patterned onto wafer through photolithography. b) PDMS spin coated onto patterned wafer. c) Blank and patterned PDMS is peeled off wafers, and exposed to plasma at 60 W, 30 s. d) PDMS layers are bonded together post plasma modification. e) Waveguide channels are filled with core material (Clear Flex™ 30) under vacuum. f) Sensor is cured at 65 °C for 4 h. g) Sensor is subjected to second plasma modification at 70 W, 500 s.
Figure 5:
Figure 5:
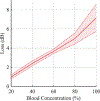
Soft bleeding sensor characterization of Blood Concentration (v/v) vs Optical Loss (dB). The solid line is the mean value and the shaded area represents the standard deviation computed on five prototypes.
Figure 6:
Figure 6:
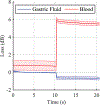
Soft bleeding sensor characterization: optical loss of simulated blood compared to simulated gastric fluid. The solid line is the mean value and the shaded area represents the standard deviation computed on five prototypes that have been tested ten times each.
Figure 7:
Figure 7:
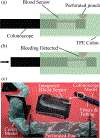
In-vitro test schematic. a) Cross sectional view of the colonoscope with blood sensor navigating the TPE colon, which contains a perforated pouch holding the blood analogue. b) Colonoscope contacts the perforated pouch causing bleeding which is subsequently detected by the blood sensor. c) Device layout for in-vitro set up showing the TPE colon, blood sensors mounted onto the colonoscope model, and associated optical fibers and tubing.
Figure 8:
Figure 8:
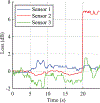
In-vitro test results. Loss vs Time plot of blood sensor mounted on colonoscope during in-vitro testing.

References

    1. Siegel RL, Miller KD, Jemal A, CA: A Cancer Journal for Clinicians 2020, 70, 1 7. - PubMed
    1. Bonjer HJ, Deijen CL, Abis GA, Cuesta MA, van der Pas MH, de Lange-de Klerk ES, Lacy AM, Bemelman WA, Andersson J, Angenete E, Rosenberg J, Fuerst A, Haglind E, New England Journal of Medicine 2015, 372, 14 1324. - PubMed
    1. Langan RC, Gotsch PB, Krafczyk MA, Skillinge DD, American Family Physician 2007, 76, 9 1323. - PubMed
    1. Baum S, Athanasoulis CA, Waltman AC, Galdabini J, Schapiro RH, Warshaw AL, Ottinger LW, American Journal of Roentgenology 1977, 129, 5 789. - PubMed
    1. Rasmussen PV, Dalgaard F, Gislason GH, Brandes A, Johnsen SP, Grove EL, Torp-Pedersen C, Dybro L, Harboe L, Münster A-MB, Pedersen L, Blanche P, Pallisgaard JL, Hansen ML, European Heart Journal 2020, 1–7. - PubMed

LinkOut - more resources