Determinants of Task-Based Exposures to Alpha-Diketones in Coffee Roasting and Packaging Facilities Using a Bayesian Model Averaging Approach
- PMID: 35757620
- PMCID: PMC9218577
- DOI: 10.3389/fpubh.2022.878907
Determinants of Task-Based Exposures to Alpha-Diketones in Coffee Roasting and Packaging Facilities Using a Bayesian Model Averaging Approach
Abstract
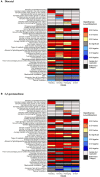
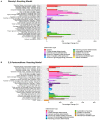
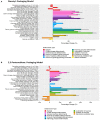
Coffee production workers can be exposed to inhalational hazards including alpha-diketones such as diacetyl and 2,3-pentanedione. Exposure to diacetyl is associated with the development of occupational lung disease, including obliterative bronchiolitis, a rare and irreversible lung disease. We aimed to identify determinants contributing to task-based exposures to diacetyl and 2,3-pentanedione at 17 U.S. coffee production facilities. We collected 606 personal short-term task-based samples including roasting (n = 189), grinding (n = 74), packaging (n = 203), quality control (QC, n = 44), flavoring (n = 15), and miscellaneous production/café tasks (n = 81), and analyzed for diacetyl and 2,3-pentanedione in accordance with the modified OSHA Method 1013/1016. We also collected instantaneous activity-based (n = 296) and source (n = 312) samples using evacuated canisters. Information on sample-level and process-level determinants relating to production scale, sources of alpha-diketones, and engineering controls was collected. Bayesian mixed-effect regression models accounting for censored data were fit for overall data (all tasks) and specific tasks. Notable determinants identified in univariate analyses were used to fit all plausible models in multiple regression analysis which were summarized using a Bayesian model averaging method. Grinding, flavoring, packaging, and production tasks with ground coffee were associated with the highest short-term and instantaneous-activity exposures for both analytes. Highest instantaneous-sources of diacetyl and 2,3-pentanedione included ground coffee, flavored coffee, liquid flavorings, and off-gassing coffee bins or packages. Determinants contributing to higher exposures to both analytes in all task models included sum of all open storage sources and average percent of coffee production as ground coffee. Additionally, flavoring ground coffee and flavoring during survey contributed to notably higher exposures for both analytes in most, but not all task groups. Alternatively, general exhaust ventilation contributed to lower exposures in all but two models. Additionally, among facilities that flavored, local exhaust ventilation during flavoring processes contributed to lower 2,3-pentanedione exposures during grinding and packaging tasks. Coffee production facilities can consider implementing additional exposure controls for processes, sources, and task-based determinants associated with higher exposures to diacetyl and 2,3-pentanedione, such as isolating, enclosing, and directly exhausting grinders, flavoring mixers, and open storage of off-gassing whole bean and ground coffee, to reduce exposures and minimize risks for lung disease among workers.
Keywords: 2,3-pentanedione; Bayesian model averaging; alpha-diketones; coffee; correlated predictors; diacetyl; exposure determinants; task-based.
Copyright © 2022 Blackley, Groth, Cox-Ganser, Fortner, LeBouf, Liang and Virji.
Conflict of interest statement
The authors declare that the research was conducted in the absence of any commercial or financial relationships that could be construed as a potential conflict of interest.
Figures


References
-
- United States Department of Agriculture . Coffee: World Markets and Trade 2020/2021. In: Service FA, ed. (2020).
-
- Bureau of Census for the Bureau of Labor Statistics . Labor Force Statistics from the Current Population Survey. (2020). Available online at: https://www.bls.gov/cps/aa2019/cpsaat01.htm (accessed February 11, 2022).
-
- United States Census Bureau . Annual Survey of Manufacturers: Summary Statistics for Industry Groups and Industries in the U.S.: 2019 and 2018 (2019).
Publication types
MeSH terms
Substances
LinkOut - more resources
Full Text Sources
Medical

