. 2022 Jun 10:13:890003.
doi: 10.3389/fimmu.2022.890003. eCollection 2022.

Immunologic Biomarkers in Peripheral Blood of Persons With Tuberculosis and Advanced HIV

Affiliations

Immunologic Biomarkers in Peripheral Blood of Persons With Tuberculosis and Advanced HIV

Artur T L Queiroz et al. Front Immunol. .

Abstract

Introduction: Tuberculosis (TB) is a common opportunistic infection among people living with HIV. Diagnostic tests such as culture, Xpert-MTB-RIF, and ULTRA have low sensitivity in paucibacillary TB disease; a blood biomarker could improve TB diagnostic capabilities. We assessed soluble factors to identify biomarkers associated with TB among persons with advanced HIV.

Methods: A case-control (1:1) study was conducted, with participants from Rio de Janeiro and Manaus, Brazil. People living with HIV presenting with CD4 count ≤100 cells/mm3 were eligible to participate. Cases had culture-confirmed TB (N=15) (positive for Mycobacterium tuberculosis [Mtb]); controls had HIV-infection only (N=15). Study visits included baseline, month 2 and end of TB therapy, during which samples of peripheral blood were obtained. A panel containing 29 biomarkers including cytokines, chemokines and growth factors was utilized to assess candidate biomarkers using Luminex technology in cryopreserved EDTA plasma samples. We used neural network analysis, based on machine learning, to identify biomarkers (single or in combination) that best distinguished cases from controls. Additional multi-dimensional analyses provided detailed profiling of the systemic inflammatory environment in cases and controls.

Results: Median CD4 count and HIV-1 RNA load values were similar between groups at all timepoints. Persons with TB had lower body mass index (BMI) (median=19.6, Interquartile Range [IQR]=18.6-22.3) than controls (23.7; IQR: 21.8 = 25.5, p=0.004). TB coinfection was also associated with increased frequency of other comorbidities. The overall profile of plasma cytokines, chemokines and growth factors were distinct between the study groups at all timepoints. Plasma concentrations of IL-15 and IL-10 were on average lower in TB cases than in controls. When used in combination, such markers were able to discriminate between TB cases and controls with the highest degree of accuracy at each study timepoint.

Conclusion: Among persons with advanced HIV, plasma concentrations of IL-15 and IL-10 can be used in combination to identify TB disease regardless of time on anti-TB treatment.

Keywords: IL-10; IL-15; advanced HIV; biomarkers; cytokine; diagnosis; tuberculosis.


Conflict of interest statement

The authors declare that the research was conducted in the absence of any commercial or financial relationships that could be construed as a potential conflict of interest.

Figures

Figure 1
Figure 1
Differences in (A, C) CD4+count (cells/mm3) and (B, D) HIV viral load (HIV RNA copies/mL) between the TB-HIV and HIV groups at different timepoints. *Represents p-values < 0.001.
Figure 2
Figure 2
Profiling systemic inflammation to identify markers differentially expressed in persons with TB-HIV coinfection. Concentrations of the indicated biomarkers were quantified in plasma samples using Luminex technology in study participants at baseline (prior to anti-TB treatment) (A), at month 2 (B) and at END visit (C) of anti-TB treatment. Data were log2-transformed, and z-score normalized to build the heatmaps at each study timepoint. A hierarchical cluster analysis (Ward’s method, with dendrograms implying the Euclidean distance) was employed to test whether combined quantification of plasma concentrations of the biomarkers could be used to segregate the TB-HIV from the HIV group. The upper colored line corresponds to the groups: in light blue are the HIV samples and in red are the TB-HIV samples. The below bar plots correspond to log10 Viral load and CD4+ count. The side bar plot shows the fold change values from the comparison TB-HIV vs HIV and green bars are the differences with significant false discovery rate (5%). (D) Venn diagram with intersection with markers that showed statistical significance when comparing TB-HIV with HIV. All significant comparisons showed a negative fold-change.
Figure 3
Figure 3
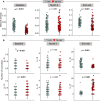
Soluble inflammatory markers do not differ according to the location of TB in TB-HIV patients. Boxplots show the levels of each marker analyzed at baseline, comparing pulmonary TB (PTB, n = 7) with PTB+extrapulmonary TB (EPTB, n = 8) in the TB-HIV population (n = 15). Only EGF showed a statistically significant difference (p<0.05) in comparisons.
Figure 4
Figure 4
Soluble inflammatory markers differ according to comorbidity occurrence in HIV patients. Boxplots show the levels of each marker analyzed at baseline, comparing comorbidity occurrence (n = 8) with those without comorbidity (n = 7) in the HIV population (n = 15). Only IFN-gamma and IL-4 showed a statistically significant difference (p < 0.05) in comparisons.
Figure 5
Figure 5
Artificial neural network analysis identified IL-15 and IL-10 as potential markers for distinguishing TB cases among persons with advanced HIV. (A) Dot plot from the biomarker values in both TB-HIV and HIV groups in the baseline, month 2 and END visit. The ellipses were calculated with the “distance t” from each group. The axis parallels graphs are each IL-15 and IL-10 log2 values displayed in density distribution (histograms). (B) Distribution of biomarkers in plasma from TB-HIV and HIV participants: Dots represent individuals with HIV-infection, whereas the triangles indicate TB-HIV participants. Values from a given study participant at the indicated study timepoints are connected through colored lines. The y axis shows the log2 IL-15 and IL-10 values. (C) Receiver Operator Characteristics (ROC) analysis using the plasma concentrations of both IL-15 and IL-10 at each study timepoint was performed to test the accuracy of the combined markers in distinguishing TB-HIV from HIV cases. All the areas under the curves (AUC) exhibited p-value of <0.0001.
Figure 6
Figure 6
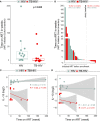
Timing of antiretroviral therapy (ART) does not impact IL-15 and IL-10 levels. (A) Boxplot shows that those with TB-HIV had a shorter time between initiation of ARV and enrollment in the study in relation to HIV patients (Mann-Whitney test p = 0.005). (B) Bar graph shows that 8/15 (53.3%) TB-HIV started ARV before being enrolled. Figures (C, D) show linear regressions between ART time and IL-15 and IL-10 levels, respectively. A regression was performed for each group (TB-HIV- red and HIV - blue) in relation to each of the biomarkers. No statistically significant differences were found in any of the markers or groups.
Figure 7
Figure 7
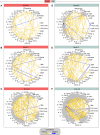
Correlation network of TB-HIV and HIV groups across the timepoints. The diameter of each circle is proportional to the number of significant correlations prospectively. The connecting lines represent statistically significant correlations (P < 0.05). Yellow connecting lines represent positive correlations while blue lines infer negative correlations. (A) – TB-HIV group at baseline, (B) – TB-HIV group at month 2, (C) – TB-HIV group at END, (D) –HIV group at baseline, (E) – HIV group at month 2, and (F) – HIV group at end visit.
Figure 8
Figure 8
Bootstrap correlation network analysis showed differences between baseline and END visits. (A) – Network density across the timepoints; (B) – Edge degree from IL-15 and IL-10 across the baseline, month 2 and end visit.

References

    1. UNAIDS . 2020 Global AIDS Update — Seizing the moment — Tackling entrenched inequalities to end epidemics, UNAIDS; Vol. 384 (2020).
    1. World Health Organization . Global Tuberculosis Report 2021. Geneva: World Health Organization; (2021). Available at: https://www.who.int/publications-detail-redirect/9789240037021.
    1. Duarte EC, Bierrenbach AL, Barbosa da Silva J, Tauil PL, Fátima Duarte E. Factors Associated With Deaths Among Pulmonary Tuberculosis Patients: A Case-Control Study With Secondary Data. J Epidemiol Community Health (2009) 63(3):233–8. doi: 10.1136/jech.2008.078972 - DOI - PubMed
    1. Saraceni V, King BS, Cavalcante SC, Golub JE, Lauria LM, Moulton LH, et al. . Tuberculosis as Primary Cause of Death Among AIDS Cases in Rio De Janeiro, Brazil. Int J Tuberc Lung Dis (2008) 12(7):769–72. - PMC - PubMed
    1. Viana PVS, Paiva NS, Villela DAM, Bastos LS, de Souza Bierrenbach AL, Basta PC. Factors Associated With Death in Patients With Tuberculosis in Brazil: Competing Risks Analysis. PloS One (2020) 15(10):e0240090. doi: 10.1371/journal.pone.0240090 - DOI - PMC - PubMed

Publication types