. 2022 Jun 9:13:854312.
doi: 10.3389/fimmu.2022.854312. eCollection 2022.

FOXO1 and FOXO3 Cooperatively Regulate Innate Lymphoid Cell Development

Affiliations

FOXO1 and FOXO3 Cooperatively Regulate Innate Lymphoid Cell Development

Thuy T Luu et al. Front Immunol. .

Abstract

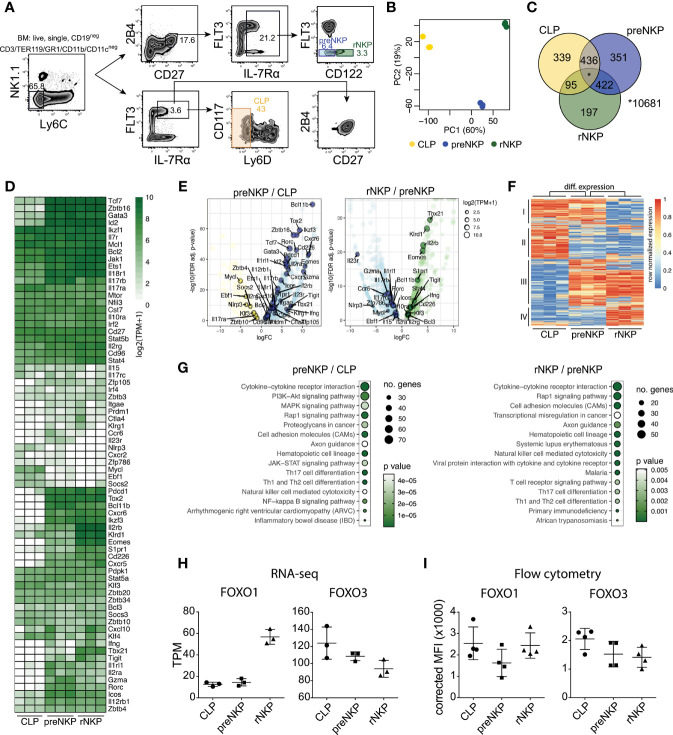
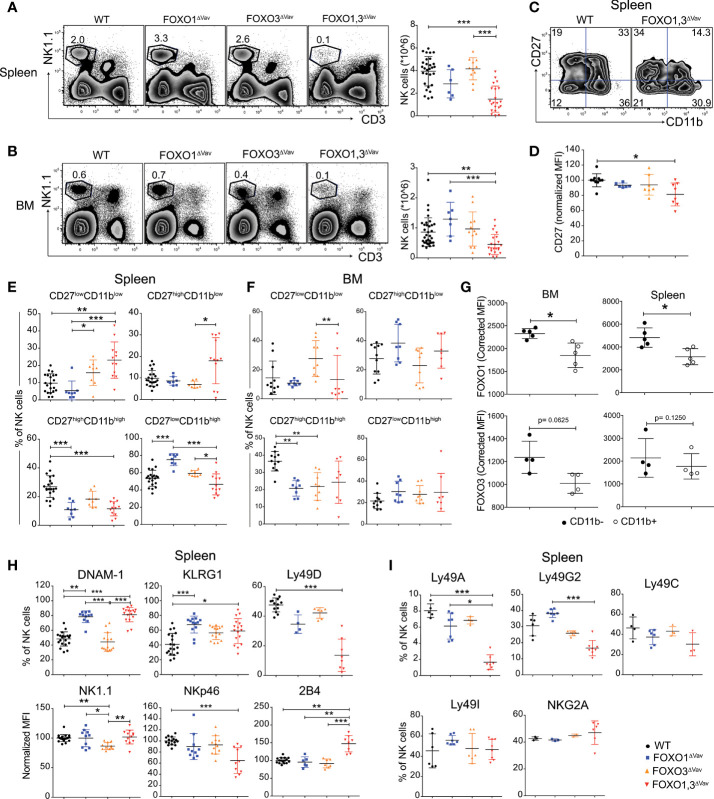
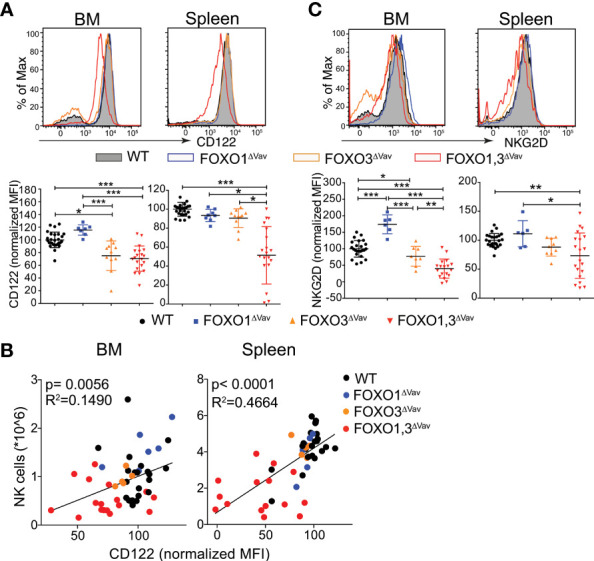
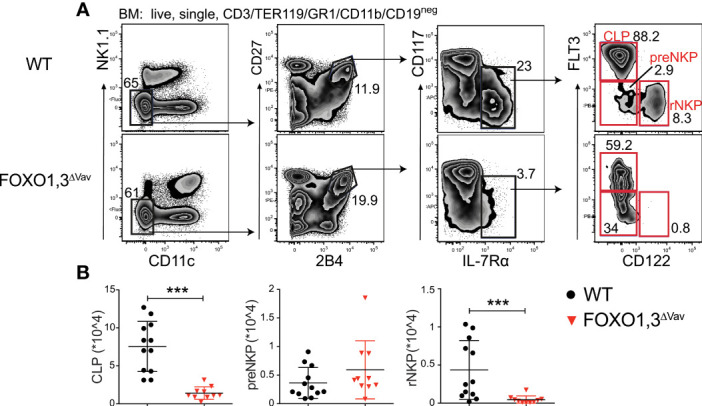
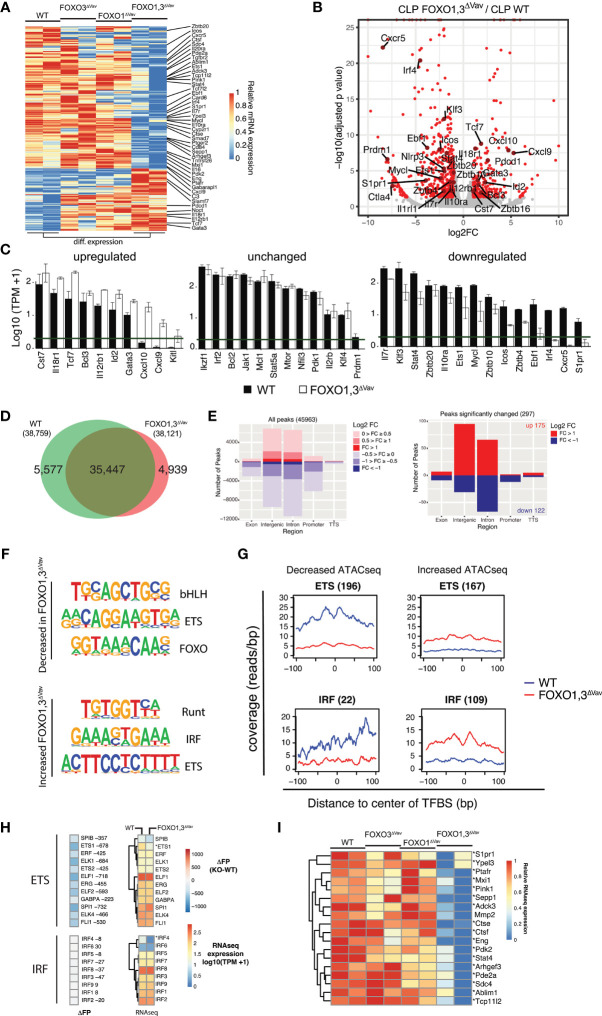
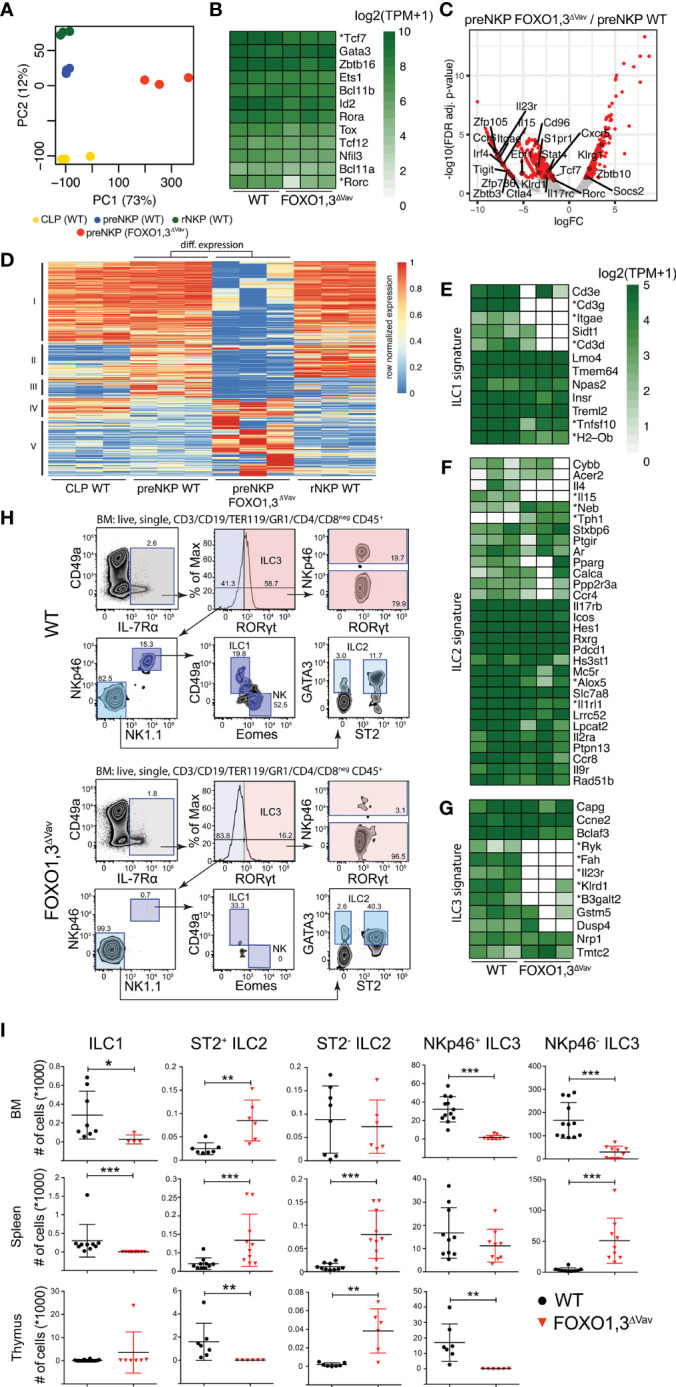
Natural killer (NK) cells play roles in viral clearance and early surveillance against malignant transformation, yet our knowledge of the underlying mechanisms controlling their development and functions remain incomplete. To reveal cell fate-determining pathways in NK cell progenitors (NKP), we utilized an unbiased approach and generated comprehensive gene expression profiles of NK cell progenitors. We found that the NK cell program was gradually established in the CLP to preNKP and preNKP to rNKP transitions. In line with FOXO1 and FOXO3 being co-expressed through the NK developmental trajectory, the loss of both perturbed the establishment of the NK cell program and caused stalling in both NK cell development and maturation. In addition, we found that the combined loss of FOXO1 and FOXO3 caused specific changes to the composition of the non-cytotoxic innate lymphoid cell (ILC) subsets in bone marrow, spleen, and thymus. By combining transcriptome and chromatin profiling, we revealed that FOXO TFs ensure proper NK cell development at various lineage-commitment stages through orchestrating distinct molecular mechanisms. Combined FOXO1 and FOXO3 deficiency in common and innate lymphoid cell progenitors resulted in reduced expression of genes associated with NK cell development including ETS-1 and their downstream target genes. Lastly, we found that FOXO1 and FOXO3 controlled the survival of committed NK cells via gene regulation of IL-15Rβ (CD122) on rNKPs and bone marrow NK cells. Overall, we revealed that FOXO1 and FOXO3 function in a coordinated manner to regulate essential developmental genes at multiple stages during murine NK cell and ILC lineage commitment.

Keywords: FOXO; IL-15; development; innate lymphocyte cells (ILCs); natural killer cells.


Conflict of interest statement

The authors declare that the research was conducted in the absence of any commercial or financial relationships that could be construed as a potential conflict of interest.

Figures

Figure 1
Figure 1
The rNKP gene expression program is established gradually in the CLP to preNKP and preNKP to rNKP developmental transitions. (A) Gating strategy for FACS sorting of BM NK cell progenitors (LY6Dneg CLP, preNKP and rNKP). (B) Principal component (PC) analysis of RNAseq data from indicated cell populations FACS sorted from WT (FOXO1flox/flox FOXO3flox/flox) mice (n = 3 per population). The variation explained by each PC is displayed in parenthesis. (C) Venn diagram showing the overlap between expressed protein-coding genes in indicated populations. Genes with ≥0.3 transcript per million (TPM) in all three replicas were considered expressed. (D) Hierarchically clustered heatmaps showing expression of protein-coding genes important for NK cell or ILC development. (E) Volcano plots showing differentially expressed genes for the comparisons between preNKP versus CLP (left panel) and rNKP versus preNKP (right panel). Differentially expressed genes (regulated by ≥2-fold at an FDR<0.05) are highlighted in color. Circle sizes indicate expression values in log2(TPM+1). (F) Hierarchically clustered heatmap showing row normalized expression of differential expressed genes (identified in E). Clusters I-IV are indicated. (G) KEGG pathway analysis of differentially expressed genes comparing preNKP versus CLP (left) and rNKP versus preNKP (right). Genes regulated by ≥2-fold at an FDR<0.05 were considered differentially expressed and used in the analysis. The size and color of the circles indicate the number of genes in each category and significance of enrichment respectively. (H–I) Expression levels of FOXO1 and FOXO3 from indicated progenitor populations, obtained by (H) RNA-seq or (I) flow cytometry. Dots represent individual analysed animals (n = 2-4). Bars indicate mean and SD. Data shown in (I) is from one representative experiment out of two independent experiments.
Figure 2
Figure 2
NK cell development is dependent on FOXO1 and FOXO3. (A) Representative flow cytometry profiles (left panel) and total number of NK cells (single, live NK1.1+CD3- cells) (right panel) in spleen from animals with the indicated genotypes (n = 6-14). (B) Representative flow cytometry profiles (left panel) and total number of NK cells (single, live NK1.1+CD3- cells) in bone marrow (BM) (right panel) from animals with the indicated genotypes (n=7-17). (C) Representative flow cytometry profiles showing splenic NK cell maturation stages in animals with the indicated genotypes. (D) CD27 MFI of CD27+ NK cells from spleens (n = 6-12). (E) Frequency (%) of splenic NK cells from each indicated maturation stage (n = 7-17). (F) Frequency (%) of BM NK cells from each indicated maturation stage (n = 8-11). (G) FOXO1 and FOXO3 protein expression (MFI) in BM and splenic NK cells (n = 4-5) from WT mice. Data is from one representative experiment out of two independent experiments. (H) Frequency (%) or normalized MFI of indicated activating receptors on splenic NK cells (n = 14-19). (I) Frequency (%) of splenic NK cells with indicated inhibitory receptors (n = 3-8). In panels (A, B, D–I): dots represent individual analyzed animals; bars indicate mean and SD; *, ** and *** indicates p-values <0.05, <0.01 and <0.001 respectively. P-values were calculated using: Kruskal Wallis tests with Dunn’s multiple comparisons test (panels A, B, D–F, H–I) or the paired non-parametric Wilcoxon T test (panel G). Symbols utilized to indicate the genotype of analyzed mice throughout the panels are shown in the bottom right corner of the figure.
Figure 3
Figure 3
FOXO regulates CD122 expression on NK cells. (A) Representative flow cytometry profiles (top) and normalized MFI (bottom panel) showing CD122 expression on BM and splenic NK cells (n = 8-28). (B) Correlation between CD122 expression and NK cell numbers (n = 50). (C) Representative flow cytometry profiles (top) and normalized MFI (bottom panel) showing NKG2D expression on BM and splenic NK cells (n = 6-26). In panels (A–C): dots represent individual analyzed animals; bars indicate mean and SD; *, ** and *** indicates p-values <0.05, <0.01 and <0.001 respectively. P-values were calculated using: Kruskal Wallis tests with Dunn’s multiple comparisons test (panels A, C) and linear regression (panel B).
Figure 4
Figure 4
FOXO deficiency results in a block at the preNKP to rNKP transition. (A) Representative flow cytometry profiles showing the identification of CLP, preNKP and rNKP in animals with the indicated genotype. (B) Total number of CLP, preNKP and rNKP in BM of animals with the indicated genotype (n = 10-12). In panel (B): dots represent individual analyzed animals; p-values were calculated using Mann-Whitney; bars indicate mean and SD; *** indicates p-values <0.001
Figure 5
Figure 5
Removal of FOXO results in NK associated gene regulatory changes at the CLP stage. (A) Heatmap showing row normalized expression of genes with differential expression (adjusted p-value ≤0.01, ≥2-fold change in expression and ≥1 TPM in 2+ samples) between WT and FOXO1,3ΔVav LY6Dneg CLPs. (B) Volcano plot showing log2 fold change and adjusted p-value for the comparison of WT to FOXO1,3ΔVav LY6Dneg CLPs. Red dots indicate genes with >2-fold change in expression and adjusted p-value < 0.05. (C) Bar graphs showing expression (TPM) of select NK associated genes. Genes with adjusted p-value ≤ 0.01, ≥2-fold change in expression and ≥1 TPM in 2+ samples were considered to have the decreased or increased expression. The green line indicates 1 TPM. (D) Venn diagram showing the overlap between ATACseq peaks identified in LY6Dneg CLPs from WT and FOXO1,3ΔVav mice. Only peaks identified in ≥2 replicas each with >30 reads were considered. (E) Annotation of all ATAC-seq peaks identified (left) and peaks with significantly altered chromatin accessibility (adjusted p-value < 0.01 and ≥2-fold change in signal) when comparing LY6Dneg CLPs from WT and FOXO1,3ΔVav mice (right). Number of regions and log2 fold change (FOXO1,3ΔVav/WT) in ATAC-seq signal is indicated. (F) Motifs enriched in differential ATAC-seq peaks. Top three most significantly enriched motifs existing in >10% of regions are displayed. (G) Cut-profiles for differential ATAC-seq peaks with ETS- and IRF-family transcription factor binding sites (TFBS). Number of regions with each TFBS is indicated in parenthesis. (H) Genome-wide difference in the number of footprints (identified in WT and FOXO1,3ΔVav LY6Dneg CLPs) (left) and expression (right) of indicated genes from the ETS- and IRF-families. * indicates significant differences in gene expression between LY6Dneg CLPs from WT and FOXO1,3ΔVav mice. (I) Expression of known ETS1 targets in LY6Dneg CLPs from mice with indicated genotypes.
Figure 6
Figure 6
Loss of FOXO results in a perturbation of the preNKP transcriptional program and the development of non-cytotoxic ILCs. (A) Principal component (PC) analysis of RNAseq data from indicated cell populations (for gating strategy see Figure 1A ) from wildtype and FOXO1,3ΔVav mice (n = 3). The variation explained by each PC is displayed in parenthesis. (B) Hierarchically clustered heatmaps showing gene expression for selected transcription factors critical for NK/ILC development. * indicates significant differences in expression between WT and FOXO1,3ΔVav preNKPs (FDR < 0.05, >2-fold change). (C) Volcano plot showing log2 fold change and adjusted p-value for the comparison of WT to FOXO1,3ΔVav preNKPs. Red dots indicate genes with >2-fold change in expression and adjusted p-value < 0.05. (D) Hierarchically clustered heatmap showing row normalized expression of differential expressed genes (identified in C). Clusters I-V are indicated. (E–G) Hierarchically clustered heatmaps showing gene expression of (E) ILC1, (F) ILC2 and (G) ILC3 signature genes defined by Robinette et al. (64), * indicates significant differences in expression between WT and FOXO1,3ΔVav preNKP (FDR < 0.05, >2-fold change). (H) Representative flow cytometry profiles showing the identification of ILC subsets in BM from WT and FOXO1,3ΔVav mice. (I) Total number of indicated ILC subsets in BM, spleen and thymus from WT and FOXO1,3ΔVav mice (n = 6-12). NKp46- ILC3 population had less than 50 cells per thymus in all mice from both mouse strains so was not shown. Dots represent individual analyzed animals. Bars indicate mean and SD. P-values were calculated using Mann-Whitney tests with *, ** and *** indicates p-values <0.05, <0.01 and <0.001 respectively.

References

    1. Ouyang W, Li MO. Foxo: In Command of T Lymphocyte Homeostasis and Tolerance. Trends Immunol (2011) 32(1):26–33. doi: 10.1016/j.it.2010.10.005 - DOI - PMC - PubMed
    1. Lin K, Dorman JB, Rodan A, Kenyon C. Daf-16: An HNF-3/Forkhead Family Member That Can Function to Double the Life-Span of Caenorhabditis Elegans. Science (1997) 278(5341):1319–22. doi: 10.1126/science.278.5341.1319 - DOI - PubMed
    1. Salih DA, Brunet A. FoxO Transcription Factors in the Maintenance of Cellular Homeostasis During Aging. Curr Opin Cell Biol (2008) 20(2):126–36. doi: 10.1016/j.ceb.2008.02.005 - DOI - PMC - PubMed
    1. Brunet A, Bonni A, Zigmond MJ, Lin MZ, Juo P, Hu LS, et al. Akt Promotes Cell Survival by Phosphorylating and Inhibiting a Forkhead Transcription Factor. Cell (1999) 96(6):857–68. doi: 10.1016/S0092-8674(00)80595-4 - DOI - PubMed
    1. Dijkers PF, Medema RH, Pals C, Banerji L, Thomas NS, Lam EW, et al. Forkhead Transcription Factor FKHR-L1 Modulates Cytokine-Dependent Transcriptional Regulation of P27(KIP1). Mol Cell Biol (2000) 20(24):9138–48. doi: 10.1128/MCB.20.24.9138-9148.2000 - DOI - PMC - PubMed

Publication types

MeSH terms