. 2022 Mar 10;2(3):100115.
doi: 10.1016/j.xjidi.2022.100115. eCollection 2022 May.

Multiomic Analysis of the Gut Microbiome in Psoriasis Reveals Distinct Host‒Microbe Associations

Affiliations

Multiomic Analysis of the Gut Microbiome in Psoriasis Reveals Distinct Host‒Microbe Associations

Hsin-Wen Chang et al. JID Innov. .

Abstract

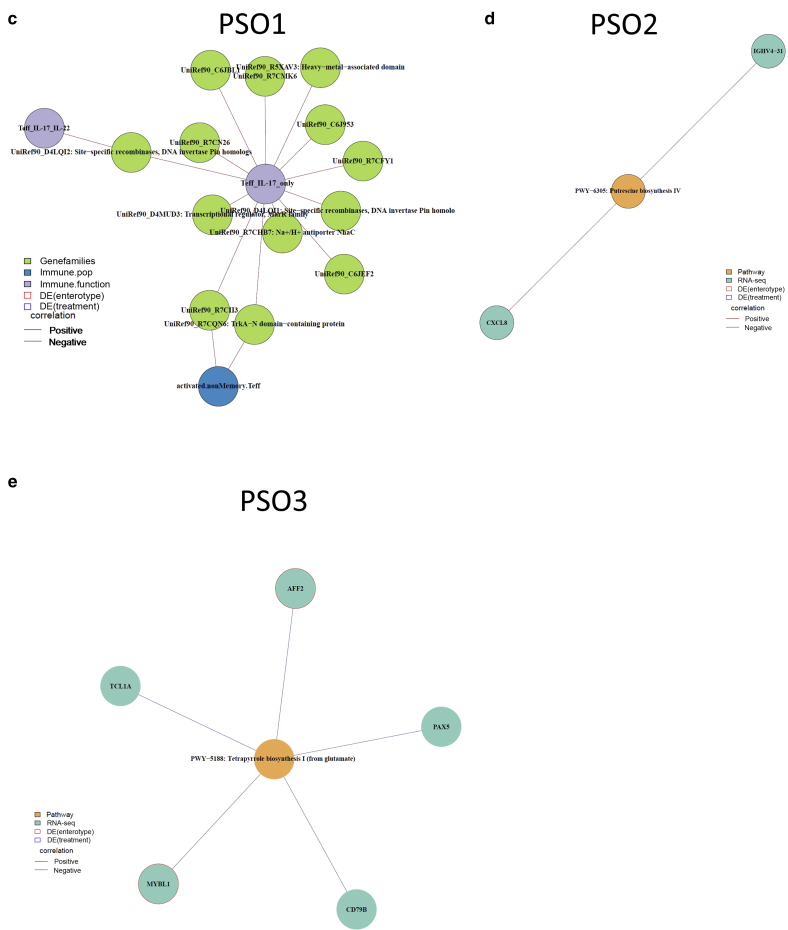
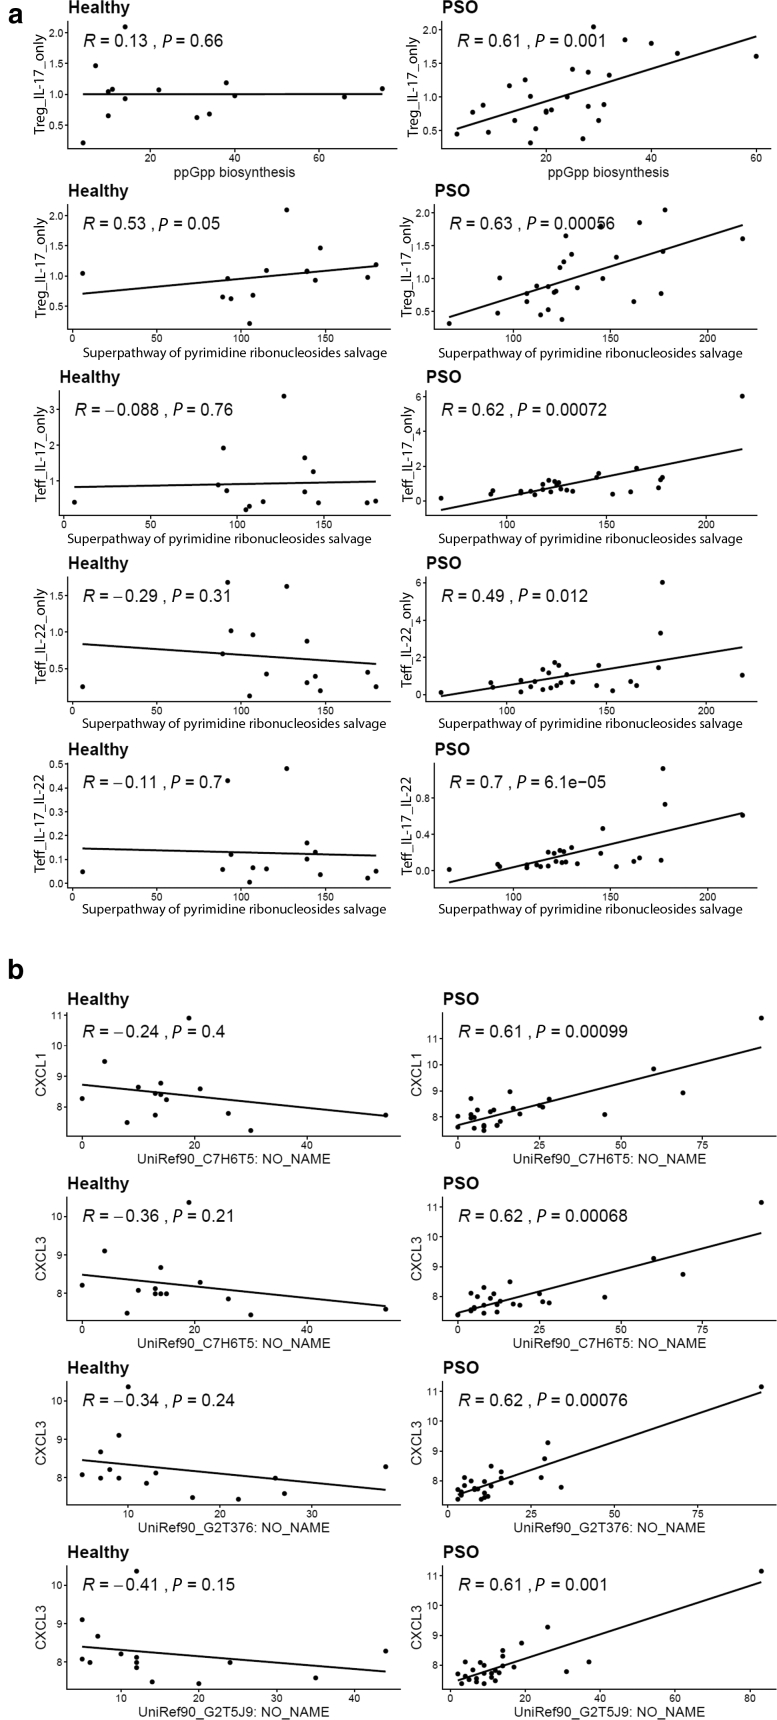
Psoriasis is a chronic, inflammatory skin disease that affects 2‒3% of the global population. Besides skin manifestations, patients with psoriasis have increased susceptibility to a number of comorbidities, including psoriatic arthritis, cardiovascular disease, and inflammatory bowel disease. To understand the systemic component of psoriasis pathogenesis, we performed a pilot study to examine the fecal metagenome, host colonic transcriptome, and host peripheral blood immune profiles of patients with psoriasis and healthy controls. Our study showed increased functional diversity in the gut microbiome of patients with psoriasis. In addition, we identified microbial species that preferentially associate with patients with psoriasis and which have been previously found to associate with other autoimmune diseases. Intriguingly, our data revealed three psoriasis subgroups that have distinct microbial and host features. Integrating these features revealed host‒microbe associations that are specific to psoriasis or particular psoriasis subgroups. Our findings provide insight into the factors that may affect the development of comorbidities in patients with psoriasis and may hold diagnostic potential for early identification of patients with psoriasis at risk for these comorbidities.

Keywords: IBD, inflammatory bowel disease; RNA-seq, RNA sequencing.


Figures

Figure 1
Figure 1
Multiomic study design. In this study, we collected six different datasets for multiomic analysis: shotgun metagenomic sequencing from stool samples generated profiles of (i) microbial species, (ii) microbial gene families, and (iii) microbial gene pathways. RNA-seq from sigmoid colon biopsies generated (iv) host colonic transcriptome data. Flow cytometry analyses from PBMCs generated (v) immune population profiles and (vi) cytokine production profiles. The datasets measuring microbial features are in the green box, and the datasets measuring host features are in the yellow box. Stool samples were collected from 15 healthy subjects and 33 patients with psoriasis. Sigmoid colon biopsies and PBMCs were collected from 16 healthy subjects and 26 patients with psoriasis. A total of 14 healthy subjects and 26 patients with psoriasis had six fully complete datasets. RNA-seq, RNA sequencing.
Figure 2
Figure 2
Microbial features associated with PSO and healthy subjects. Boxplots compare alpha diversities of gut microbiome in patients with PSO and those in the healthy subjects. Alpha diversity was measured by Shannon index, Simpson diversity index, and chao1 estimation for (a) microbial Uniref90 gene families. Statistical significance was determined by Wilcoxon test. (b) Dot plot summary of DA microbial species identified by DEseq2. Each dot represents a DA microbial species with dot size‒present adjusted P-value, and x-axis represents log2 fold change. (c) Boxplots of select DA microbial species. Blue boxes represent PSO sample, and red boxes represent healthy samples. ∗∗P < 0.01. adj, adjusted; DA, differential abundant; n.s., not significant; PSO, psoriasis.
Figure 3
Figure 3
PSO subgroups identified by a differential abundance of microbial gene families. (a) The hierarchical cluster dendrogram shows the membership of all samples in this cohort. The colored boxes represent the grouping of each sample into three distinct groups. The red box depicts group 1, the blue box depicts group 2, and the green box depicts group 3. The red dotted line represents where the tree is cut to derive the three subgroups. The AU bootstrap confidence scores and BP values are represented in red and green, respectively, at the major branches. (b) The stacked bar plot represents the distribution of disease status of the three groups identified by cluster analysis. The height of each bar represents the size of each group, and the color represents the disease status, with red for healthy subjects and blue for PSO samples. (c) Heatmap of microbial and host features associated with each PSO subgroup. Columns represent PSO subgroups, and rows represents microbial features identified from shotgun metagenomics or host features from colonic RNA-seq. Differential abundance microbial features with nonzero counts for at least 10 samples were plotted on the heatmap to exclude features with high dropout rates. The color of each cell represents the average abundance and is scaled by means of the features. The data type of each feature is indicated in the side bar: pink represents microbial species, blue represents microbial pathway, and yellow represents host GEx. AU, arbitrary unit; BP, bootstrap probability; GEx, gene expression; PSO, psoriasis; RNA-seq, RNA sequencing.
Figure 4
Figure 4
PSO subgroup‒specific microbial and host features. (a) Boxplots show differences in sigmoid colon immune cell compositions deconvoluted by CIBERSORTx between different PSO subgroups. (b) Boxplots showing circulating host immune responses measured by flow cytometry. The statistical significance in boxplots was determined by Wilcox test on pairwise comparison of each group of interest. P-values were depicted by symbols: ∗∗∗∗P < 0.0001, ∗∗∗P < 0.001, ∗∗P < 0.01, and P < 0.05. Comparisons with P > 0.05 are not shown. PSO, psoriasis; Teff, effector T cell.
Figure 5
Figure 5
Correlations between microbial features and psoriasis-related clinical features. Dot plot summarizes the correlation between microbial features and disease parameters of PASI scores and disease duration. Each dot represents a significant correlation between a disease parameter and a microbial feature. The direction and strength of the correlation are presented by dot color (red represents positive correlation, and blue represents negative correlation). The dot size represents false discovery rate‒adjusted P-values. adj, adjusted; corr., correlation value; Dz, disease.
Figure 6
Figure 6
Multiomic networks associated with PSO and PSO-specific subgroups. (a) Overview of multiomic networks within healthy subjects, patients with PSO, and each PSO subgroup. Each node represents a microbial or host feature, and each edge represents a significant association between the two nodes. The color of nodes represents the measurement type of the node. Host‒microbe modules are identified using greedy optimization of modularity. (b) PSO-specific modules associate microbial features with circulating IL-17 production. (c‒e) PSO subgroup‒specific modules are also identified in each PSO-specific subgroup. For each module, the color of nodes represents the measurement type of the node, and the color of edges indicates the direction of the correlation (red edges represent positive associations, and blue edges represent negative associations). DE, differentially expressed; PSO, psoriasis; RNA-seq, RNA sequencing.
Figure 6
Figure 6
Multiomic networks associated with PSO and PSO-specific subgroups. (a) Overview of multiomic networks within healthy subjects, patients with PSO, and each PSO subgroup. Each node represents a microbial or host feature, and each edge represents a significant association between the two nodes. The color of nodes represents the measurement type of the node. Host‒microbe modules are identified using greedy optimization of modularity. (b) PSO-specific modules associate microbial features with circulating IL-17 production. (c‒e) PSO subgroup‒specific modules are also identified in each PSO-specific subgroup. For each module, the color of nodes represents the measurement type of the node, and the color of edges indicates the direction of the correlation (red edges represent positive associations, and blue edges represent negative associations). DE, differentially expressed; PSO, psoriasis; RNA-seq, RNA sequencing.
Supplementary Figure S1
Microbial diversity metrics. (a) Boxplot comparing the alpha diversity of gut microbiome in patients with PSO and healthy subjects. Alpha diversity was measured by Shannon index, Simpson diversity index, and chao1 estimation for microbial species. PCoA of the microbial community structures based on Bray‒Curtis distance matrix for (b) microbial species and (c) microbial gene families. (d) PCA of host transcriptome by top 5,000 most variable genes. In all plots, red denotes healthy samples, and blue denotes PSO samples. n.s., not significant; PC, principal component; PCA, principal component analysis; PCoA, principal coordinate analysis; PSO, psoriasis; RNA-seq, RNA sequencing.
Supplementary Figure S2
Bray-Curtis analysis. (a) Gap statistics calculated using Bray‒Curtis and Euclidean dissimilar matrix of the DA UniRef90 gene families with bootstrapping for 1,000 times. (b) PCoA plot shows the Bray‒Curtis dissimilarity matrix of the DA UniRef90 gene families grouped the cohort into three groups that are similar to the grouping defined by hierarchical clustering (as represented by the color of each point). The shapes represent the disease status (round circles depict healthy samples, and triangles depict PSO samples). DA, differentially abundant; DE, differentially expressed; maxSE, maximum numeric vector of function values; PCoA, principal coordinate analysis; PSO, psoriasis.
Supplementary Figure S3
Comparisons of metadata and microbial diversity in the three subgroups identified in the cohort. Only subjects with a complete dataset from the three measurement types are included. (a‒c) Comparisons of BMI, age, and gender in the three groups. (d‒f) Comparisons of PASI, disease onset, and disease duration in each PSO subgroup. (g, h) Comparison of diet scores and self-reported joint pain or swelling in the three groups. Comparisons of observed microbial, Shannon index, and Simpson diversity index in the three groups for (i) microbial species, (j) UniRef90 gene families, and (k) MetaCyc pathway. BMI, body mass index; Dz, disease; F, female; M, male; n.s., not significant; PSO, psoriasis; y, year.
Supplementary Figure S4
PSO-specific correlations between microbial functions and proinflammatory host response. (a) Scatter plots show positive correlations between microbial MetaCyc pathways and IL-17 production in psoriatic PBMCs but not in healthy PBMCs. (b) Scatter plots show a positive correlation between microbial UniRef90 gene families with the colonic expression of CXCL1 and CXCL3 in patients with PSO but not in healthy control. The correlations were calculated by Spearman’s rank-order correlation. PSO, psoriasis; Teff, effector T cell; Treg, regulatory T cell.
Supplementary Figure S5
Representative flow cytometry gating for identifying various cell populations. (a) Cell populations (CD4+ Teff, CD4+ Treg, CD8+ T cell, γδ T cell, and innate lymphoid cells) and (b) their memory and activation state. APC, allophycocyanin; FSC-A, forward scatter area; FSC-H, forward scatter height; K, thousand; PE, phycoerythrin; Q, quadrant; SSC-A, side scatter area; Teff, effector T cell; Treg, regulatory T cell.
Supplementary Figure S6
Representative flow cytometry gating for measuring cytokine production in various cell populations after 4 hours of PMA and ionomycin stimulation. (a) Gating strategies for identification of Teff, Treg, CD8+ T cells, and γδ T cells. (b) Gating strategies for measuring the production of IL-17A, IL-22, TNF-α, and IFNγ. APC, allophycocyanin; FSC-A, forward scatter area; FSC-H, forward scatter height; K, thousand; PMA, phorbol myristate acetate; Teff, effector T cell; Treg, regulatory T cell; vs. versus.

References

    1. Afifi L., Danesh M.J., Lee K.M., Beroukhim K., Farahnik B., Ahn R.S., et al. Dietary behaviors in psoriasis: patient-reported outcomes from a U.S. National survey. Dermatol Ther (Heidelb) 2017;7:227–242. - PMC - PubMed
    1. Arumugam M., Raes J., Pelletier E., Le Paslier D., Yamada T., Mende D.R., et al. Enterotypes of the human gut microbiome [published corrections appear in Nature 2014;506:516 and Nature 2011;474:666] Nature. 2011;473:174–180. - PMC - PubMed
    1. Benhadou F., Mintoff D., Schnebert B., Thio H.B. Psoriasis and microbiota: a systematic review. Diseases. 2018;6:47. - PMC - PubMed
    1. Brembilla N.C., Senra L., Boehncke W.-H. The IL-17 Family of cytokines in psoriasis: IL-17A and beyond. Front Immunol. 2018;9:1682. - PMC - PubMed
    1. Chang H.W., Yan D., Singh R., Liu J., Lu X., Ucmak D., et al. Alteration of the cutaneous microbiome in psoriasis and potential role in Th17 polarization. Microbiome. 2018;6:154. - PMC - PubMed