. 2022 Jul 6;13(13):1992-2005.
doi: 10.1021/acschemneuro.2c00222. Epub 2022 Jun 27.

Dysregulation of Neuropeptide and Tau Peptide Signatures in Human Alzheimer's Disease Brain

Affiliations

Dysregulation of Neuropeptide and Tau Peptide Signatures in Human Alzheimer's Disease Brain

Sonia Podvin et al. ACS Chem Neurosci. .

Abstract

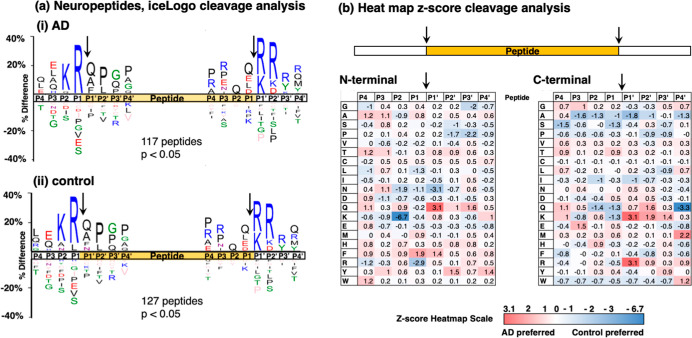
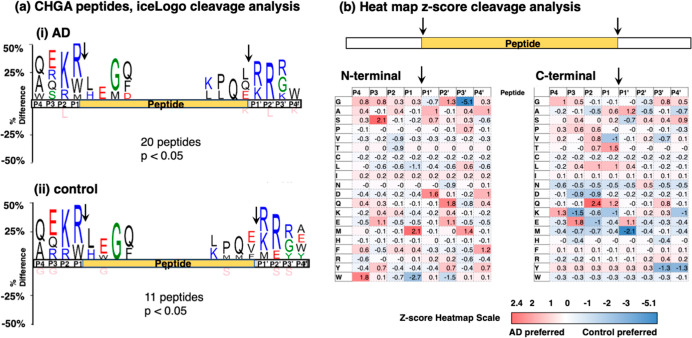
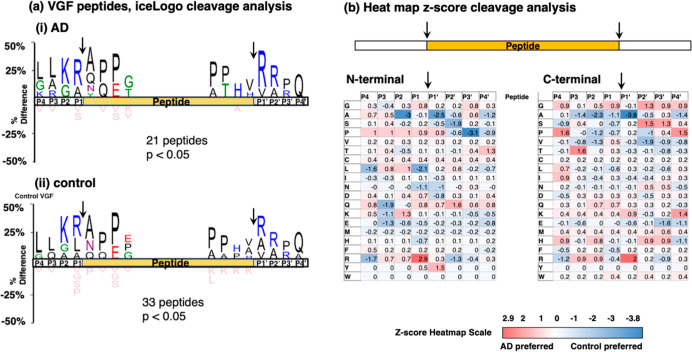
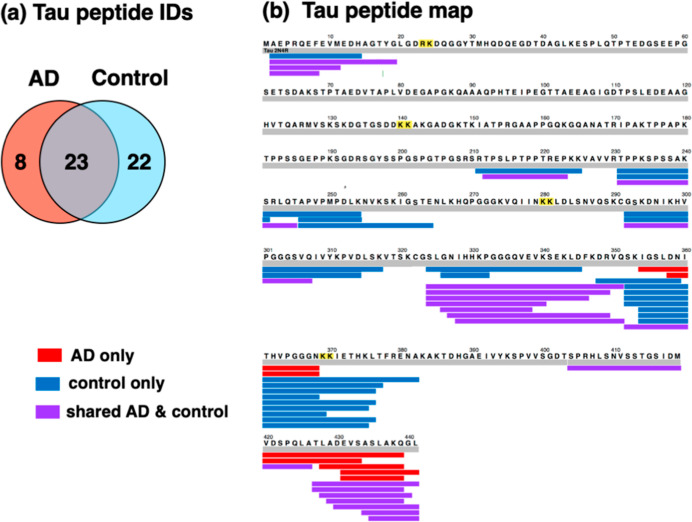
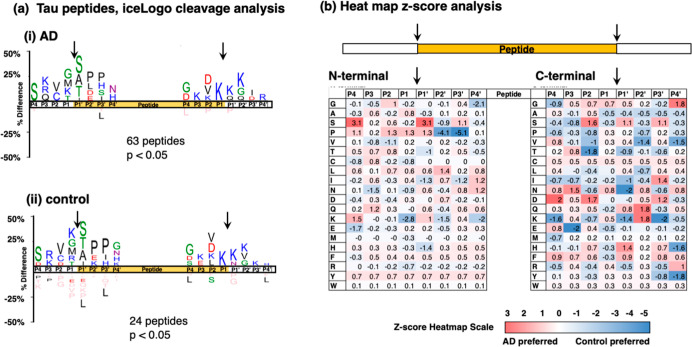
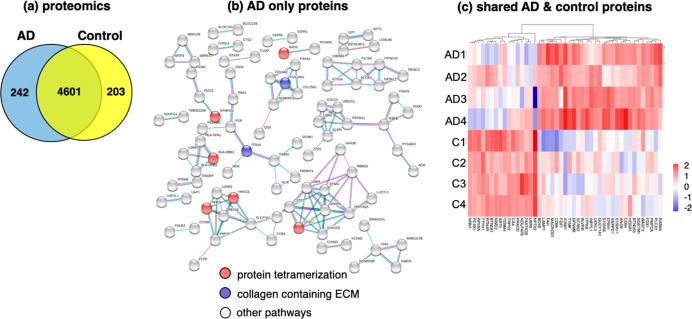
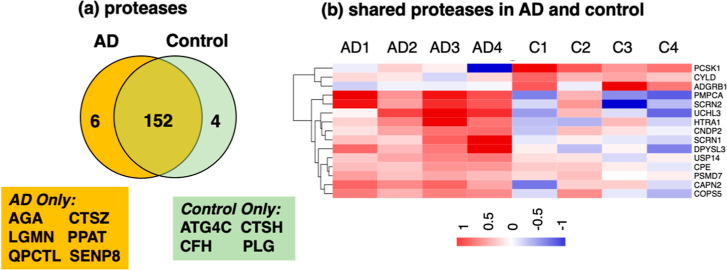
Synaptic dysfunction and loss occur in Alzheimer's disease (AD) brains, which results in cognitive deficits and brain neurodegeneration. Neuropeptides comprise the major group of synaptic neurotransmitters in the nervous system. This study evaluated neuropeptide signatures that are hypothesized to differ in human AD brain compared to age-matched controls, achieved by global neuropeptidomics analysis of human brain cortex synaptosomes. Neuropeptidomics demonstrated distinct profiles of neuropeptides in AD compared to controls consisting of neuropeptides derived from chromogranin A (CHGA) and granins, VGF (nerve growth factor inducible), cholecystokinin, and others. The differential neuropeptide signatures indicated differences in proteolytic processing of their proneuropeptides. Analysis of cleavage sites showed that dibasic residues at the N-termini and C-termini of neuropeptides were the main sites for proneuropeptide processing, and data also showed that the AD group displayed differences in preferred residues adjacent to the cleavage sites. Notably, tau peptide signatures differed in the AD compared to age-matched control human brain cortex synaptosomes. Unique tau peptides were derived from the tau protein through proteolysis using similar and differential cleavage sites in the AD brain cortex compared to the control. Protease profiles differed in the AD compared to control, indicated by proteomics data. Overall, these results demonstrate that dysregulation of neuropeptides and tau peptides occurs in AD brain cortex synaptosomes compared to age-matched controls, involving differential cleavage site properties for proteolytic processing of precursor proteins. These dynamic changes in neuropeptides and tau peptide signatures may be associated with the severe cognitive deficits of AD.

Keywords: Alzheimer’s disease; neuropeptides; neurotransmission; peptidomics; proteomics; tau.


Conflict of interest statement

The authors declare no competing financial interest.

Figures

Figure 1
Figure 1
Workflow for neuropeptidomics and proteomics analyses of synaptosomes isolated from AD and age-matched control brain cortex. Brain cortex tissues from AD and age-matched controls were subjected to gentle homogenization and differential centrifugation for isolation of synaptic nerve terminals as synaptosome preparations. Low-MW peptides were obtained by filtration through a 10 kDa membrane for peptidomics analysis of endogenous peptides and neuropeptides, and retained proteins were digested with trypsin for proteomics analysis. After nano-LC–MS/MS tandem mass spectrometry of samples, bioinformatics by PEAKS provided identification and quantitation of peptides. Neuropeptides within the peptidomics data set were searched via the NeuroPedia database of neuropeptides to compile synaptic neuropeptidomics data. Proteomics data were assessed for protease components by searching the MEROPS protease database and evaluated for protein networks by STRINGdb and GO.
Figure 2
Figure 2
Distinct and shared neuropeptides in synaptosomes from AD and control brain cortex. (a) Identified neuropeptides. The unique neuropeptides identified in AD and control synaptosomes were compared with respect to the numbers of neuropeptides present only in the AD group, present in only the control group, and shared by both groups, as shown by the Venn diagram. (b) Identified and quantitated neuropeptides. The identified and quantitated neuropeptides in AD and control groups were compared with respect to the neuropeptides present in only AD or only in the control and shared neuropeptides present in both groups, as shown by the Venn diagram. (c) Neuropeptide precursors. The proneuropeptide precursors identified by proteomics data are illustrated with respect to relative abundance of peptides derived from each of the precursors. AD and control groups were compared by the illustrated pie charts.
Figure 3
Figure 3
Peptides derived from chromogranin A (CHGA), chromogranin B (CHGB), and VGF (nerve growth factor inducible) in synaptosomes from AD compared to control brain cortex. Neuropeptides derived from the proneuropeptides of CHGA (panel a), CHGB (panel b), and VGF (panel c) are shown with respect to those identified in AD and control groups in Venn diagrams.
Figure 4
Figure 4
Mapping of peptides derived from CHGA and VGF in synaptosomes from AD compared to control brain cortex. (a) CHGA-derived neuropeptides. Peptide mapping shows the neuropeptides derived from the CHGA proneuropeptide. (b) VGF-derived neuropeptides. Peptide mapping shows the neuropeptides derived from the VGF proneuropeptide. For panels (a,b), the color-coded peptides indicate those present in only AD (red), present in only the control (blue), and shared by both AD and control synaptosomes (purple).
Figure 5
Figure 5
Cleavage site analysis for neuropeptide production from proneuropeptides in AD compared to control synaptosomes from brain cortex. (a) IceLogo analysis. IceLogo illustrates the relative frequencies of amino acids at the P4 to P4′ positions at N-terminal and C-terminal cleavages of neuropeptides within precursors that are utilized to generate neuropeptides in the AD (panel i) and control (panel ii) groups. Color codes for amino acids indicate acidic residues in red, basic residues in blue, polar residues in green, nonpolar residues in black, asparagine in purple, and residues never found in pink. (b) Heatmap comparison of preferred residues at N-termini and C-termini of neuropeptides within the proneuropeptide precursors. The heatmap illustrates z-scores (calculated as explained in the methods) that indicate the frequency of amino acid residues at P4 to P4′ positions of cleavage sites at N-termini and C-termini within proneuropeptides of neuropeptides in AD compared to control synaptosomes.
Figure 6
Figure 6
Cleavage site analysis of CHGA-derived neuropeptides in AD compared to control brain synaptosomes. (a) IceLogo analysis. IceLogo shows the relative frequencies of residues at the P4 to P4′ positions of N- and C-terminal cleavages of neuropeptides derived from CHGA in AD (panel i) and control (panel ii) synaptosomes. Color codes for amino acids indicate acidic residues in red, basic residues in blue, polar residues in green, nonpolar residues in black, asparagine in purple, and residues never found in pink. (b) Heatmap comparison of preferred residues at N- and C-termini of neuropeptides within CHGA. The heatmap shows z-scores that indicate the frequency of amino acid residues at P4 to P4′ positions of cleavage sites at N-termini and C-termini of neuropeptides within CHGA.
Figure 7
Figure 7
VGF peptide cleavage site analysis in AD compared to controls. (a) IceLogo analysis. IceLogo shows the relative frequencies of residues at the P4 to P4′ positions of N- and C-terminal cleavages of neuropeptides derived from VGF in AD (panel i) and control (panel ii) synaptosomes. Color codes for amino acids indicate acidic residues in red, basic residues in blue, polar residues in green, nonpolar residues in black, asparagine in purple, and residues never found in pink. (b) Heatmap comparison of preferred residues at N- and C-termini of neuropeptides within VGF. The heatmap shows z-scores that indicate the frequency of amino acid residues at P4 to P4′ positions of cleavage sites at N-termini and C-termini of neuropeptides within VGF.
Figure 8
Figure 8
Distinct and shared tau peptides in synaptosomes from AD and control brain cortex. (a) Tau peptides identified in AD and control synaptosomes. The Venn diagram of the tau peptides identified in AD and control synaptosomes illustrates tau peptides present in only AD, only in the control, and shared in both AD and control groups. (b) Tau peptide mapping derived from the tau protein. Mapping of tau peptides derived from the tau protein are shown for those present only in AD (red), present only in the control (blue), and shared in both AD and control groups (purple).
Figure 9
Figure 9
Cleavage site analysis of tau peptides derived from tau protein in AD compared to controls. (a) IceLogo analysis. IceLogo shows the relative frequencies of residues at the P4 to P4′ positions of N- and C-terminal cleavages of neuropeptides derived from the tau protein in AD (panel i) and control (panel ii) synaptosomes. Color codes for amino acids indicate acidic residues in red, basic residues in blue, polar residues in green, nonpolar residues in black, asparagine in purple, and residues never found in pink. (b) Heatmap comparison of preferred residues at N- and C-termini of neuropeptides within the tau protein. The heatmap shows z-scores that indicate the frequency of amino acid residues at P4 to P4′ positions of cleavage sites at N-termini and C-termini of tau peptides derived from the tau protein.
Figure 10
Figure 10
Proteomics reveals distinct and shared proteins in synaptosomes from AD compared to control brain cortex. (a) Proteins identified in AD and control synaptosomes. The Venn diagram shows proteins present in only AD, present in only the control, and shared by both AD and control synaptosomes. (b) Protein interaction network analysis of proteins present only in AD synaptosomes. Proteins present in only the AD group were assessed for predicted protein interaction networks evaluated by STRINGdb and GO. (c) Proteins shared by AD and control synaptosomes display upregulation and downregulation. Quantitation of the shared proteins was assessed for the ratio of log2(AD/control with significance of p < 0.05) to compare protein levels in the AD compared to control group. Upregulated proteins in AD are shown in red (compared to the control), and downregulated proteins are shown in blue (compared to the control).
Figure 11
Figure 11
Proteases in synaptosomes from AD compared to control brain cortex. (a) Proteases in AD and control synaptosomes. Protease components of proteomics data were assessed by search of the protease MEROPS database. Comparison of proteases in AD and control groups is illustrated by the Venn diagram which shows proteases present in only the AD group, present in only the control group, and shared by both AD and control synaptosomes. (b) Upregulated and downregulated proteases in AD compared to controls. Quantitation of the shared proteases was assessed for the ratio of log2(AD/control with significance of p < 0.05) to compare protease levels in the AD and control groups. Upregulated proteins in AD are shown in red (compared to the control), and downregulated proteins are shown in blue (compared to the control).

Similar articles

Cited by

References

    1. Masliah E. Mechanisms of synaptic dysfunction in Alzheimer’s disease. Histol. Histopathol. 1995, 10, 509–519. - PubMed
    1. Pei Y.; Davies J.; Zhang M.; Zhang H.-T. The Role of Synaptic Dysfunction in Alzheimer’s Disease. J. Alzheimer’s Dis. 2020, 76, 49–62. 10.3233/jad-191334. - DOI - PubMed
    1. Cuestas Torres D. M.; Cardenas F. P. Synaptic plasticity in Alzheimer’s disease and healthy aging. Rev. Neurosci. 2020, 31, 245–268. 10.1515/revneuro-2019-0058. - DOI - PubMed
    1. Selkoe D. J. Alzheimer’s disease is a synaptic failure. Science 2002, 298, 789–791. 10.1126/science.1074069. - DOI - PubMed
    1. Palop J. J.; Mucke L. Amyloid-β-induced neuronal dysfunction in Alzheimer’s disease: from synapses toward neural networks. Nat. Neurosci. 2010, 13, 812–818. 10.1038/nn.2583. - DOI - PMC - PubMed

Publication types