. 2022 Jun 24;38(Suppl 1):i169-i176.
doi: 10.1093/bioinformatics/btac244.

The minimizer Jaccard estimator is biased and inconsistent

Affiliations

The minimizer Jaccard estimator is biased and inconsistent

Mahdi Belbasi et al. Bioinformatics. .

Abstract

Motivation: Sketching is now widely used in bioinformatics to reduce data size and increase data processing speed. Sketching approaches entice with improved scalability but also carry the danger of decreased accuracy and added bias. In this article, we investigate the minimizer sketch and its use to estimate the Jaccard similarity between two sequences.

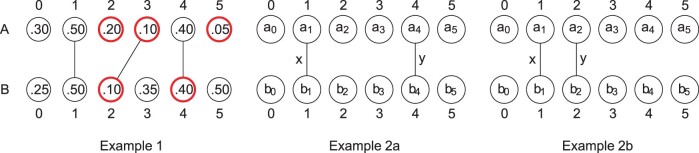
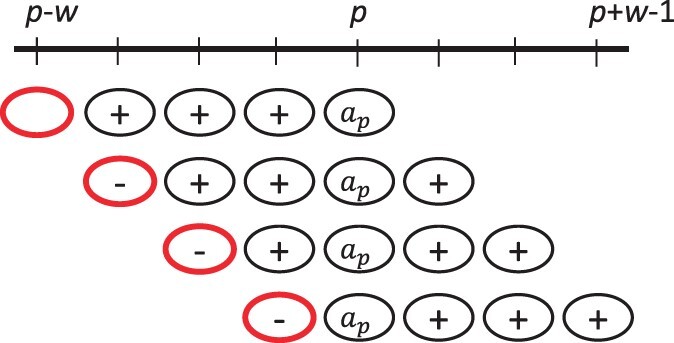
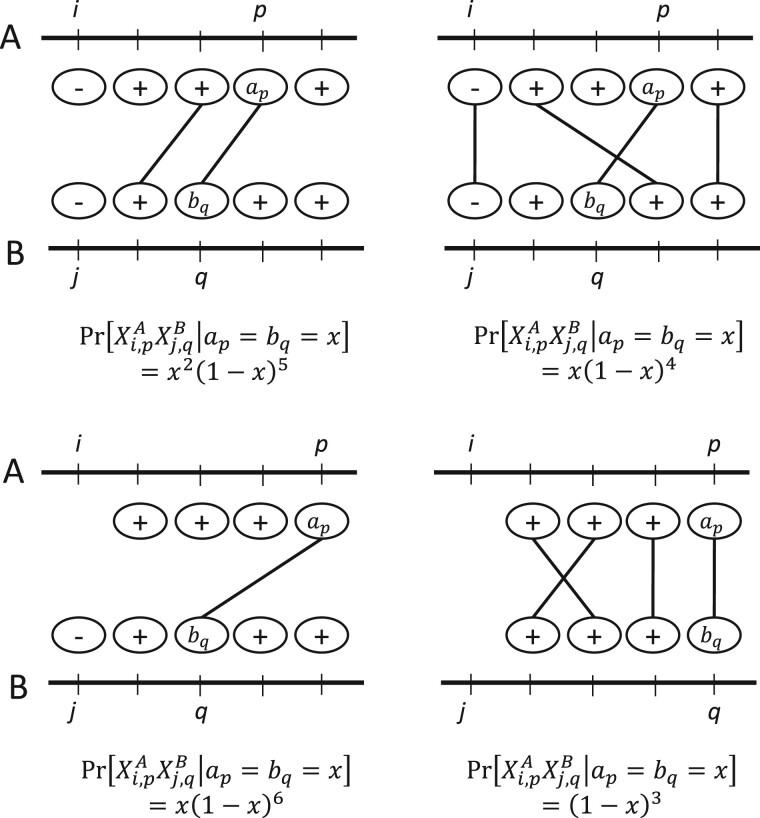
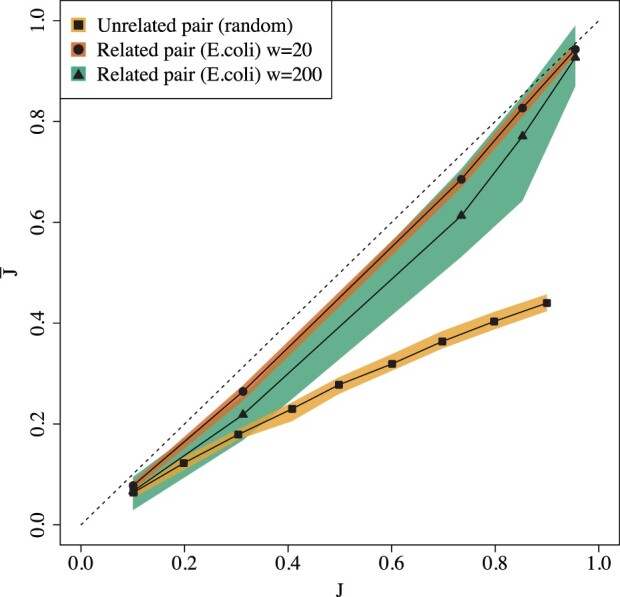
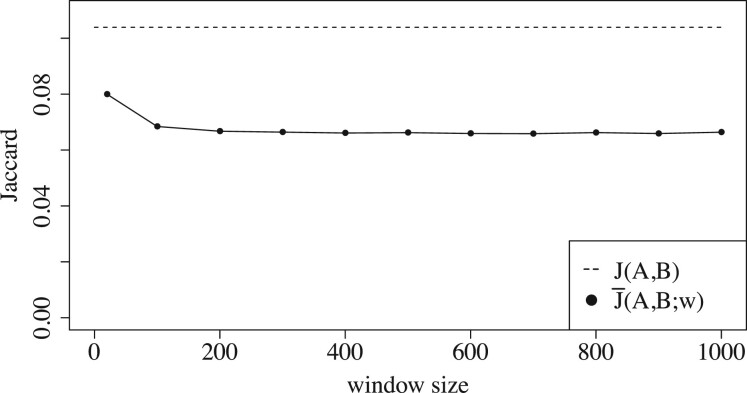
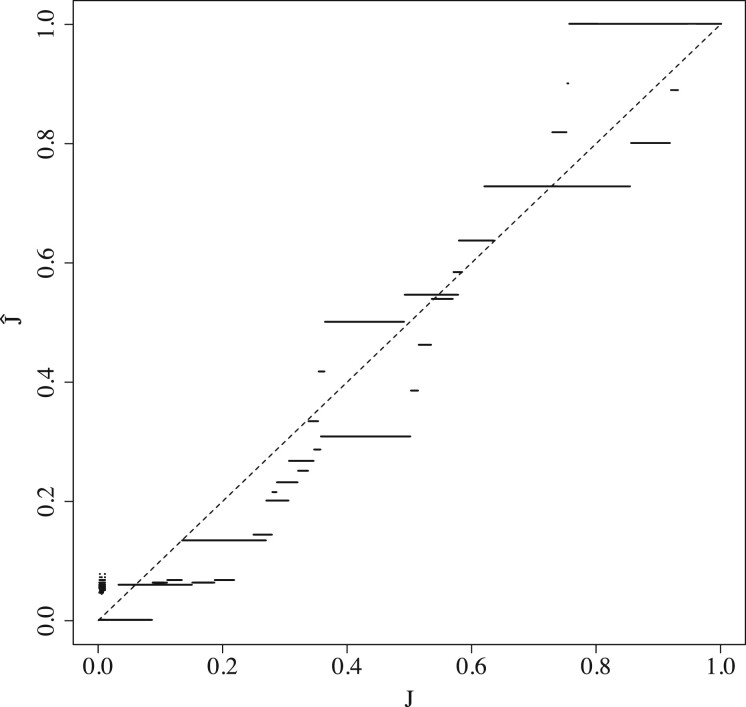
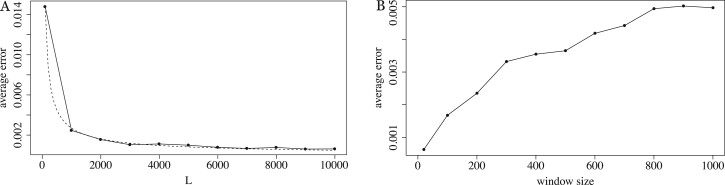
Results: We show that the minimizer Jaccard estimator is biased and inconsistent, which means that the expected difference (i.e. the bias) between the estimator and the true value is not zero, even in the limit as the lengths of the sequences grow. We derive an analytical formula for the bias as a function of how the shared k-mers are laid out along the sequences. We show both theoretically and empirically that there are families of sequences where the bias can be substantial (e.g. the true Jaccard can be more than double the estimate). Finally, we demonstrate that this bias affects the accuracy of the widely used mashmap read mapping tool.

Availability and implementation: Scripts to reproduce our experiments are available at https://github.com/medvedevgroup/minimizer-jaccard-estimator/tree/main/reproduce.

Supplementary information: Supplementary data are available at Bioinformatics online.


Figures

Fig. 1
Fig. 1
Examples of the Jaccard and the minimizer Jaccard estimator. Each example shows the k-mers of a sequence A on top, the k-mers of a sequence B on the bottom and lines connecting k-mers show the k-mer-matching between A and B. Each k-mer is labeled by its hash value. In Example 1, J(A,B)=1/3. The minimizers for w =3 are circled in bold red. Here, I^(A,B;3)=1,U^(A,B;3)=4, and J^(A,B;3)=1/4. Examples 2a and 2b give intuition for why the minimizer Jaccard estimator is biased. Here, ai refers to the hash value assigned to position i and x and y are k-mers shared between A and B. The expected minimizer Jaccard for w =2 is different in the two examples but the Jaccard is not (J =0.2); hence the expected minimizer Jaccard cannot be equal to the true Jaccard. (A color version of this figure appears in the online version of this article.)
Fig. 2
Fig. 2
Illustration of charging. Each row shows a possible way that position p can charge an index, with w =4. A minus sign indicates the value is less than ap, a plus sign indicates the value is larger than ap and no sign indicates that it does not matter. The circle at the index that is charged is shown in bold red. Note that no two rows are compatible with each other, i.e. every row pair contains a column with both a plus and a minus. As a result, the index that gets charged is unique. (A color version of this figure appears in the online version of this article.)
Fig. 3
Fig. 3
Some examples of Pr[Xi,pAXj,qB=1|ap=bq=x], with w =4. The two horizontal lines correspond to sequences A and B, and a circle corresponds to a k-mer whose value is relevant to the probability. The lines between A and B show the k-mer-matching, i.e. they indicate that the corresponding k-mers are the same. A plus or minus sign at a position reflects that the hash value must be greater or less than x, respectively.
Fig. 4
Fig. 4
Empirical bias for unrelated and related sequence pairs. For the unrelated pairs, we used w =20 and k =8 for J.4 and k =7 for J.3. For related pairs, we set k =16, w{20,200}, L =10 000, and r1{.001,.005,.01,.05,.1}, with one mutation replicate. The colored bands show the 2.5th and the 97.5th percentiles. The dashed line shows the expected behavior of an unbiased estimator, with J¯=J.
Fig. 5
Fig. 5
The effect of w on the empirical bias for a pair of related sequences as a function of the window size. Here, r1=0.1, L =10 000, k =16, w{20,100,200,,1000}, and there are 50 mutation replicates.
Fig. 6
Fig. 6
The empirical bias that occurs during a mapping process. Each point represents a comparison of a read A against a putative mapping location B. Note that the points visually blur into lines. We used k =16 and window size w =200 to match the default of mashmap. One hash replicate was used.
Fig. 7
Fig. 7
The effect of the window size w and sequence length on the empirical error of Equation (3). In panel A, we use the related pair model with 50 mutation replicates, k =16, w =20, r1=0.1 and L{100,1000,2000,,10000}. The y-axis shows the error of B, averaged over the mutation replicates. The dashed line shows the best fit function of the form αLβ, computed using the nls function in R. The average J, over the mutation replicates, is between.101 and.106, and the average empirical bias ranged between –0.023 and –0.027, depending on L. In panel B, we use the related pair model with 50 mutation replicates, k =16, L =10 000, and w{20,100,200,,1000}. The average J is.104.

References

    1. Baker D.N., Langmead B. (2019) Dashing: fast and accurate genomic distances with hyperloglog. Genome Biol., 20, 1–12. - PMC - PubMed
    1. Blanca A. et al. (2021) The statistics of k-mers from a sequence undergoing a simple mutation process without spurious matches. J. Comput. Biol., 29, 155–168. https://www.liebertpub.com/doi/10.1089/cmb.2021.0431. - DOI - PMC - PubMed
    1. Broder A.Z. (1997) On the resemblance and containment of documents. In: Proceedings. Compression and Complexity of SEQUENCES 1997 (Cat. No. 97TB100171). IEEE, pp. 21–29.
    1. Chin C.-S., Khalak A. (2019) Human genome assembly in 100 minutes. bioRxiv, page 705616.
    1. Cormode G., Muthukrishnan S. (2004) An improved data stream summary: the count-min sketch and its applications. In: Latin American Symposium on Theoretical Informatics. Springer, pp. 29–38.

Publication types