

QuCo: quartet-based co-estimation of species trees and gene trees
- PMID: 35758818
- PMCID: PMC9235488
- DOI: 10.1093/bioinformatics/btac265
QuCo: quartet-based co-estimation of species trees and gene trees
Abstract
Motivation: Phylogenomics faces a dilemma: on the one hand, most accurate species and gene tree estimation methods are those that co-estimate them; on the other hand, these co-estimation methods do not scale to moderately large numbers of species. The summary-based methods, which first infer gene trees independently and then combine them, are much more scalable but are prone to gene tree estimation error, which is inevitable when inferring trees from limited-length data. Gene tree estimation error is not just random noise and can create biases such as long-branch attraction.
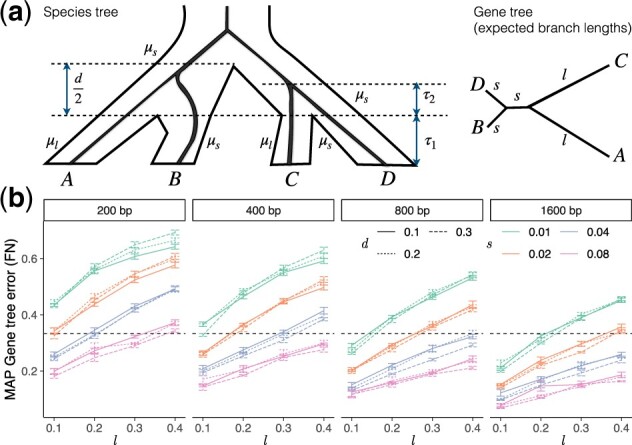
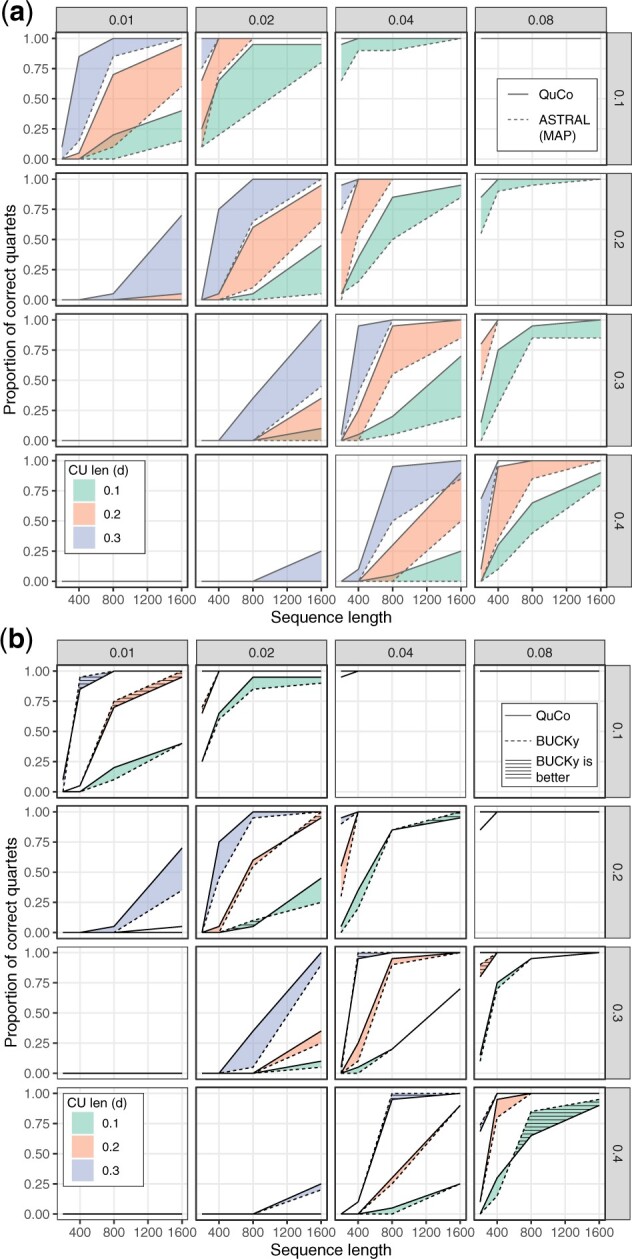
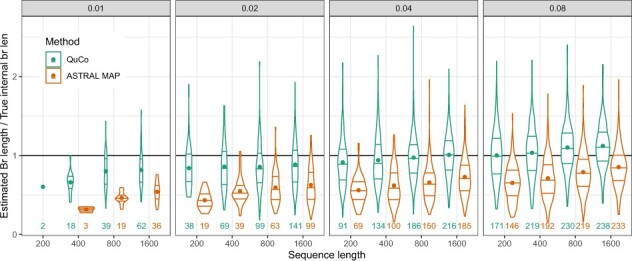
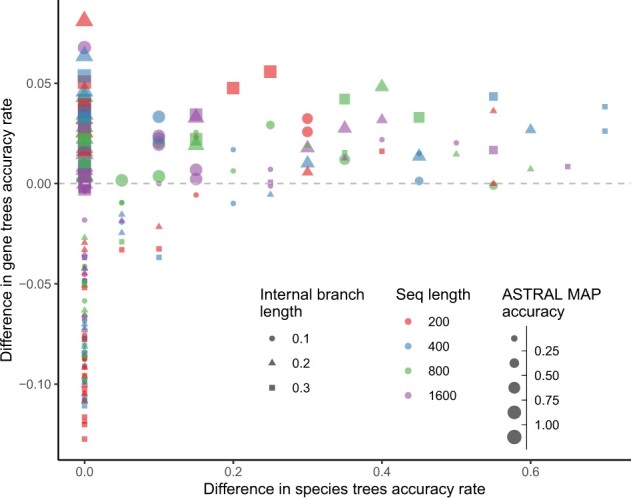
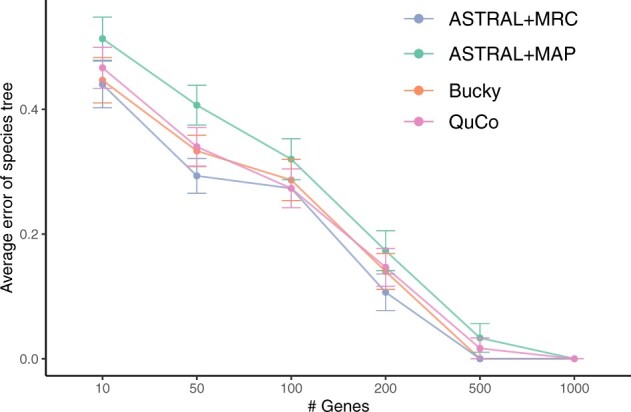
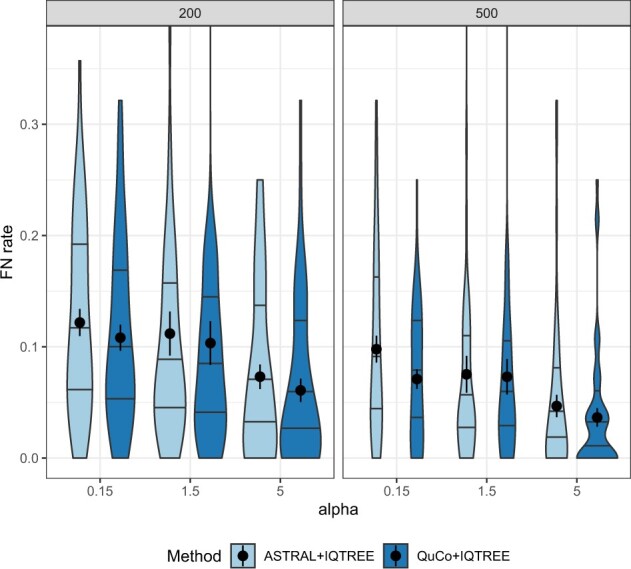
Results: We introduce a scalable likelihood-based approach to co-estimation under the multi-species coalescent model. The method, called quartet co-estimation (QuCo), takes as input independently inferred distributions over gene trees and computes the most likely species tree topology and internal branch length for each quartet, marginalizing over gene tree topologies and ignoring branch lengths by making several simplifying assumptions. It then updates the gene tree posterior probabilities based on the species tree. The focus on gene tree topologies and the heuristic division to quartets enables fast likelihood calculations. We benchmark our method with extensive simulations for quartet trees in zones known to produce biased species trees and further with larger trees. We also run QuCo on a biological dataset of bees. Our results show better accuracy than the summary-based approach ASTRAL run on estimated gene trees.
Availability and implementation: QuCo is available on https://github.com/maryamrabiee/quco.
Supplementary information: Supplementary data are available at Bioinformatics online.
© The Author(s) 2022. Published by Oxford University Press.
Figures
Similar articles
-
Theoretical and Practical Considerations when using Retroelement Insertions to Estimate Species Trees in the Anomaly Zone.Syst Biol. 2022 Apr 19;71(3):721-740. doi: 10.1093/sysbio/syab086. Syst Biol. 2022. PMID: 34677617
-
wQFM: highly accurate genome-scale species tree estimation from weighted quartets.Bioinformatics. 2021 Nov 5;37(21):3734-3743. doi: 10.1093/bioinformatics/btab428. Bioinformatics. 2021. PMID: 34086858
-
A comparative study of SVDquartets and other coalescent-based species tree estimation methods.BMC Genomics. 2015;16 Suppl 10(Suppl 10):S2. doi: 10.1186/1471-2164-16-S10-S2. Epub 2015 Oct 2. BMC Genomics. 2015. PMID: 26449249 Free PMC article.
-
PRANC: ML species tree estimation from the ranked gene trees under coalescence.Bioinformatics. 2020 Sep 15;36(18):4819-4821. doi: 10.1093/bioinformatics/btaa605. Bioinformatics. 2020. PMID: 32609371 Free PMC article.
-
Challenges in Species Tree Estimation Under the Multispecies Coalescent Model.Genetics. 2016 Dec;204(4):1353-1368. doi: 10.1534/genetics.116.190173. Genetics. 2016. PMID: 27927902 Free PMC article. Review.
References
-
- Allman E.S. et al. (2011) Identifying the rooted species tree from the distribution of unrooted gene trees under the coalescent. J. Math. Biol., 62, 833–862. - PubMed
-
- Ané C. et al. (2007) Bayesian estimation of concordance among gene trees. Mol. Biol. Evol., 24, 412–426. - PubMed
-
- Avni E. et al. (2015) Weighted quartets phylogenetics. Syst. Biol., 64, 233–242. - PubMed
-
- Bayzid M.S., Warnow T. (2013) Naive binning improves phylogenomic analyses. Bioinformatics, 29, 2277–2284. - PubMed
-
- Bossert S. et al. (2021) Gene tree estimation error with ultraconserved elements: an empirical study on Pseudapis bees. Syst. Biol., 70, 803–821. - PubMed
Publication types
MeSH terms
LinkOut - more resources
Full Text Sources
Other Literature Sources
