Randomized Controlled Trial
. 2022 Oct 5;12(10):2308-2329.
doi: 10.1158/2159-8290.CD-21-0925.

A Targetable Myeloid Inflammatory State Governs Disease Recurrence in Clear-Cell Renal Cell Carcinoma

Affiliations
Randomized Controlled Trial

A Targetable Myeloid Inflammatory State Governs Disease Recurrence in Clear-Cell Renal Cell Carcinoma

Phillip M Rappold et al. Cancer Discov. .

Abstract

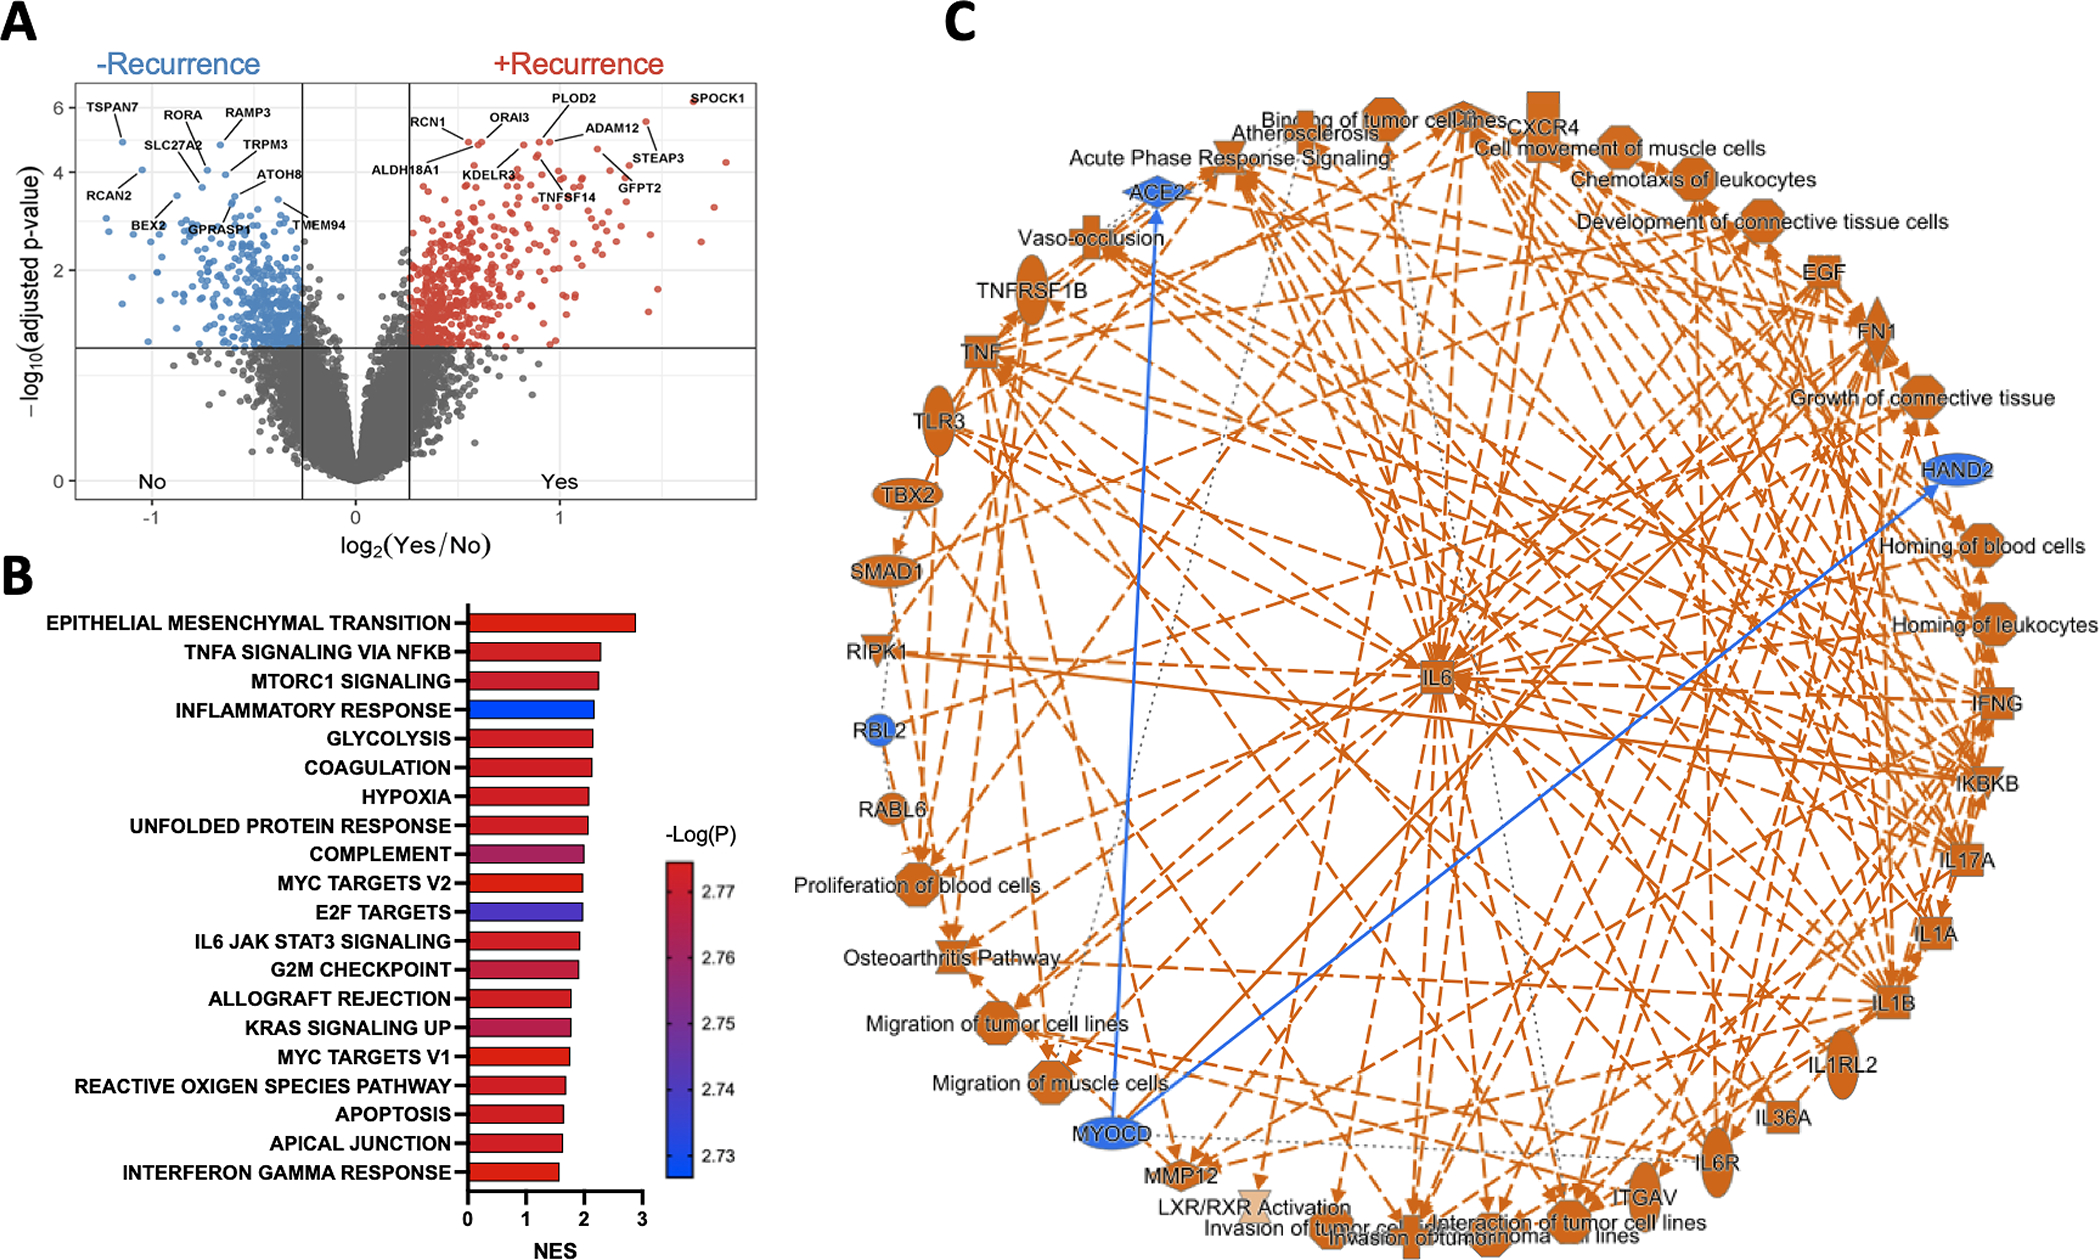
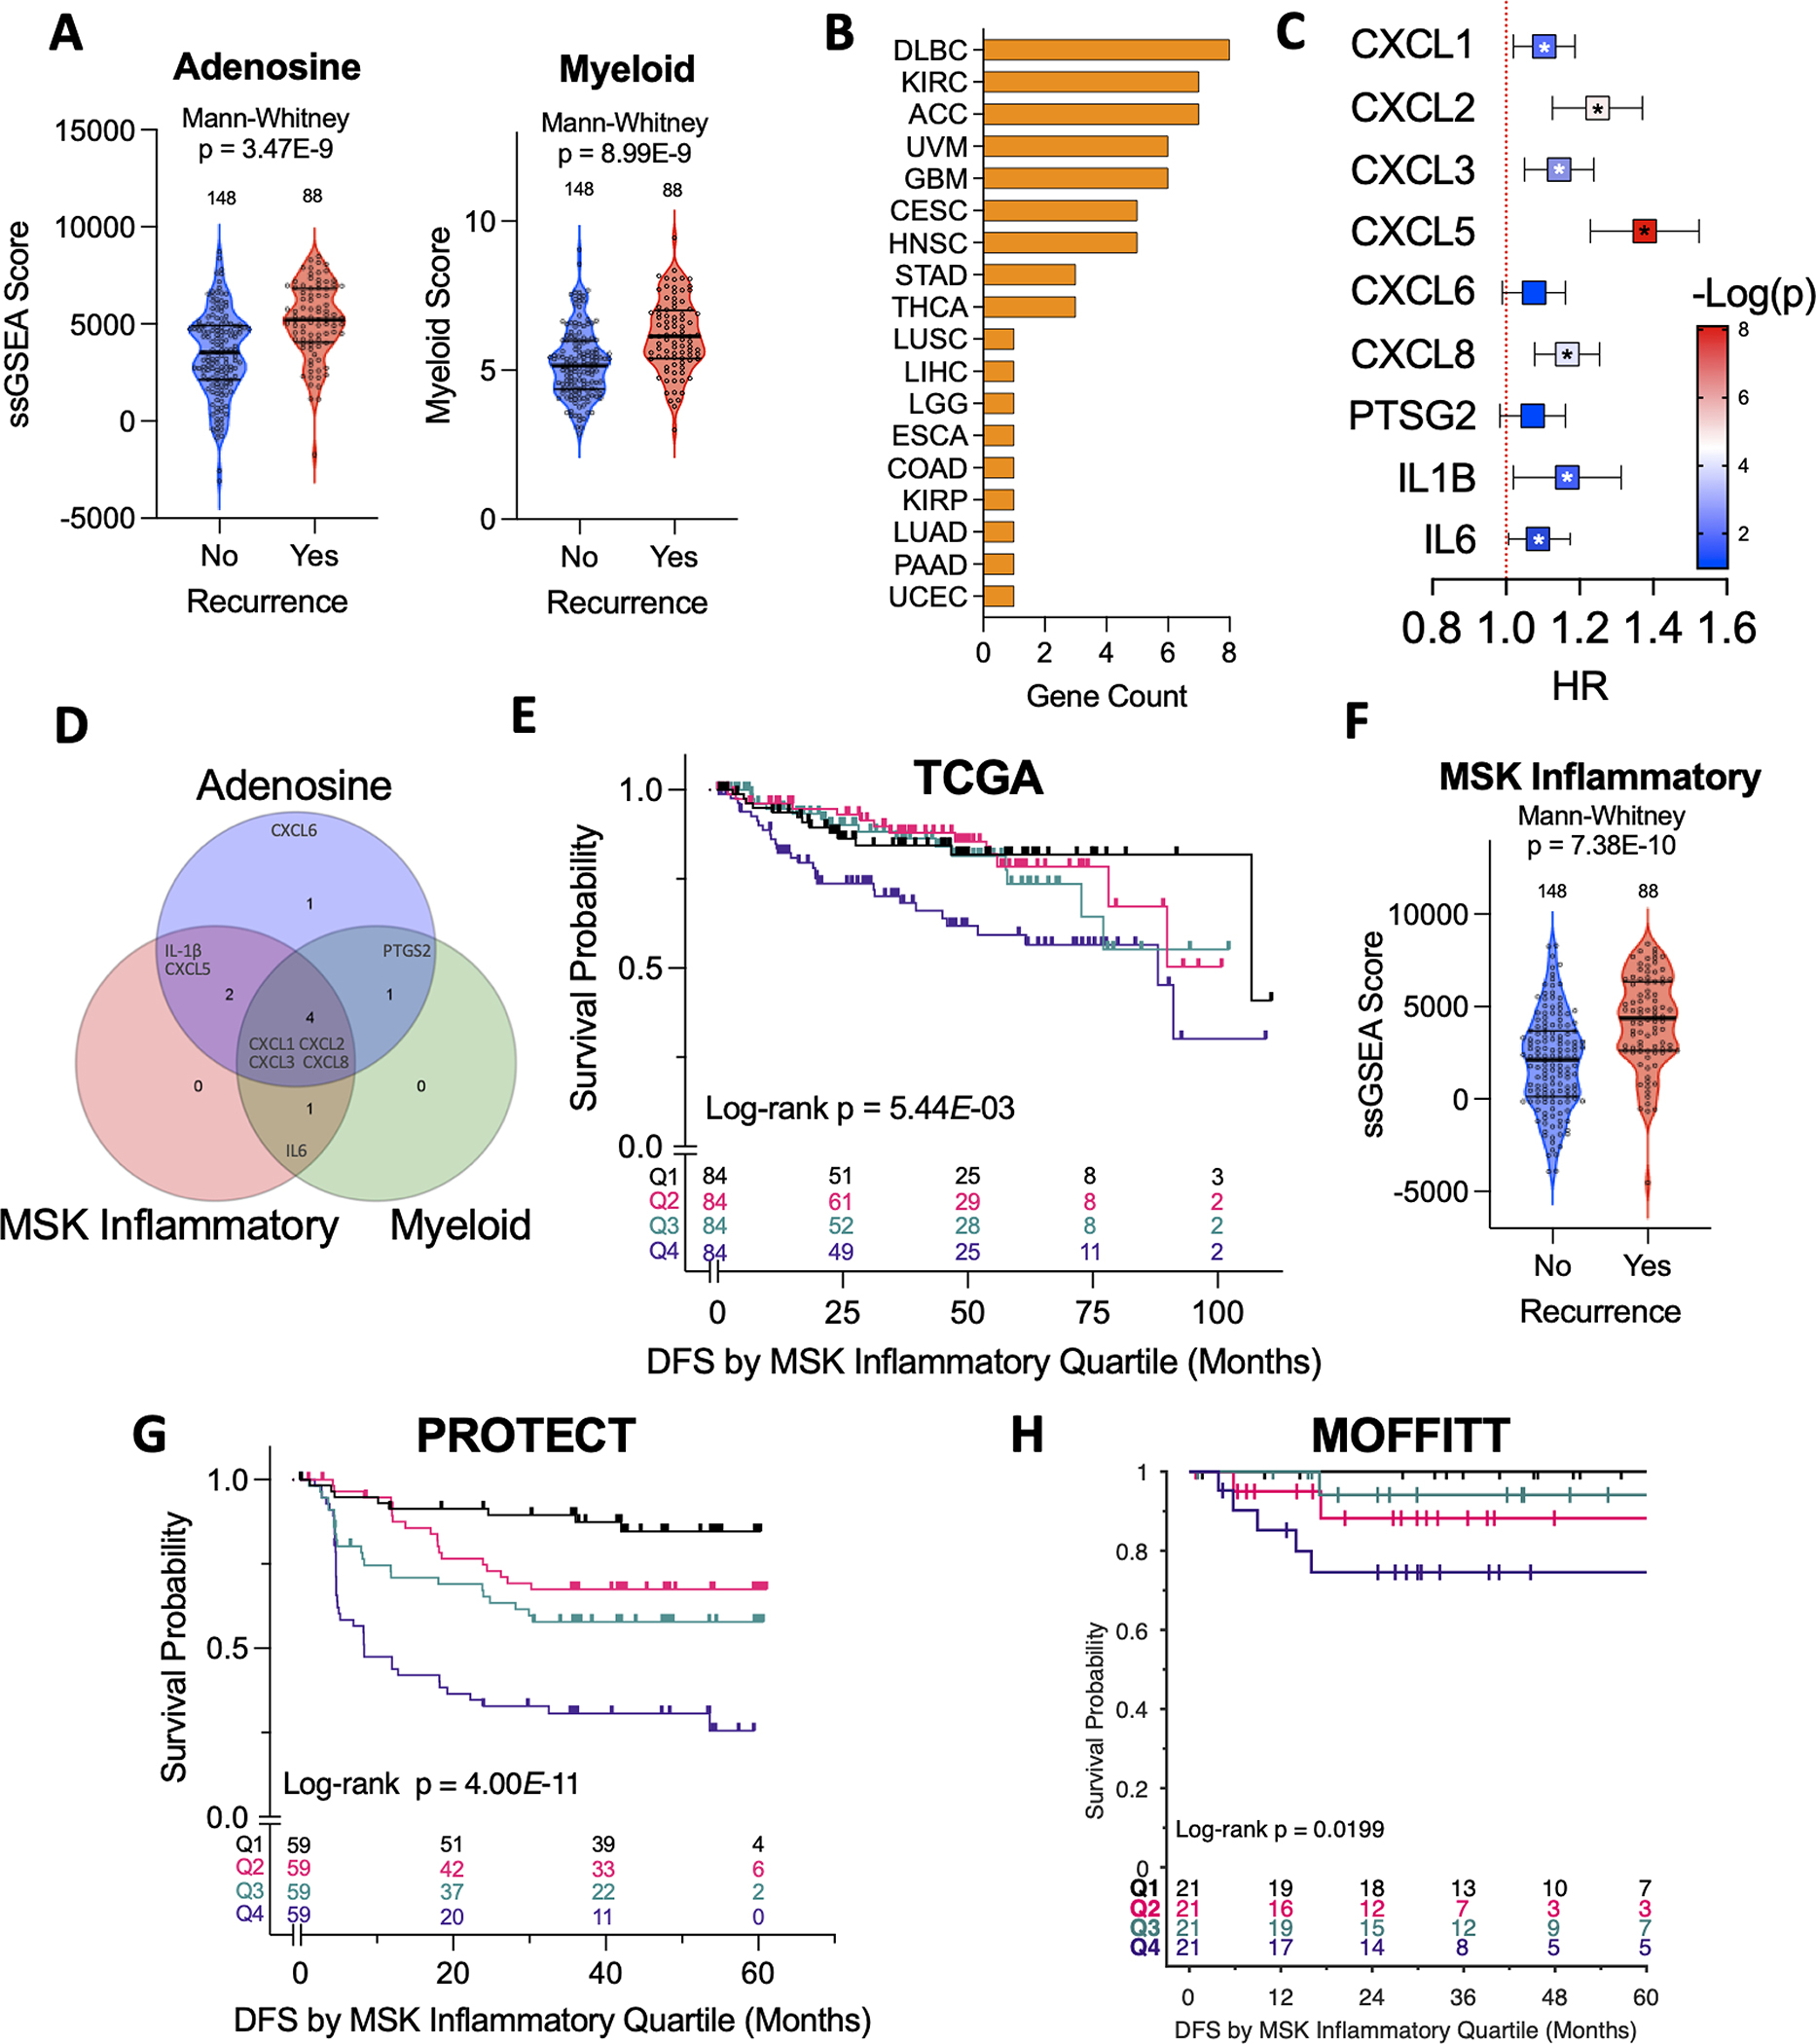
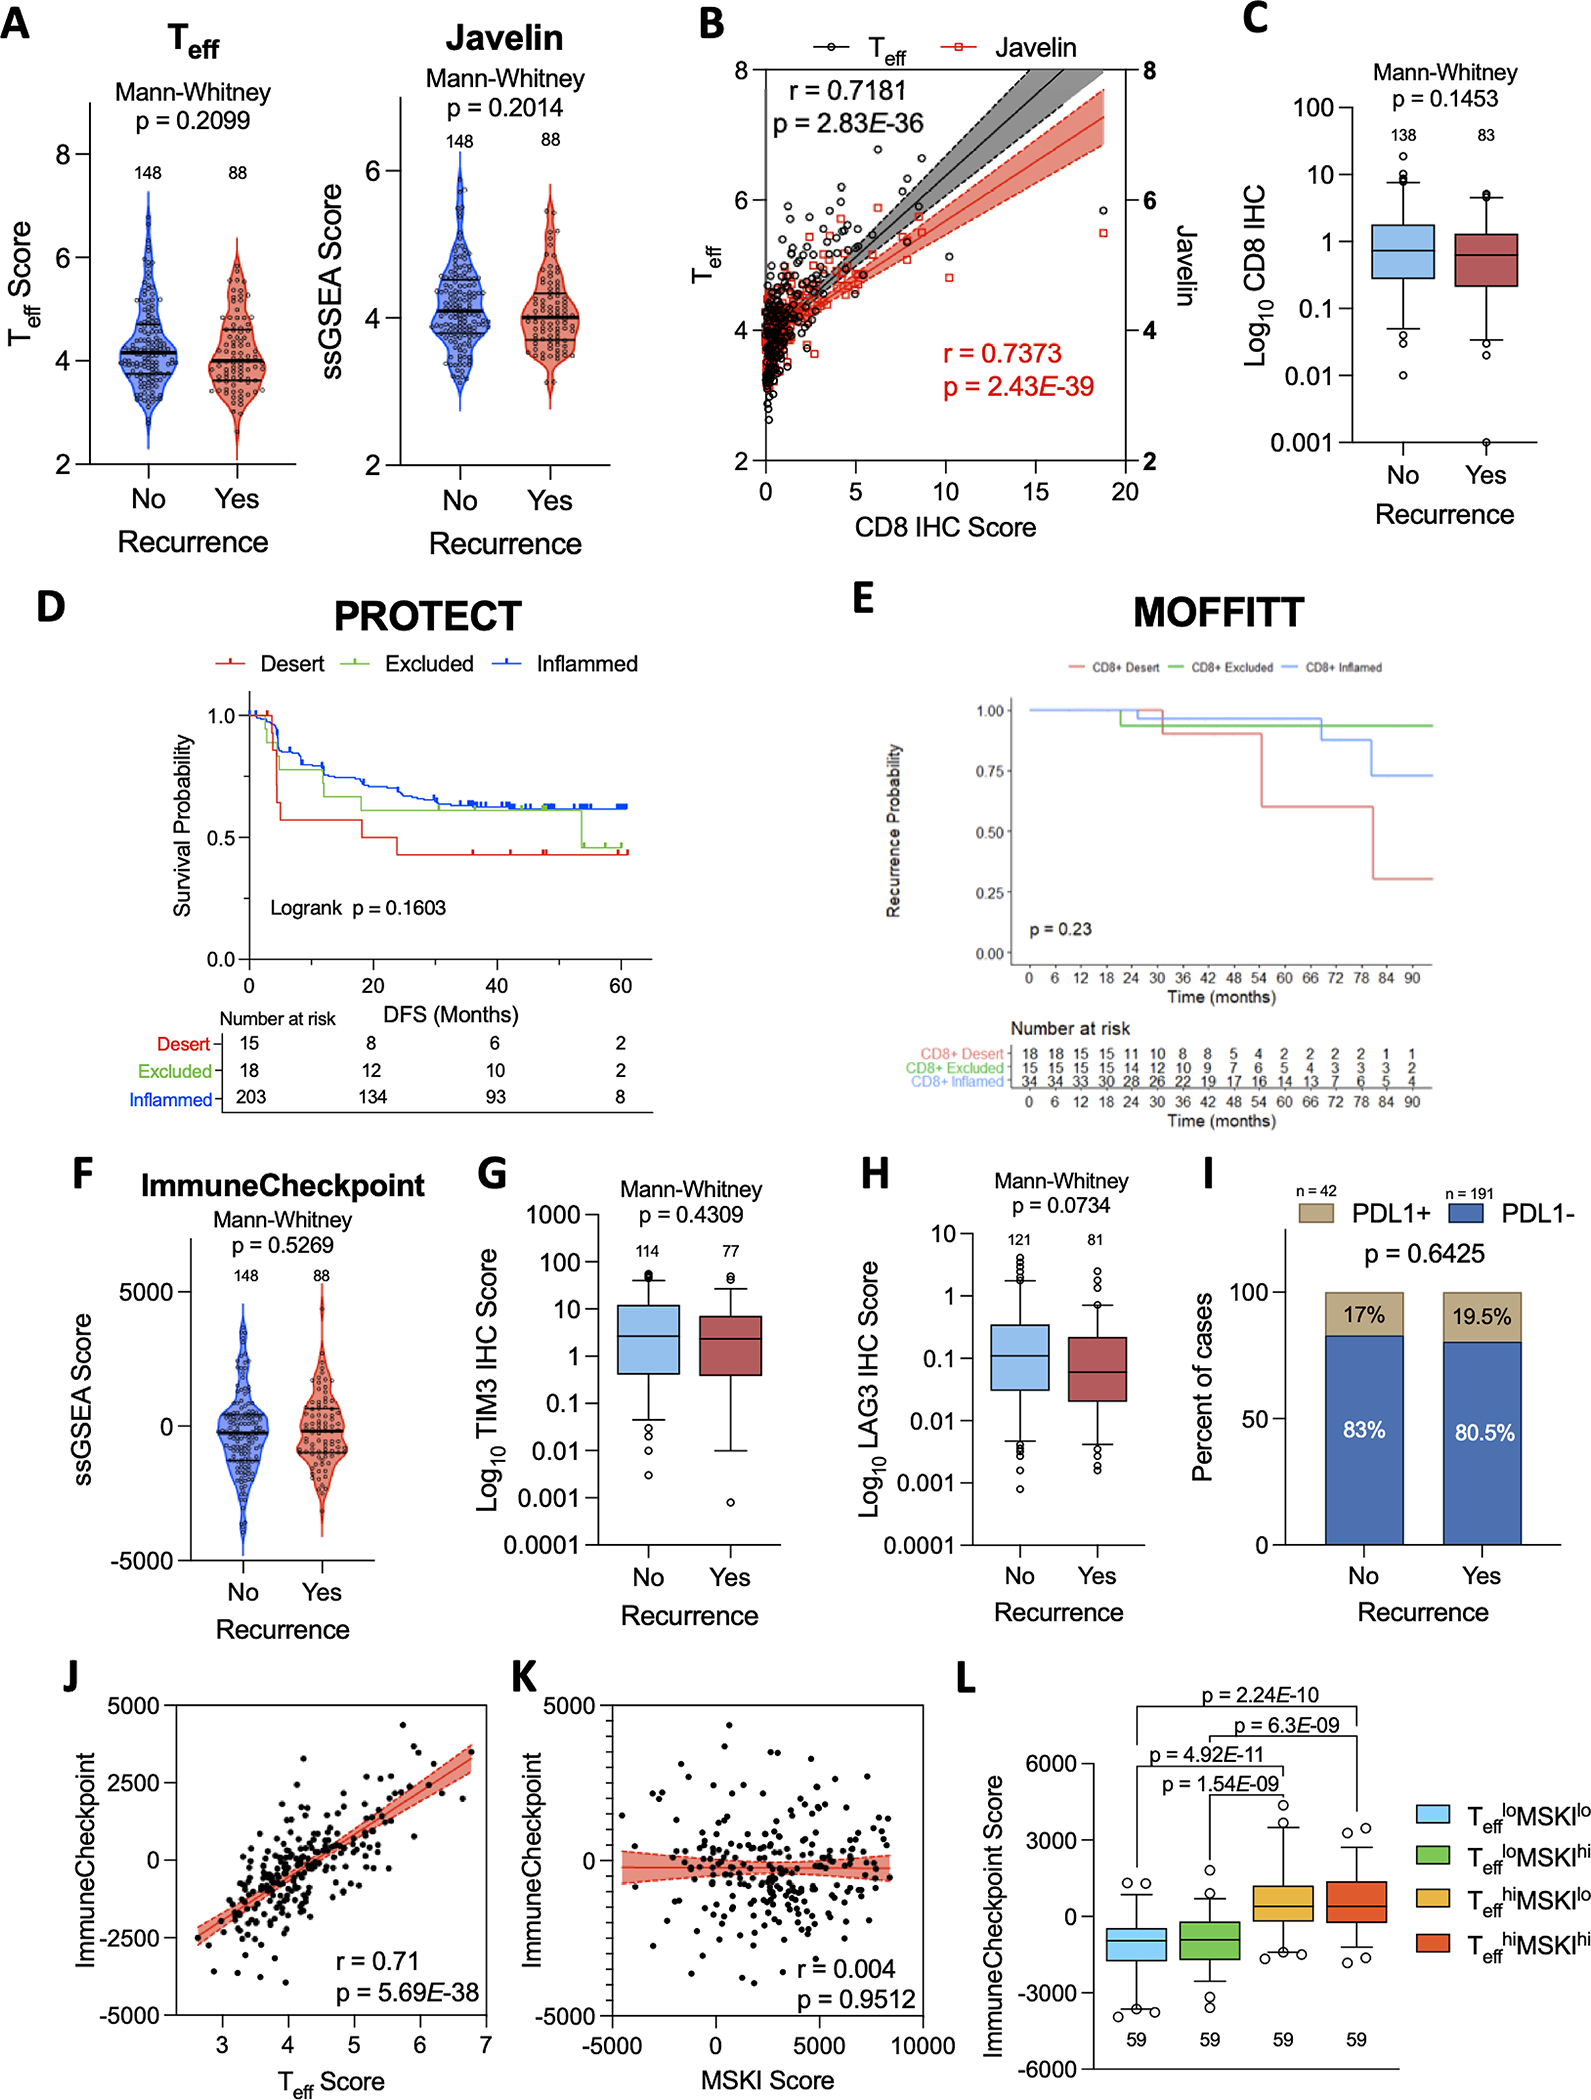
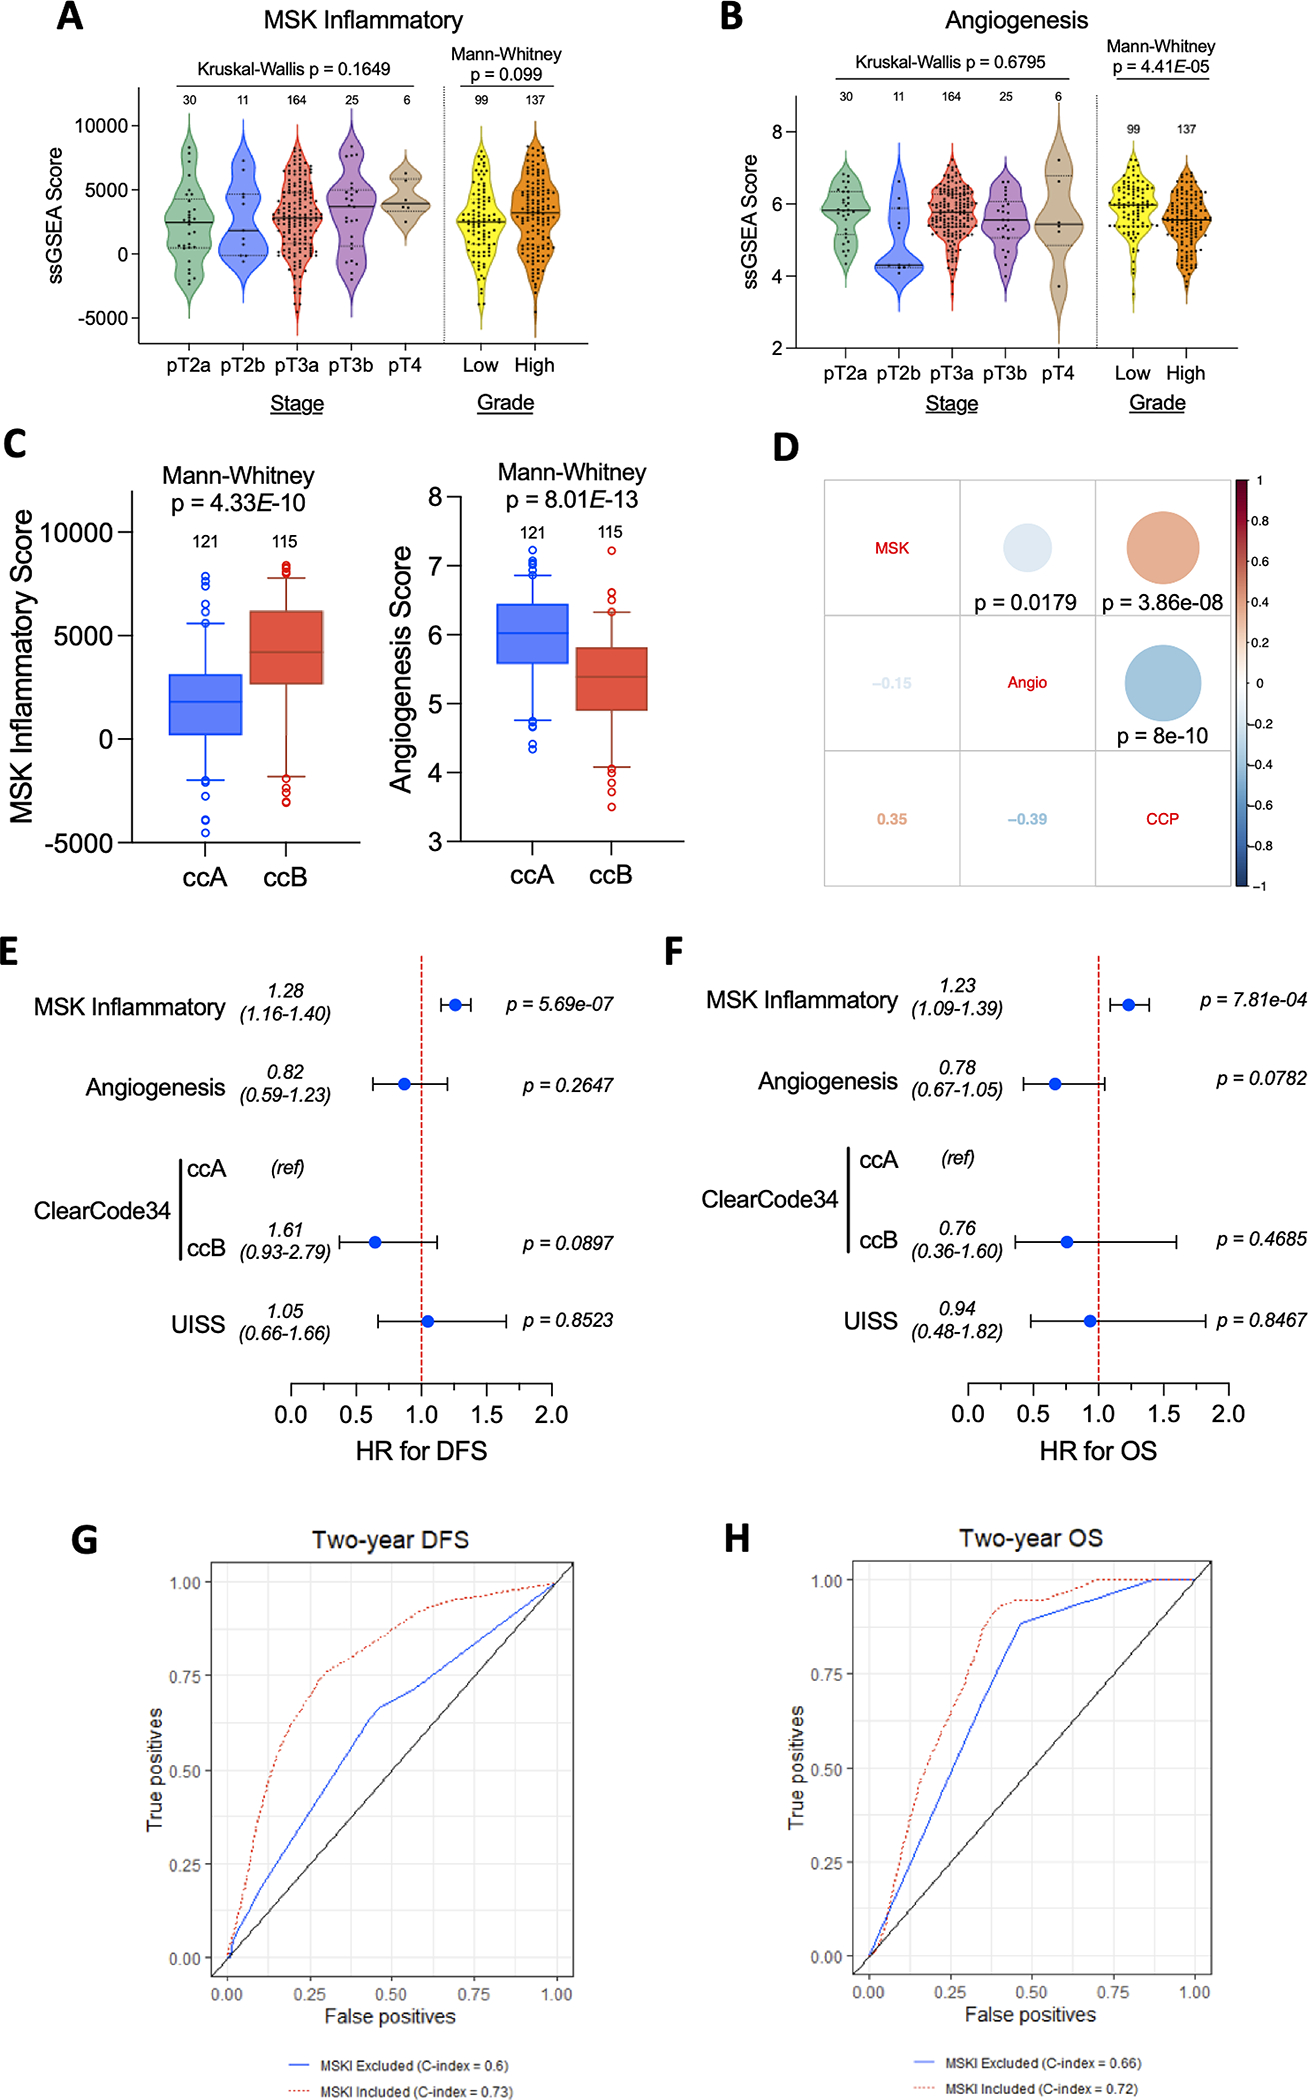
It is poorly understood how the tumor immune microenvironment influences disease recurrence in localized clear-cell renal cell carcinoma (ccRCC). Here we performed whole-transcriptomic profiling of 236 tumors from patients assigned to the placebo-only arm of a randomized, adjuvant clinical trial for high-risk localized ccRCC. Unbiased pathway analysis identified myeloid-derived IL6 as a key mediator. Furthermore, a novel myeloid gene signature strongly correlated with disease recurrence and overall survival on uni- and multivariate analyses and is linked to TP53 inactivation across multiple data sets. Strikingly, effector T-cell gene signatures, infiltration patterns, and exhaustion markers were not associated with disease recurrence. Targeting immunosuppressive myeloid inflammation with an adenosine A2A receptor antagonist in a novel, immunocompetent, Tp53-inactivated mouse model significantly reduced metastatic development. Our findings suggest that myeloid inflammation promotes disease recurrence in ccRCC and is targetable as well as provide a potential biomarker-based framework for the design of future immuno-oncology trials in ccRCC.

Significance: Improved understanding of factors that influence metastatic development in localized ccRCC is greatly needed to aid accurate prediction of disease recurrence, clinical decision-making, and future adjuvant clinical trial design. Our analysis implicates intratumoral myeloid inflammation as a key driver of metastasis in patients and a novel immunocompetent mouse model. This article is highlighted in the In This Issue feature, p. 2221.


Conflict of interest statement

Disclosures

T.A.C. is a co-founder of Gritstone Oncology and holds equity in An2H. T.A.C. acknowledges grant funding from Bristol-Myers Squibb, AstraZeneca, Illumina, Pfizer, An2H, and Eisai. T.A.C. has served as an advisor for Bristol-Myers, MedImmune, Squibb, Illumina, Eisai, AstraZeneca, and An2H. T.A.C. and V. L. hold ownership of intellectual property on using tumor mutation burden to predict immunotherapy response, with pending patent, which has been licensed to PGDx. R.J.M served in a consultancy or advisory role for Pfizer, Novartis, Merck, Genentech/Roche, Eisai and Exelixis, and received research funding from Bristol-Myers Squibb, Merck, Pfizer, Genentech/Roche, Eisai, Exelixis, and Novartis. M.H.V. reports honoraria from Novartis, consulting/advisory role for Alexion Pharmaceuticals, Bayer, Calithera Biosciences, Corvus Pharmaceuticals, Exelixis, Eisai, GlaxoSmithKline, Natera, Novartis and Pfizer, research funding from Pfizer, Bristol-Myers Squibb and Genentech/Roche, and travel, accommodations, and expenses from Eisai, Novartis and Takeda. J.M., M.M., A.R., and A.S. are employees of Novartis. A.A.H. has served in an advisory role for Merck. D.B.S. has consulted for/received honoraria from Pfizer, Loxo/Lilly Oncology, Vividion Therapeutics, FORE Therapeutics, Scorpion Therapeutics and BridgeBio. M.G. is a shareholder and an employee of Illumina Inc. The rest of the authors have no conflicts to disclose.

Figures

Figure 1.
Figure 1.. Multiple oncogenic and inflammatory pathways upregulated in recurrent tumors converge on IL6.
(A) Volcano plot demonstrating differentially expressed genes in recurrent vs non-recurrent tumors. (B) Bar graph displaying the top 20 GSEA analysis of hallmark gene sets, based on p-value, comparing recurrent vs non-recurrent tumors. Pathways are ranked by normalized enrichment scores (NES) and all shown pathways have adjusted p<0.05. (C) IPA graphical summary of core analysis highlighting IL6 as a common component among upregulated pathways in recurrent tumors.
Figure 2.
Figure 2.. Myeloid inflammatory gene signatures predict worse disease outcomes in RCC.
(A) Violin plots of enrichment scores for Adenosine and Myeloid gene signatures in recurrent vs non-recurrent tumors in the PROTECT cohort. (B) Bar graph of gene counts by cancer type that were significantly associated with overall survival on Cox regression in TCGA dataset. (C) Forest Plot of Cox regression analysis by listed genes for KIRC cohort (*p < 0.05). (D) Venn diagram highlighting number of genes shared by the listed signatures. (E) Kaplan-Meier analysis demonstrating impact of MSK inflammatory gene expression (based on quartiles of enrichment scores) on DFS in the TCGA-KIRC cohort. (F) Violin plots of enrichment scores for the MSK inflammatory signature in recurrent vs non-recurrent tumors in the PROTECT cohort. (G,H) Kaplan-Meier analysis demonstrating impact of MSK inflammatory gene expression (based on quartiles of enrichment scores) on DFS in the (G) PROTECT and (H) MOFFITT cohorts.
Figure 3.
Figure 3.. Lymphoid inflammation is not associated with disease recurrence.
Violin plots of enrichment scores for (A) Effector T cell (Teff) and (B) Javelin gene scores in recurrent vs non-recurrent tumors. (B) Scatterplot showing relationship between CD8 IHC scores and Teff or Javelin signature scores. Spearman correlation coefficients with p-values obtained from two-sided tests shown. Shaded areas represent 95% confidence intervals. (C) Overall intratumoral CD8 IHC scores in recurrent vs non-recurrent tumors. (D,E) Kaplan-Meier analysis of CD8 infiltration patterns on DFS in the (D) PROTECT and (E) MOFFITT cohorts. (F,G) Violin plots of enrichment scores for (F) ImmuneCheckpoint GES in recurrent vs non-recurrent tumors. (G,H,I) IHC scores for (G) TIM3, (H) LAG3, and (I) PD-L1 in recurrent vs non-recurrent tumors. PD-L1 positivity defined as >1% tumor cells labeled. (J,K) Scatterplots showing correlation between the ImmuneCheckpoint score and (J) Teff score and (K) MSKI GES. (L) Box plots demonstrating difference in median ImmuneCheckpoint score and Teff high vs low (Teffhi vs Tefflo) and MSKI high vs low (MSKIhi vs MSKIlo) groups.
Figure 4.
Figure 4.. Univariate and multivariate analysis of relationships between TME gene signatures, previously validated risk models, and disease outcomes.
(A,B) Violin plots of (A) MSK inflammatory and (B) Angiogenesis score by tumor stage and grade. (C) Box plots of MSK Inflammatory and Angiogenesis score by ClearCode34 groups. (D) Correlation matrix displaying Spearman correlation coefficients (actual values in lower left-hand corner) with p-values obtained from two sided tests. (E,F) Forest plots displaying results of multivariate Cox regression for the listed variables with respect to (E) DFS and (F) OS. Two-year timepoint receiving operating characteristic (ROC) curves and c-indices to for both (G) DFS and (H) OS multivariable models. The DFS full model includes MSKI, ClearCode34, and UISS. The OS full model includes MSKI, CCP, and UISS.
Figure 5.
Figure 5.. Intratumoral heterogeneity and cell populations underlying the MSK Inflammatory signature.
(A) Violin plots of MSK Inflammatory signature scores from fluorescence-activated cell sorted immune cell populations from ccRCC tumors. (B) Scatterplot showing correlations between MSK Inflammatory score and CD68 IF cell counts. Shaded areas represent 95% confidence intervals. (C) Box plots of CD68 IF cell counts in MSK Inflammatory high (MSKhi) vs MSK Inflammatory low (MSKIlo) tumors (based on median score) (D) Scatterplot showing correlations between Angiogenesis score and CD31 IF area derived from paired ccRCC tumor samples. Shaded areas represent 95% confidence intervals. (E) Box plots of CD31 IF areas in angiogenesis high (Angiohi) vs angiogenesis low (Angiolo) tumors (based on median score). (F) Box plots of MSK Inflammatory and angiogenesis score from multiregional tumor samples (n = 2–7 regions per tumor from total 29 patients). Each bar represents one individual patient. Dotted line represents the median enrichment score (G) Representative IF images corresponding to signature score dot plot (highlighted in red in inset) demonstrating intratumoral heterogeneity from two multiregional tumor samples. Scale bar = 50 μm
Figure 6.
Figure 6.. Novel electroporation-derived ccRCC syngeneic model is metastatic and transcriptomically resembles human stromal/proliferative ccRCC molecular subtype.
(A) Schematic of ccRCC syngeneic cell line development using electroporation of somatic tissues. Photo (B) and H&E (C) and IHC (D) of the parental kidney tumor and surrounding normal kidney. (E) Western blot of the EP-derived LVRCC67 cell line, RenCa and NIH3T3 cells are used as controls. H&E of lung (F) or liver (G) metastatic nodules following subcutaneous injection of LVRCC67 cells into WT C57Bl/6 mice. (H) Heatmap of ssGSEA scores in LVRCC67 tumors compared with normal kidney cortex samples from WT C57Bl/6 mice. Red arrows indicate tumor area. Scale bar 100μm. Schematic was made with BioRender.
Figure 7.
Figure 7.. Adenosine receptor, but not PD-1 inhibition attenuates spontaneous ccRCC metastasis.
Subcutaneous LVRCC67 tumor-bearing mice were treated from day 2 post-injection with either 100mg/kg daily of the adenosine A2A receptor inhibitor CPI-444 self-administered via medicated chow (n=15), or 100μg of anti-PD-1 therapeutic antibody (n=7) delivered intraperitoneally twice weekly, or control chow plus 100μg of IgG isotype control antibody (n=15). (A) Average (left panel) and individual (right panel) primary tumor volumes are shown. On day 35 mice were sacked and the number of macroscopically visible metastatic nodules in liver and lung were counted (B-C). Primary tumors were dissociated and immune cells were analyzed by flow cytometry (D). Control versus treatment group tumor volumes were compared using a two-way ANOVA with Geisser-Greenhouse correction and Fisher’s LSD post hoc test. The number of metastases and immune populations were compared using Wilcoxon rank sums test. All analyses compared treatment groups to the control group. *p<0.05, **p<0.01, ***p=<0.001, ****p=<0.0001. Error bars show mean ± SEM. Tumor-associated macrophages, TAM; T cells, TCs; Median fluorescence intensity, MFI.

References

    1. Choueiri TK, Tomczak P, Park SH, Venugopal B, Ferguson T, Chang Y-H, et al. Adjuvant Pembrolizumab after Nephrectomy in Renal-Cell Carcinoma. N Engl J Med. 2021;385:683–94. - PubMed
    1. Leibovich BC, Blute ML, Cheville JC, Lohse CM, Frank I, Kwon ED, et al. Prediction of progression after radical nephrectomy for patients with clear cell renal cell carcinoma: A stratification tool for prospective clinical trials. Cancer. 2003;97:1663–71. - PubMed
    1. Zisman A, Pantuck AJ, Wieder J, Chao DH, Dorey F, Said JW, et al. Risk group assessment and clinical outcome algorithm to predict the natural history of patients with surgically resected renal cell carcinoma. J Clin Oncol. 2002;20:4559–66. - PubMed
    1. Brooks SA, Brannon AR, Parker JS, Fisher JC, Sen O, Kattan MW, et al. ClearCode34: A prognostic risk predictor for localized clear cell renal cell carcinoma. Eur Urol. 2014;66:77–84. - PMC - PubMed
    1. Morgan TM, Mehra R, Tiemeny P, Wolf JS, Wu S, Sangale Z, et al. A Multigene Signature Based on Cell Cycle Proliferation Improves Prediction of Mortality Within 5 Yr of Radical Nephrectomy for Renal Cell Carcinoma. Eur Urol. 2018;73:763–9. - PubMed

Publication types