. 2022 Jun 1;63(6):26.
doi: 10.1167/iovs.63.6.26.

TFEB-Mediated Lysosomal Restoration Alleviates High Glucose-Induced Cataracts Via Attenuating Oxidative Stress

Affiliations

TFEB-Mediated Lysosomal Restoration Alleviates High Glucose-Induced Cataracts Via Attenuating Oxidative Stress

Yan Sun et al. Invest Ophthalmol Vis Sci. .

Abstract

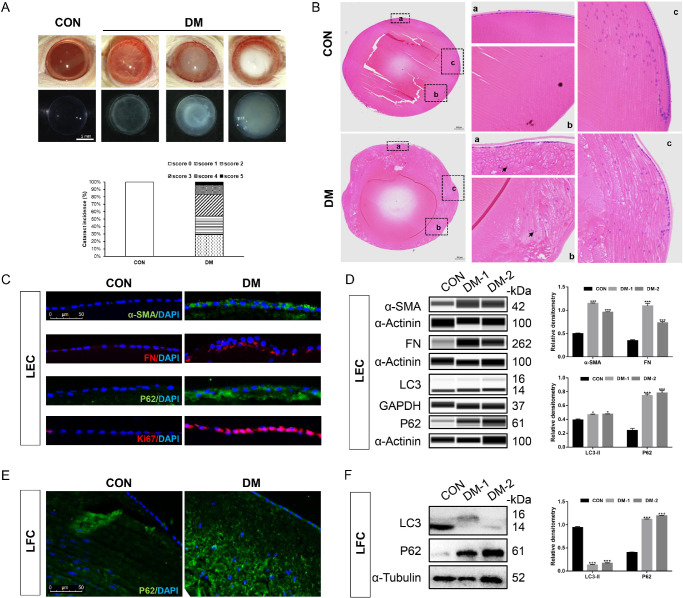
Purpose: Diabetic cataract (DC) is a visual disorder arising from diabetes mellitus (DM). Autophagy, a prosurvival intracellular process through lysosomal fusion and degradation, has been implicated in multiple diabetic complications. Herein, we performed in vivo and in vitro assays to explore the specific roles of the autophagy-lysosome pathway in DC.

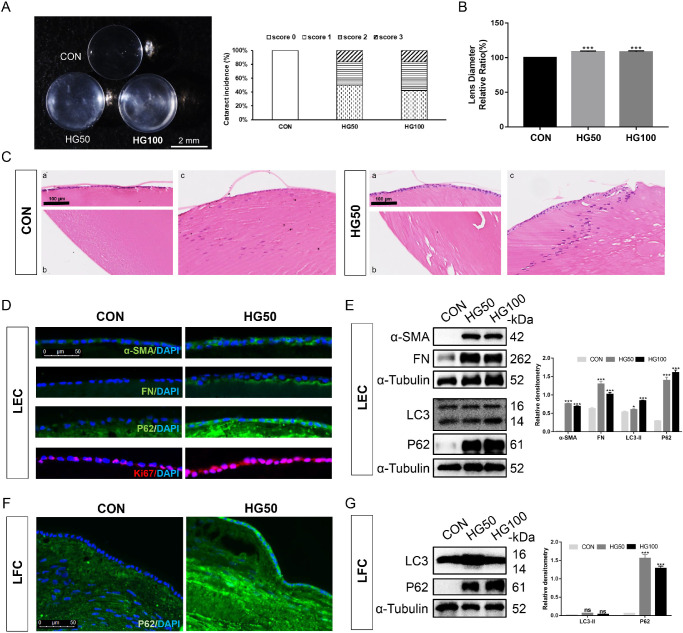
Methods: Streptozotocin-induced DM and incubation in high glucose (HG) led to rat lens opacification. Protein Simple Wes, Western blot, and immunoassay were utilized to investigate autophagic changes in lens epithelial cells (LECs) and lens fiber cells (LFCs). RNA-sequencing (RNA-seq) was performed to explore genetic changes in the lenses of diabetic rats. Moreover, autophagy-lysosomal functions were examined using lysotracker, Western blot, and immunofluorescence analyses in HG-cultured primary rabbit LECs.

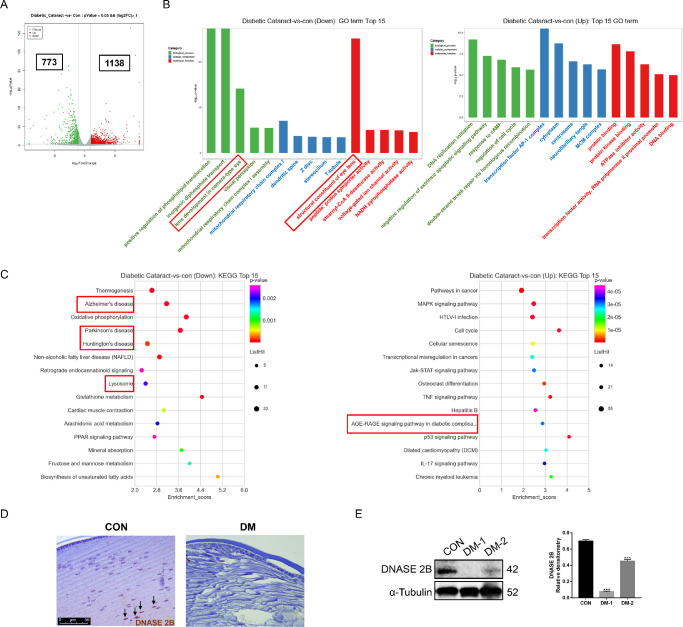
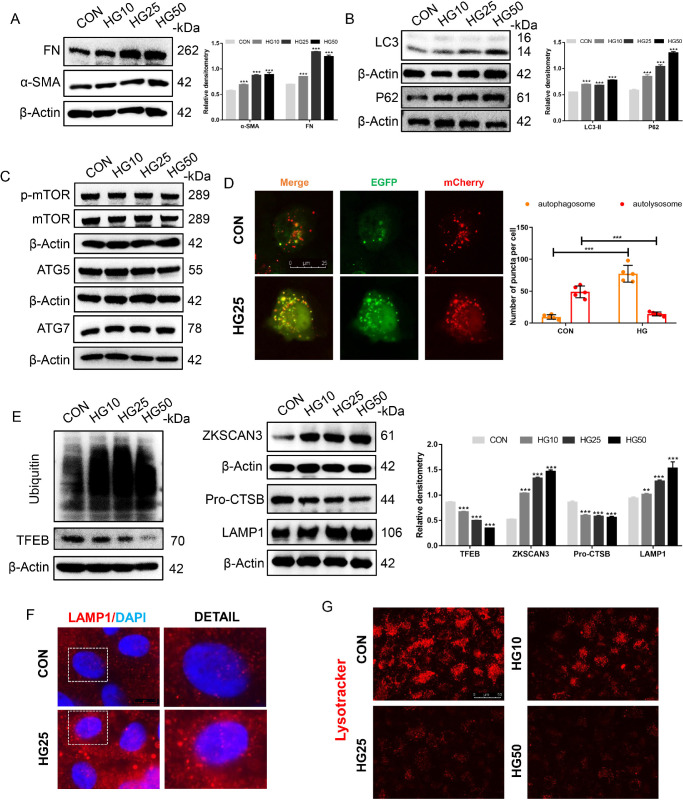
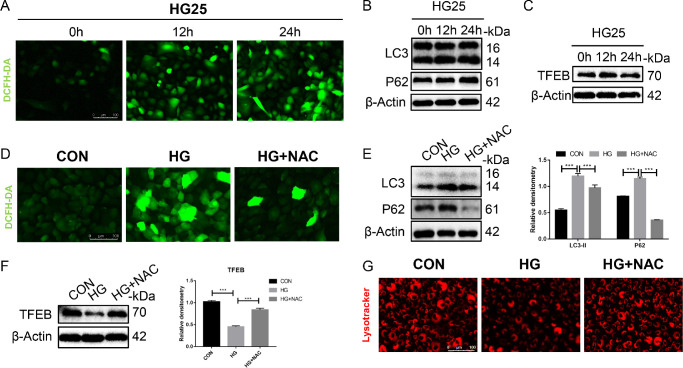
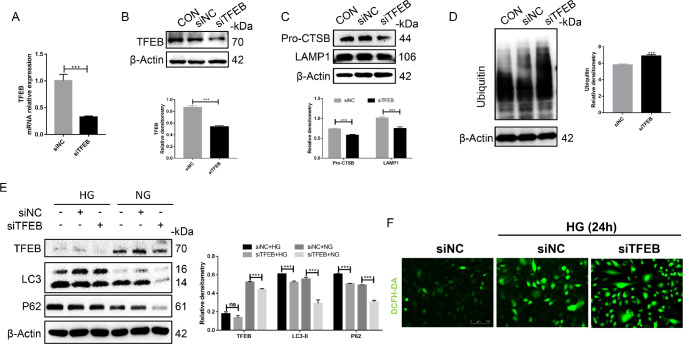
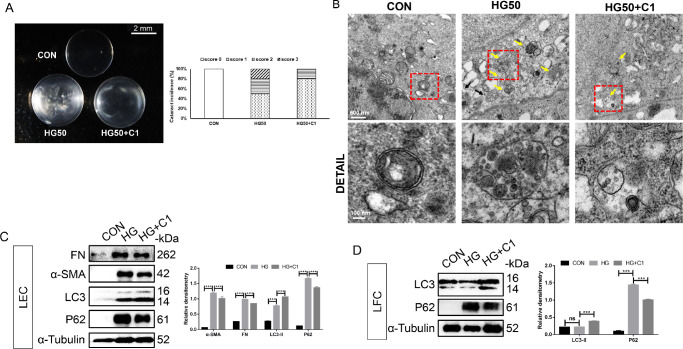
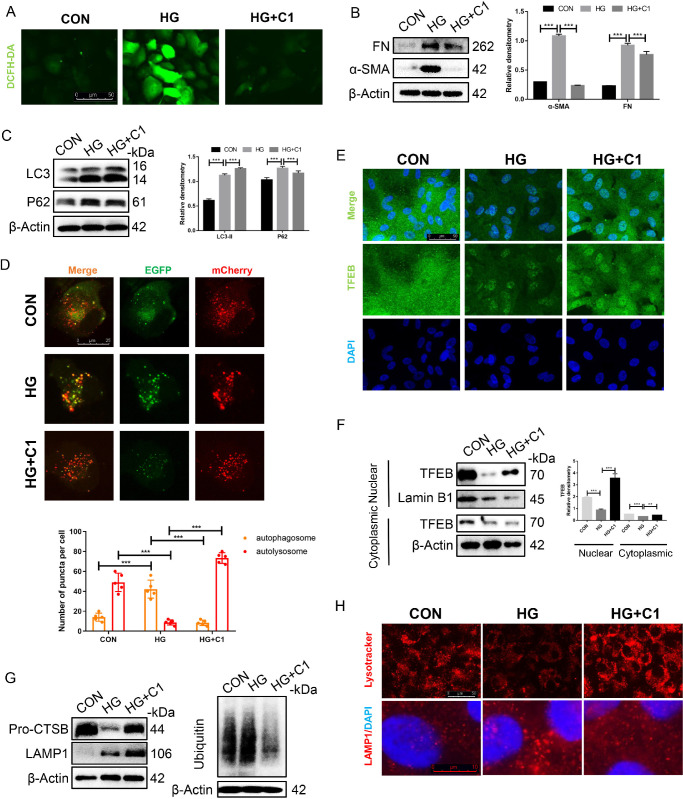
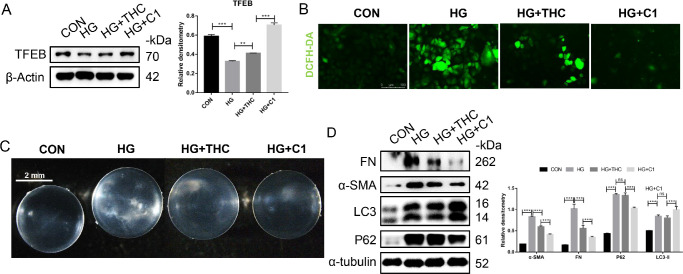
Results: First, DM and HG culture led to fibrotic LECs, swelling LFCs, and eventually cataracts. Further analysis showed aberrant autophagic degradation in LECs and LFCs during cataract formation. RNA-seq data revealed that the differentially expressed genes (DEGs) were enriched in the lysosome pathway. In primary LECs, HG treatment resulted in decreased transcription factor EB (TFEB) and cathepsin B (CTSB) activity, and increased lysosomal size and pH values. Moreover, TFEB-mediated dysfunctional lysosomes resulted from excessive oxidative stress in LECs under HG conditions. Furthermore, TFEB activation by curcumin analog C1 alleviated HG-induced cataracts through enhancing lysosome biogenesis and activating protective autophagy, thereby attenuating HG-mediated oxidative damage.

Conclusions: In summary, we first identified that ROS-TFEB-dependent lysosomal dysfunction contributed to autophagy blockage in HG-induced cataracts. Additionally, TFEB-mediated lysosomal restoration might be a promising therapeutic method for preventing and treating DC through mitigating oxidative stress.


Conflict of interest statement

Disclosure: Y. Sun, None; X. Wang, None; B. Chen, None; M. Huang, None; P. Ma, None; L. Xiong, None; J. Huang, None; J. Chen, None; S. Huang, None; Y. Liu, None

Figures

Figure 1.
Figure 1.
STZ-induced diabetic cataracts exhibited impaired autophagic flux. Rats were injected with STZ for 3 days to induce diabetes, whereas rats in the control group were injected with citrate buffer only. Then, these rats were raised under normal conditions for three months, and their blood glucose levels were monitored every 7 days. (A) Representative images of the anterior segment of the eye using slit-lamp examination and extracted lenses in two groups and the percentage distribution of cataract scores. Cataract score: no cataract (0), peripheral vesicles and opacities (1), central opacities (2), diffuse central opacities (3), mature cataract (4), and hypermature cataract (5). (B) H&E staining of rat lenses at 12 weeks (a: anterior central zone; b: posterior cortical zone; and c: equatorial zone). There were prominent lens fiber swelling and aberrant nuclei (arrows) in the DM group, compared to the control group. (C) Immunofluorescence staining of α-SMA, FN, Ki67, and P62 in the anterior subcapsular LECs. (D) Automated western immunoblotting determined the changes of the mesenchymal markers (α-SMA and FN) and autophagy markers (LC3-I/II and P62) in LECs. (E) Immunofluorescence staining of P62 in LFCs located along the equatorial zone. (F) Densitometry quantification of LC3-II and P62 in LFCs by Western blot analysis. Relative protein levels of total proteins were standardized to the expression of GAPDH, α-Tubulin, or α-Actinin. All the data were shown as mean ± standard deviation. *P < 0.05, **P < 0.01, and ***P < 0.001.
Figure 2.
Figure 2.
HG led to autophagy blockage in ex vivo lens organ culture. The rat lenses were cultured in HG medium (50 and 100 mM) for 7 days. (A) Representative images of cultured rat lenses and the percentage distribution of cataract scores in control, HG50, and HG100 groups. (B) Lens diameter ratio was relative to the control group. (C) H&E staining of cultured lenses in the control and HG (50 mM) groups (a: anterior central zone; b: posterior cortical zone; and c: equatorial zone). (D) Immunofluorescence staining of α-SMA, FN, Ki67, and P62 in anterior subcapsular LECs. (E) Densitometry quantification of α-SMA, FN, LC3-I/II, and P62 in LECs by Western blot analysis. (F) Immunofluorescence staining of P62 in LFCs located along the equatorial zone. (G) Densitometry quantification of LC3-II and P62 in LFCs by Western blot analysis. Relative protein levels of total proteins were standardized to the expression of α-Tubulin. All the data were shown as mean ± standard deviation. *P < 0.05, **P < 0.01, and ***P < 0.001.
Figure 3.
Figure 3.
Comparative transcriptome analysis of lenses between the control group and DM group. The lenses in the control group (n = 4) and the DM group (n = 8) were compared to identify DEGs using RNA-seq analysis. (A) Volcano plot. (B) GO enrichment analysis and (C) KEGG pathway enrichment analysis of the downregulated and upregulated DEGs, respectively. (D) Immunohistochemical staining of DNASE 2B (arrows) in lens fibers located along the equatorial zone and (E) densitometry quantification of DNASE 2B in LFCs by Western blot analysis. Relative protein levels of total proteins were standardized to the expression of α-Tubulin. All the data were shown as mean ± standard deviation. *P < 0.05, **P < 0.01, and ***P < 0.001.
Figure 4.
Figure 4.
HG-induced autophagy blockage was due to TFEB-mediated lysosomal dysfunction in LECs. LECs were treated with various concentrations of glucose (5, 10, 25, and 50 mM) for 3 days. (AC) Western blot analysis showed the effects of glucose on the changes of mesenchymal markers (α-SMA and FN) and autophagic markers (LC3-I/II, P62, p-mTOR, mTOR, ATG7, and ATG5). (D) Representative fluorescence images of mCherry-EGFP-LC3 puncta within LECs and quantification. Yellow puncta: autophagosomes, red-only puncta: autolysosomes. (E) Western blot analysis showed the expression of lysosome-associated proteins (ubiquitin, TFEB, ZKSCAN3, Pro-CTSB, and LAMP1) upon HG stimulation. (F) Immunofluorescence staining of LAMP1 puncta within LECs. (G) Lysotracker assay showed reduced lysotracker staining with increased concentrations of glucose. Relative protein levels of total proteins were standardized to the expression of β-Actin. All the data were shown as mean ± standard deviation. *P < 0.05, **P < 0.01, and ***P < 0.001.
Figure 5.
Figure 5.
HG contributed to TFEB-mediated lysosomal dysfunction in a ROS-dependent manner. Primary rabbit LECs were exposed to HG (25 mM) medium. (A) DCFH-DA assay and (B) Western blot analysis showed the effects of HG treatment on ROS production and the expression levels of LC3-I/II, P62, and TFEB in LECs at 0 hours, 12 hours, and 24 hours. Next, LECs were pretreated with NAC (5 mM, 8 hours) before HG (25 mM, 3 days) administration to prevented the production of ROS. (C) DCFH-DA assay compared ROS levels in the control, HG, and HG + NAC groups. (D, E) Protein expression levels and quantitative analysis of LC3-I/II, P62, and TFEB determined by Western blotting in control, HG, and HG + NAC groups. (F) Lysotracker staining in the control, HG, and HG + NAC groups. All the data were shown as mean ± standard deviation. *P < 0.05, **P < 0.01, and ***P < 0.001.
Figure 6.
Figure 6.
TFEB knockdown inhibits the autophagy-lysosomal pathway in LECs. Primary LECs were transfected with siRNAs or plasmids to knock down TFEB (Forward: 5′-CAGAAGAAAGACAAUCACATT-3′ and reverse 5′-UGUGAUUGUCUUUCUUCUGTT-3′). The expression status of TFEB was examined by (A) qRT-PCR and (B) Western blot analysis. (C, D) Protein expression levels and quantitative analysis of LAMP1, Pro-CTSB, and ubiquitin determined by Western blotting in LECs. (E) TFEB knockdown LECs were cultured under NG and HG conditions for 3 days. Western blot analysis presented the changes of LC3-I/II and P62. (F) DCFH-DA assay compared ROS levels in the siNC, siNC + HG, and siTFEB + HG groups. Relative protein levels of total proteins were standardized to the expression of β-Actin. The mRNA expression levels were normalized to rabbit GAPDH. All the data were shown as mean ± standard deviation. *P < 0.05, **P < 0.01, and ***P < 0.001.
Figure 7.
Figure 7.
Curcumin analog C1 exerted protective effects in HG-induced cataracts. Rat lenses were subjected to control (5.5 mM), HG (50 mM), and HG (50 mM) with C1 (5 µM) medium for 7 days. (A) Representative images of cultured rat lenses and the percentage distribution of cataract scores in the control, HG, and HG + C1 groups. (B) TEM showed that C1 treatment alleviated abnormally large autophagic vesicles (arrows) with massive undegraded substrates in anterior capsular LECs under HG conditions. (C) Protein expression levels and quantitative analysis of α-SMA, FN, LC3-I/II, and P62 determined by Western blotting in LECs. (D) Protein expression levels and quantitative analysis of LC3-I/II and P62 determined by Western blotting in LFCs. All the data were shown as mean ± standard deviation. *P < 0.05, **P < 0.01, and ***P < 0.001.
Figure 8.
Figure 8.
C1 enhanced lysosomal degradation via promoting the nuclear translocation of TFEB in HG-cultured LECs. Primary rabbit LECs were exposed to control (5.5 mM), HG (25 mM), and HG (25 mM) with C1 (5 µM) medium for 3 days. (A) ROS levels were detected by DCFH-DA assay. (B, C) Protein expression levels and quantitative analysis of α-SMA, FN, LC3-I/II, and P62 determined by Western blotting in LECs. (D) Representative fluorescence images of mCherry-EGFP-LC3 puncta within LECs and quantification. (E) Immunofluorescence staining and Western blot analysis (F) showed that C1 increased the expression levels and distributions of TFEB in the cytoplasm and nuclei in LECs. (G) Protein expression levels and quantitative analysis of Pro-CTSB, LAMP1, and ubiquitin determined by Western blotting in LECs. (H) Lysotracker staining and immunofluorescence staining of LAMP1 puncta in LECs. Relative protein levels of total proteins were standardized to the expression of β-Actin, whereas nuclear proteins were normalized to Lamin B1. All the data were shown as mean ± standard deviation. *P < 0.05, **P < 0.01, and ***P < 0.001.
Figure 9.
Figure 9.
Comparison of THC and C1 in alleviating HG-induced cataracts. Primary rabbit LECs were exposed to control (5.5 mM), HG (25 mM), HG (25 mM) with THC (5 µM), and HG (25 mM) with C1 (5 µM) medium for 3 days. (A) Protein expression levels and quantitative analysis of TFEB determined by Western blotting in LECs. (B) DCFH-DA assay compared ROS levels in the control, HG, HG + THC, and HG + C1 groups. Rat lenses were subjected to control (5.5 mM), HG (50 mM), HG (50 mM) with THC (5 µM), and HG (50 mM) with C1 (5 µM) medium for 7 days. (C) Representative images of cultured rat lenses and the percentage distribution of cataract scores in the control, HG, HG + THC, and HG + C1 groups. (D) Protein expression levels and quantitative analysis of α-SMA, FN, LC3-I/II, and P62 determined by Western blotting in LECs. All the data were shown as mean ± standard deviation. *P < 0.05, **P < 0.01, and ***P < 0.001.

Similar articles

Cited by

References

    1. Pollreisz A, Schmidt-Erfurth U.. Diabetic Cataract—Pathogenesis, Epidemiology and Treatment. J Ophthalmol . 2010; 2010: 1–8. - PMC - PubMed
    1. Kiziltoprak H, Tekin K, Inanc M, Goker YS.. Cataract in diabetes mellitus. World J Diabetes. 2019; 10: 140–153. - PMC - PubMed
    1. Grzybowski A, Kanclerz P, Huerva V, et al. .. Diabetes and Phacoemulsification Cataract Surgery: Difficulties, Risks and Potential Complications. J Clin Med. 2019; 8: 716. - PMC - PubMed
    1. Cvekl A, Zhang X.. Signaling and Gene Regulatory Networks in Mammalian Lens Development. Trends Genet . 2017; 33: 677–702. - PMC - PubMed
    1. Tjahjono N, Xia CH, Li R, et al. .. Connexin 50-R205G Mutation Perturbs Lens Epithelial Cell Proliferation and Differentiation. Invest Ophthalmol Vis Sci. 2020; 61: 25. - PMC - PubMed

Publication types

MeSH terms

Substances