

The role of specialized cell cycles during erythroid lineage development: insights from single-cell RNA sequencing
- PMID: 35759181
- PMCID: PMC12302956
- DOI: 10.1007/s12185-022-03406-9
The role of specialized cell cycles during erythroid lineage development: insights from single-cell RNA sequencing
Abstract
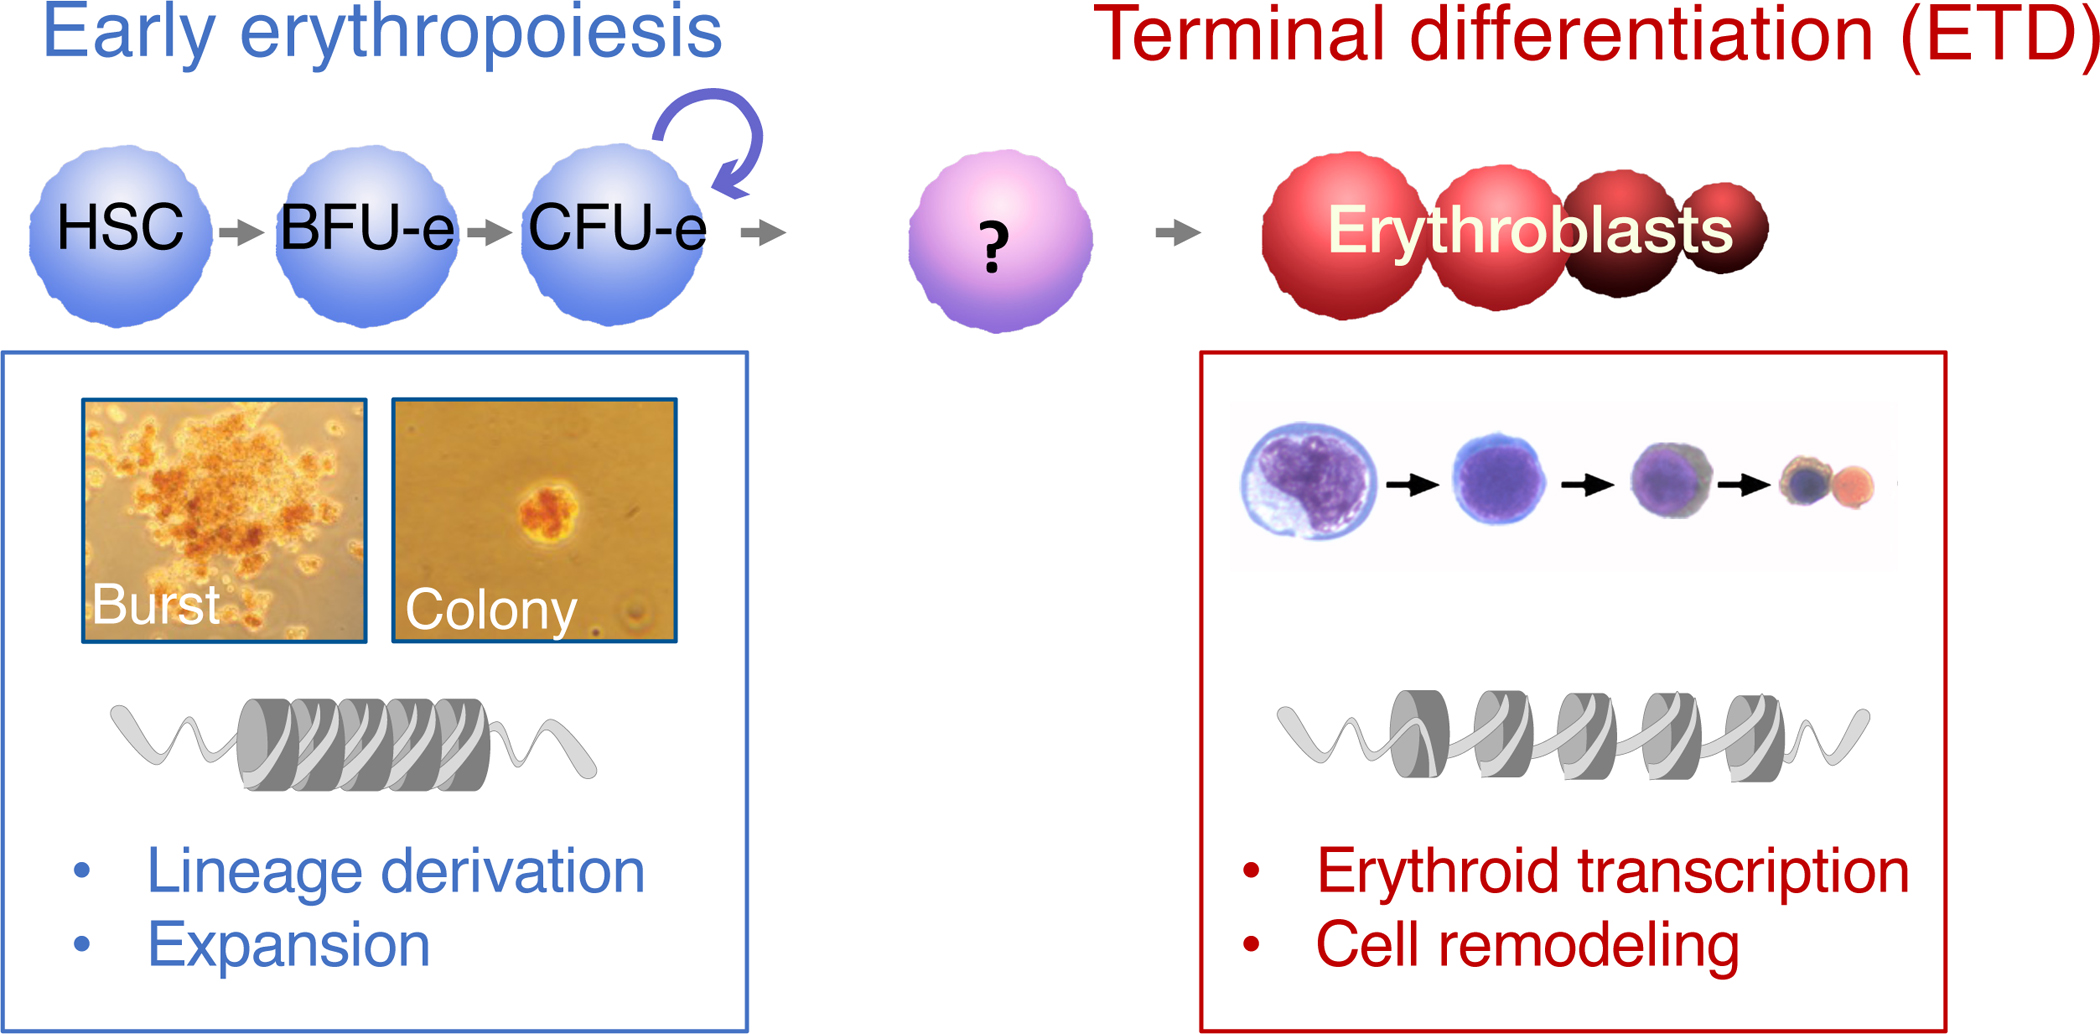
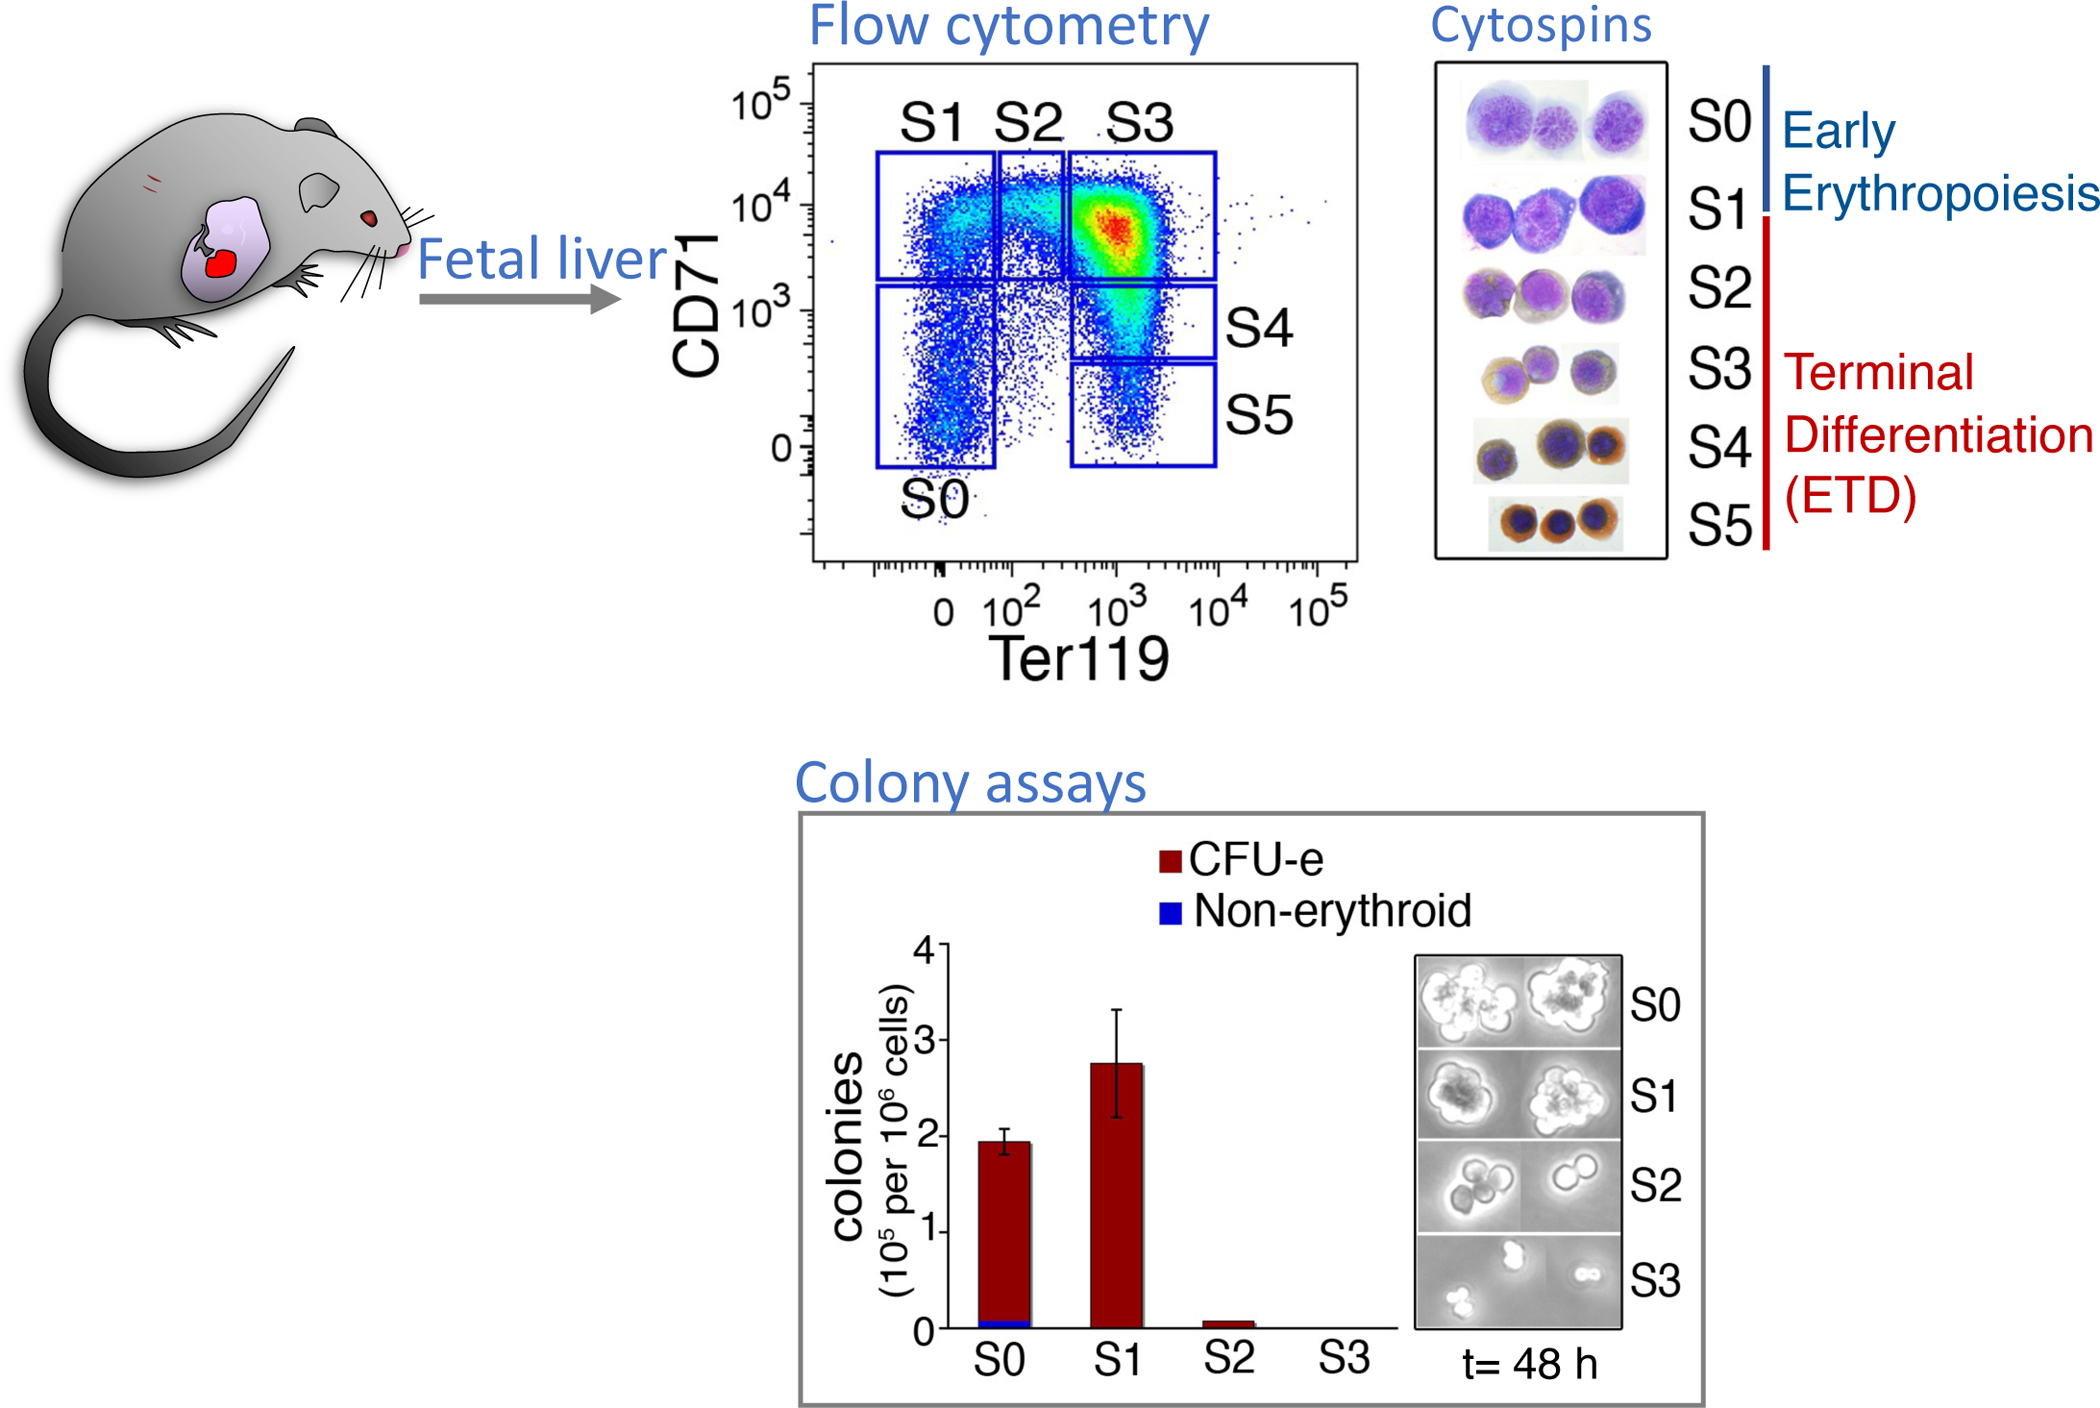
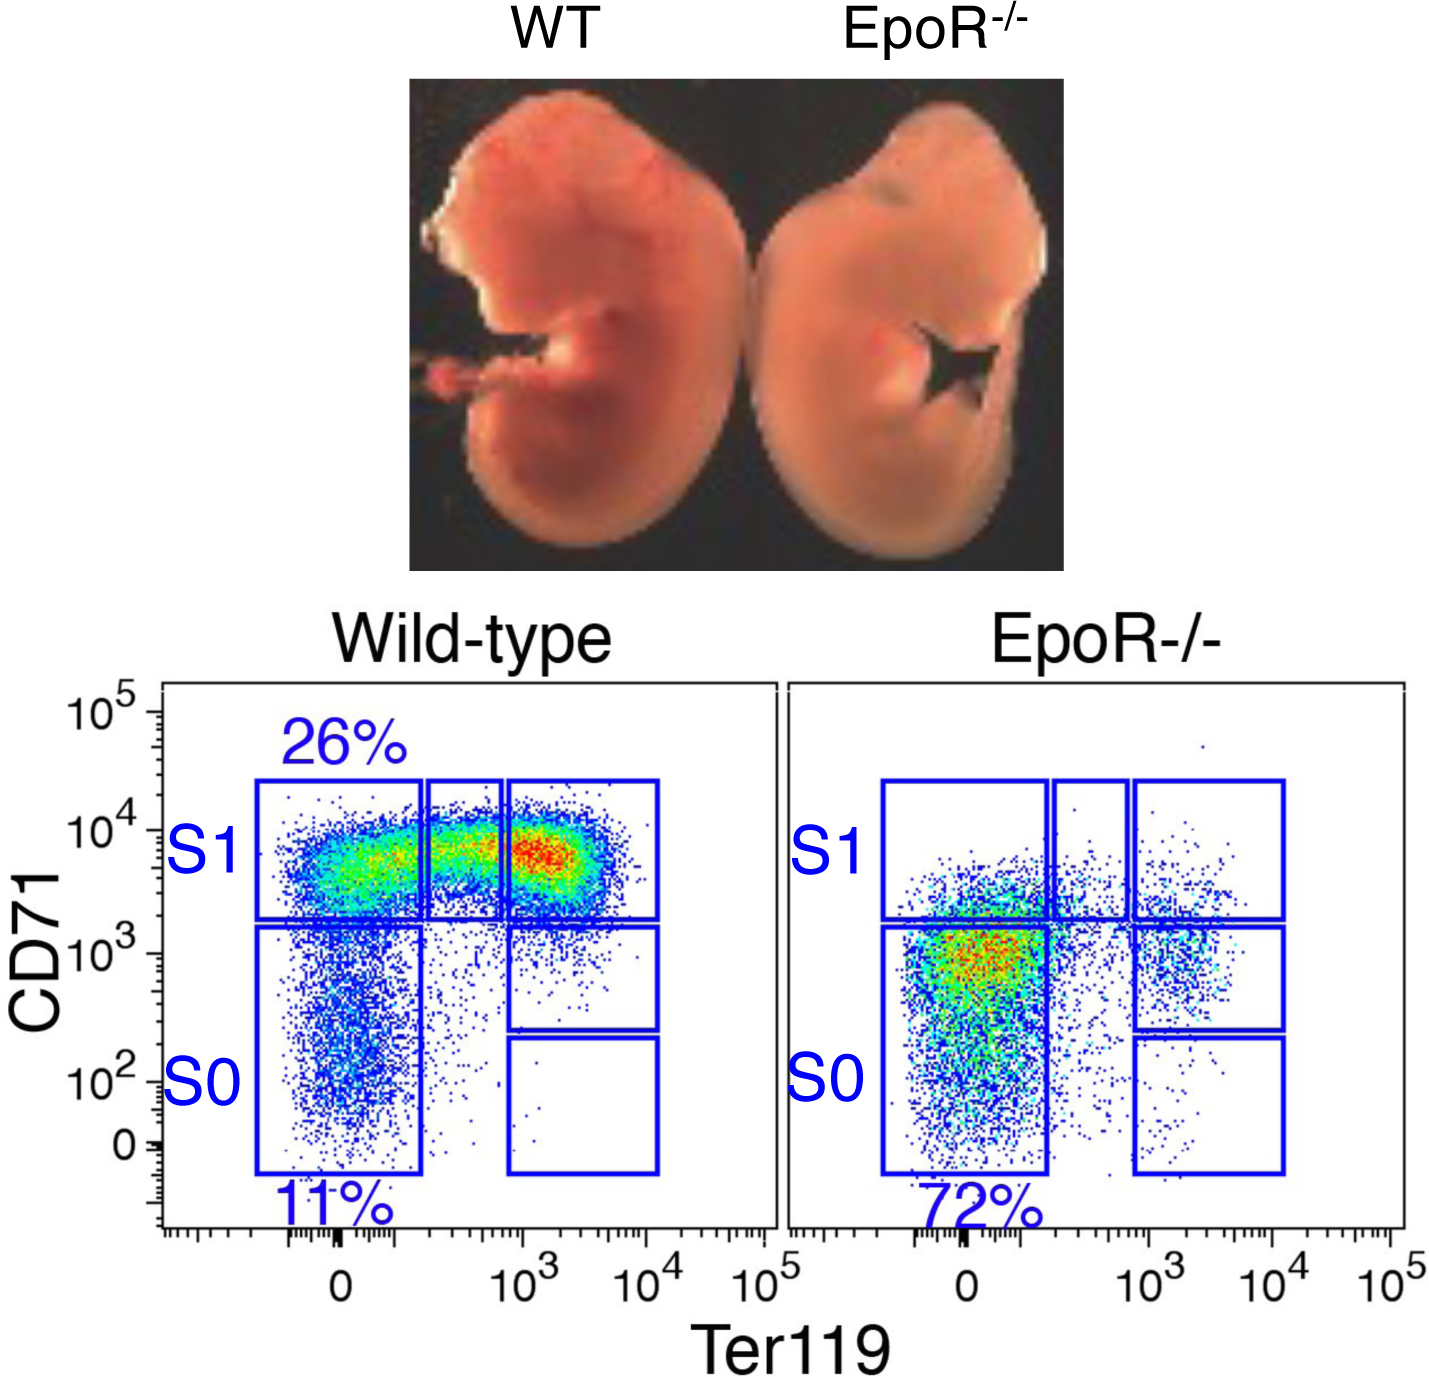
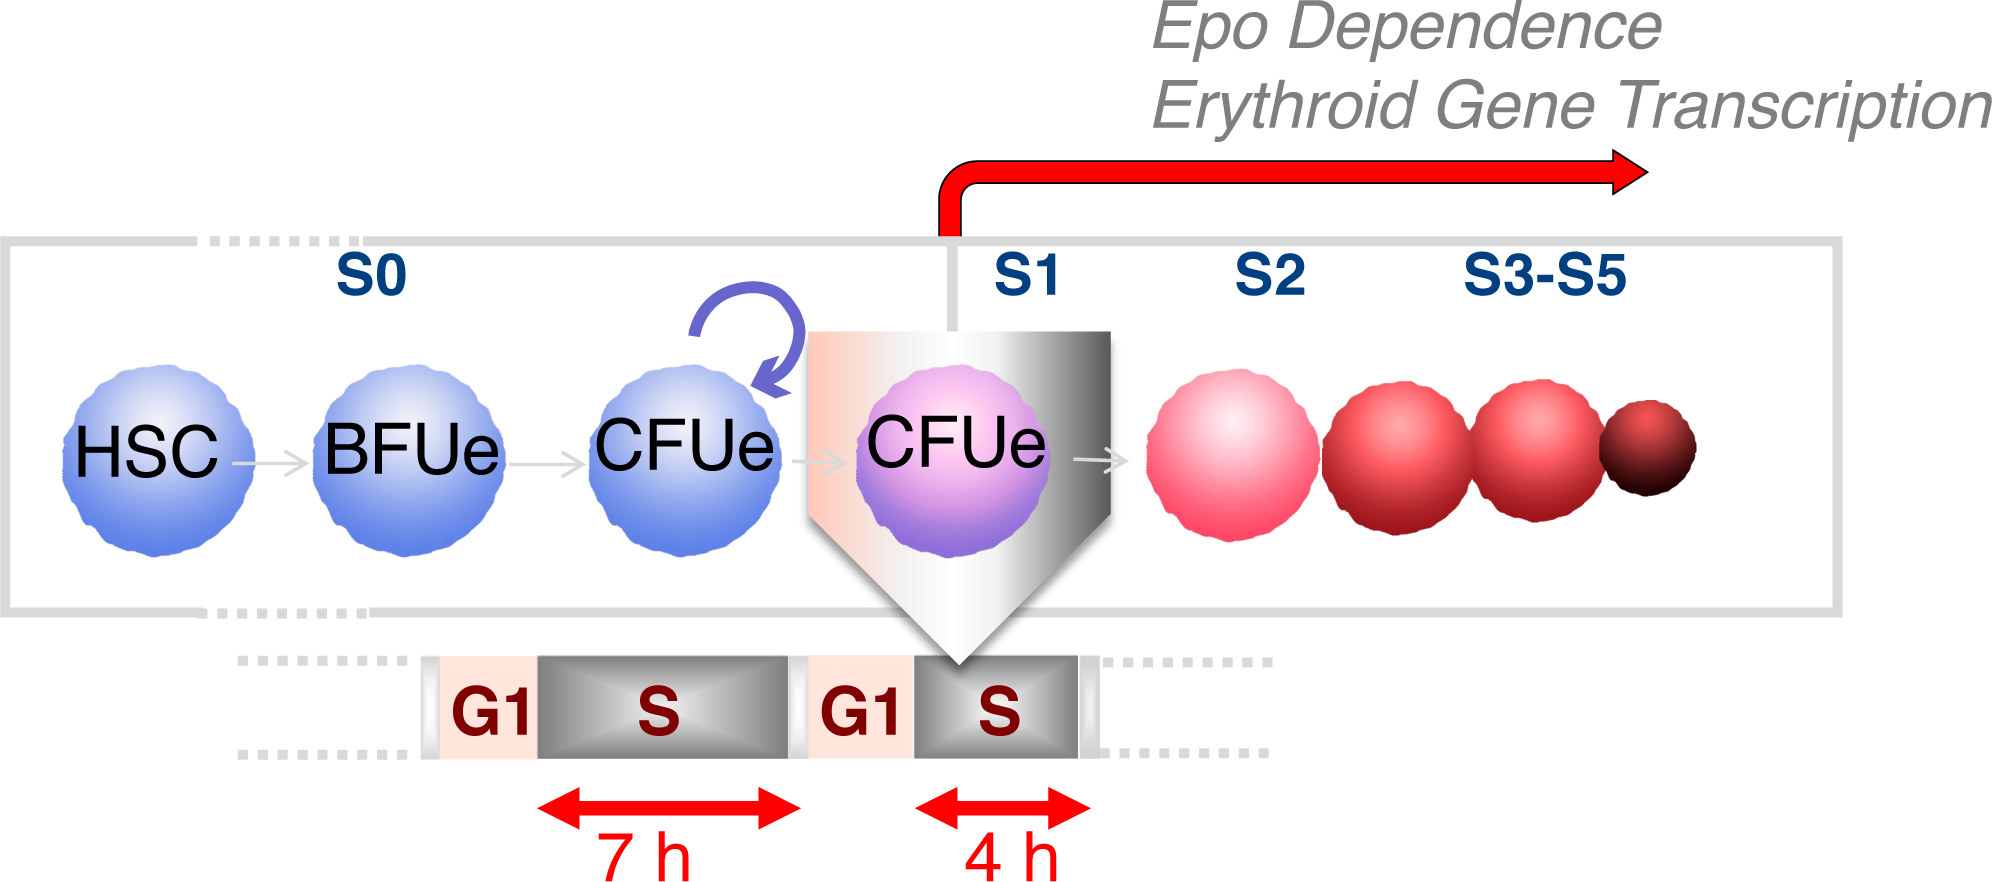
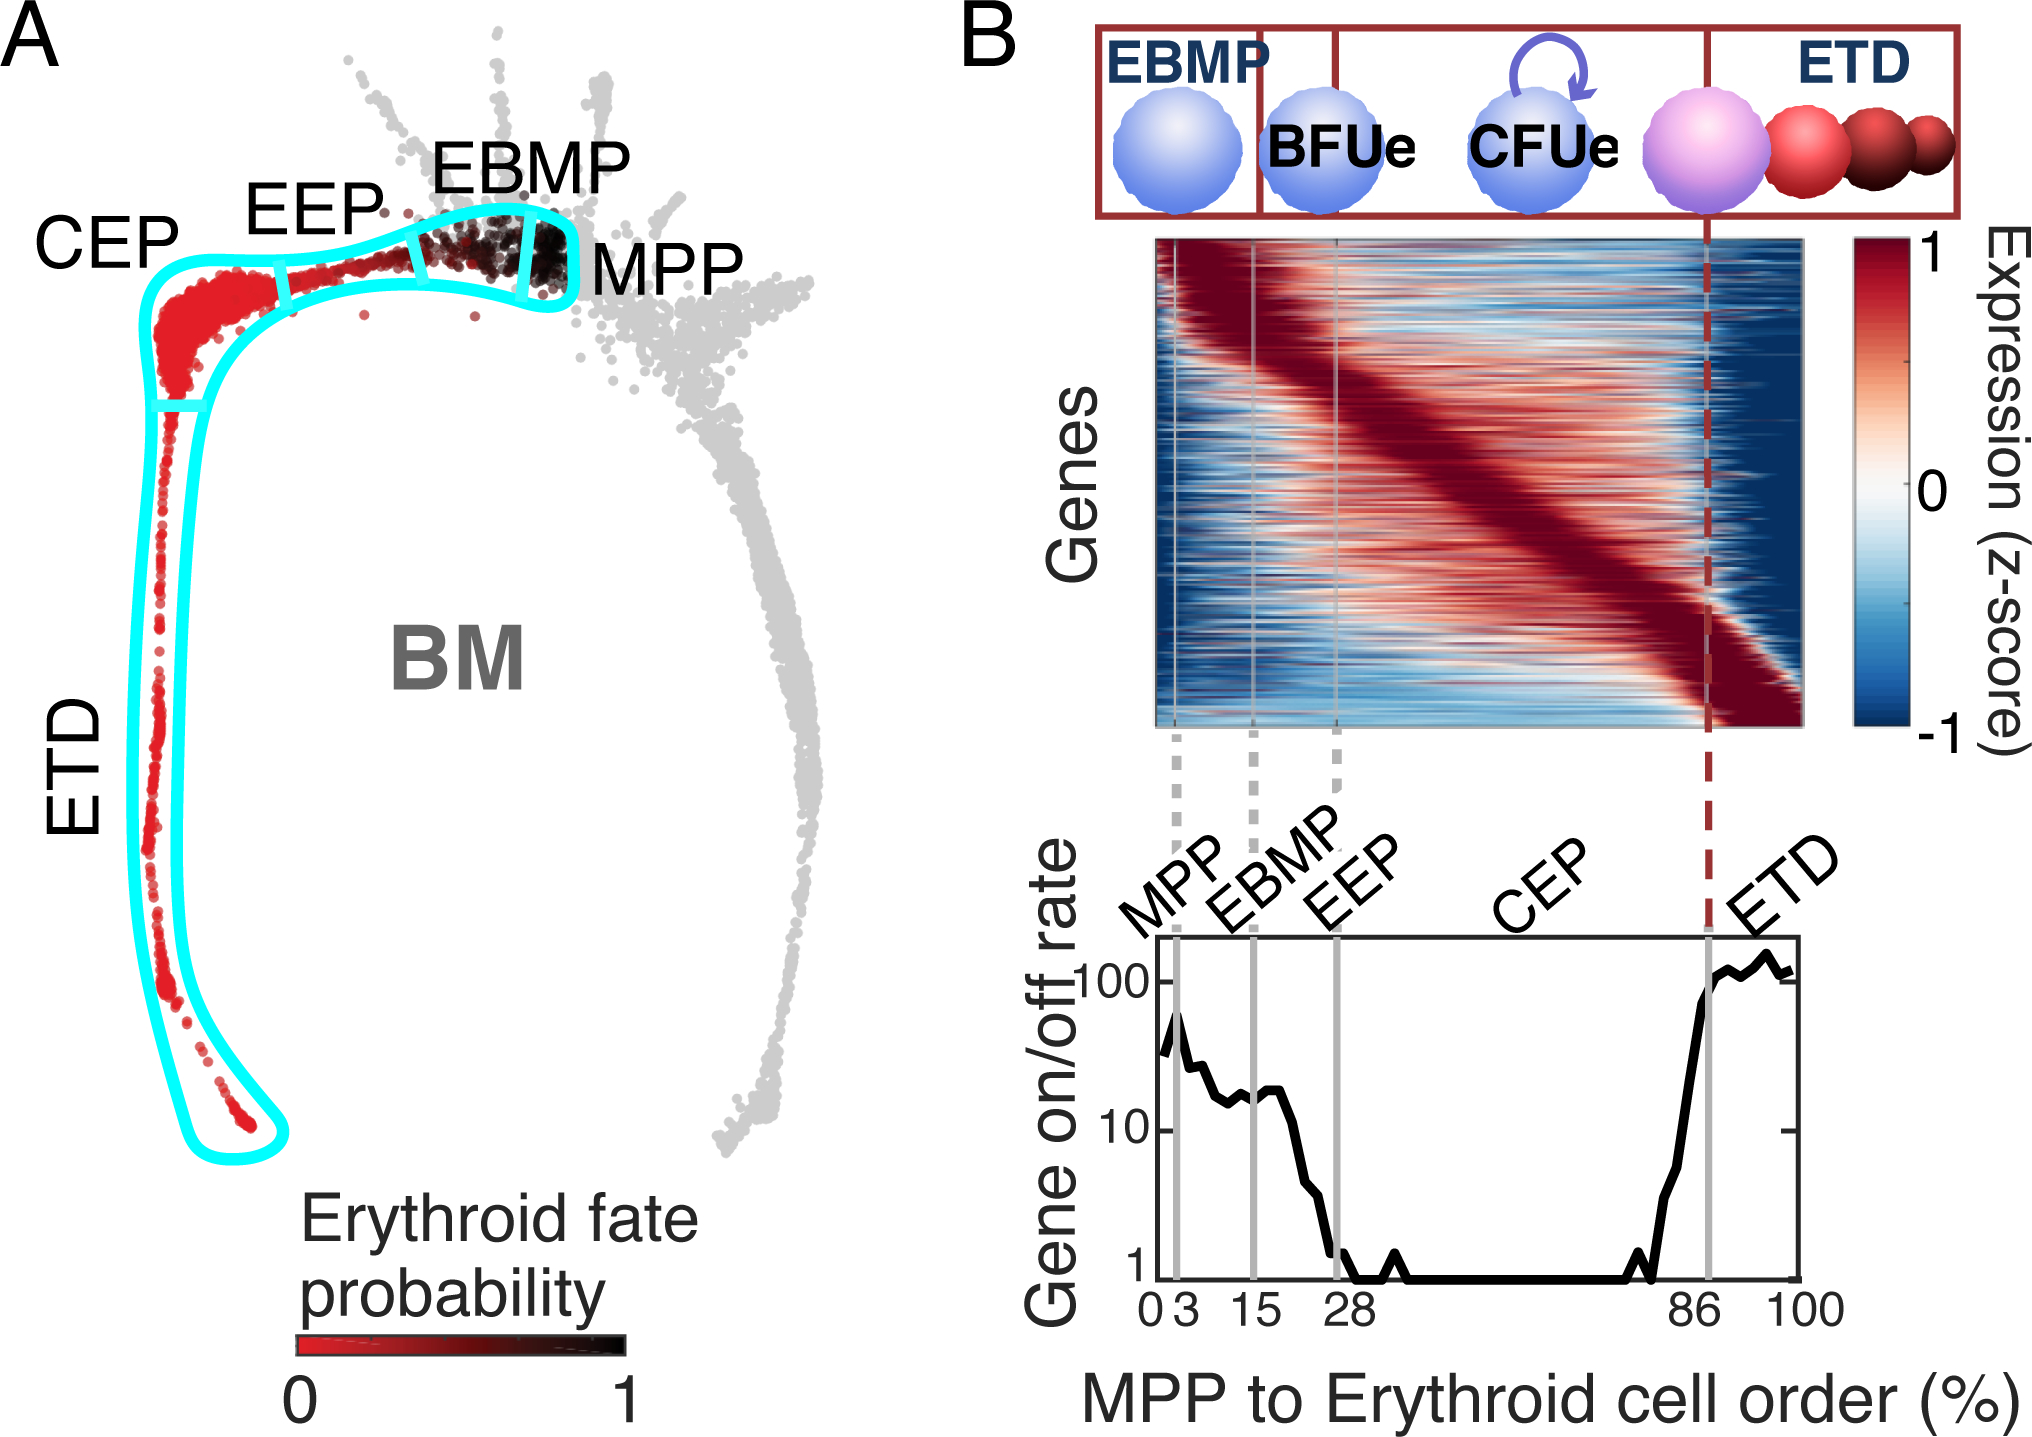
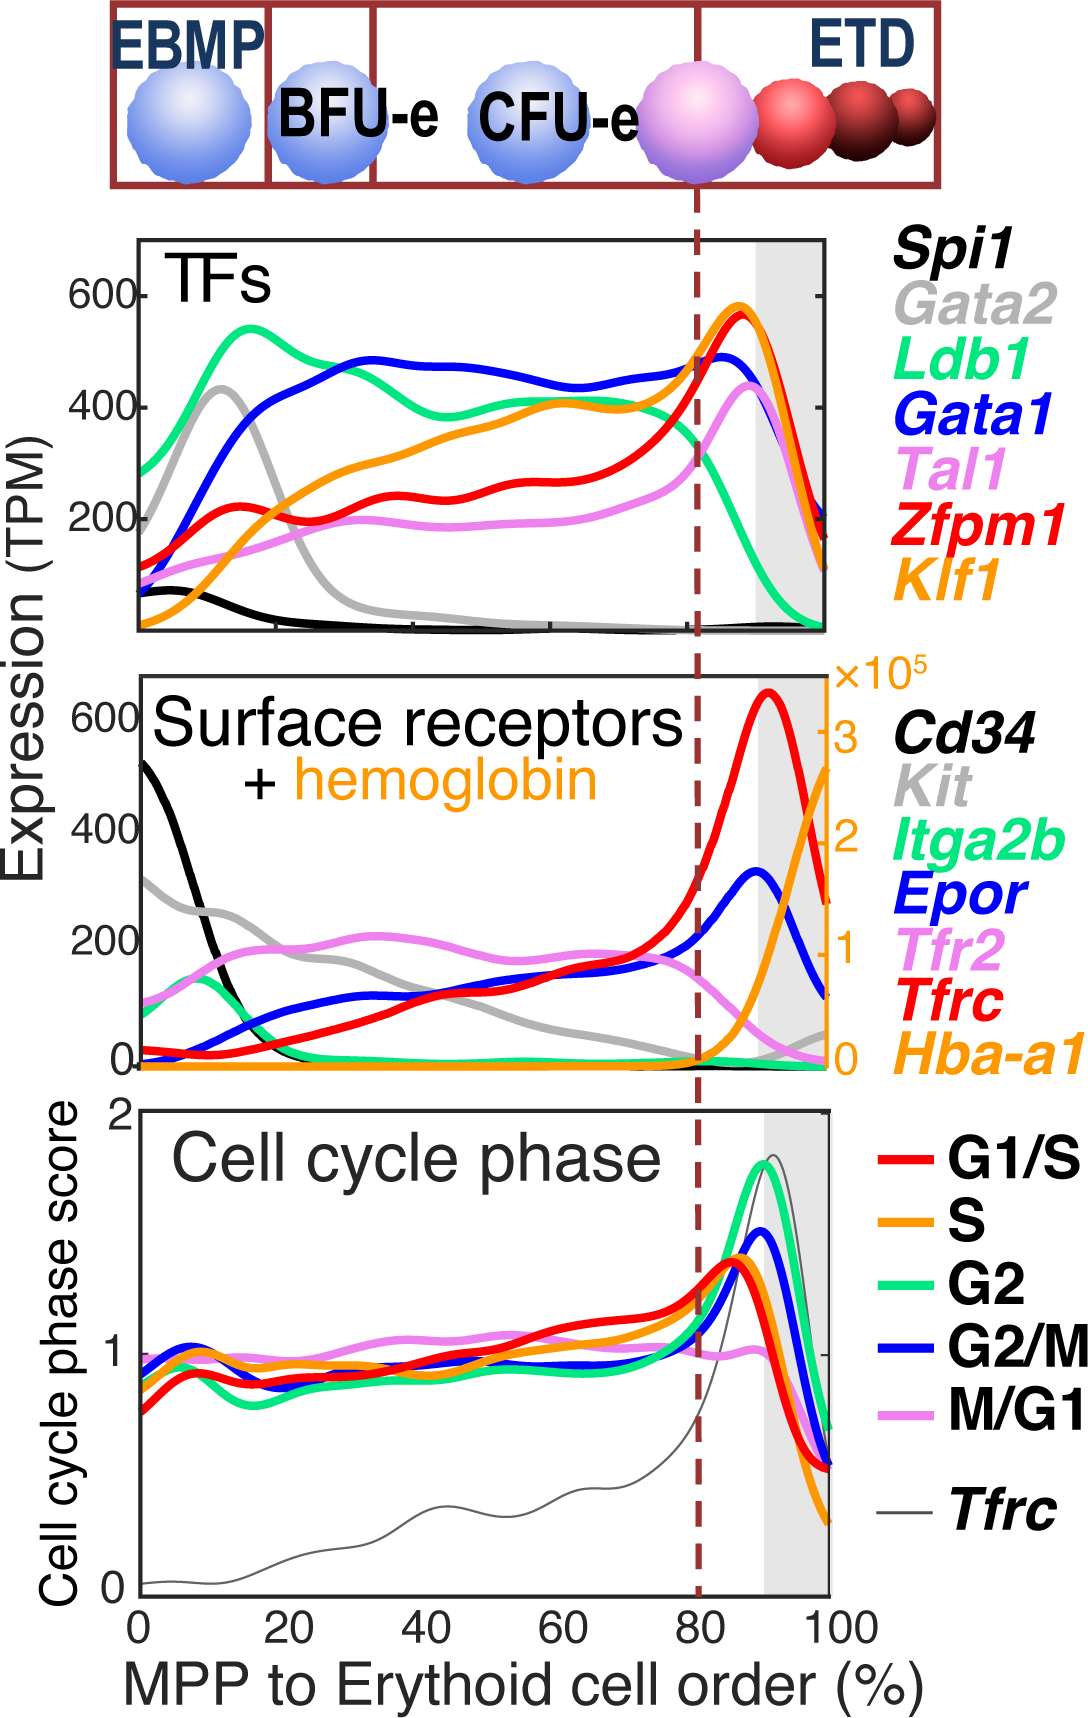
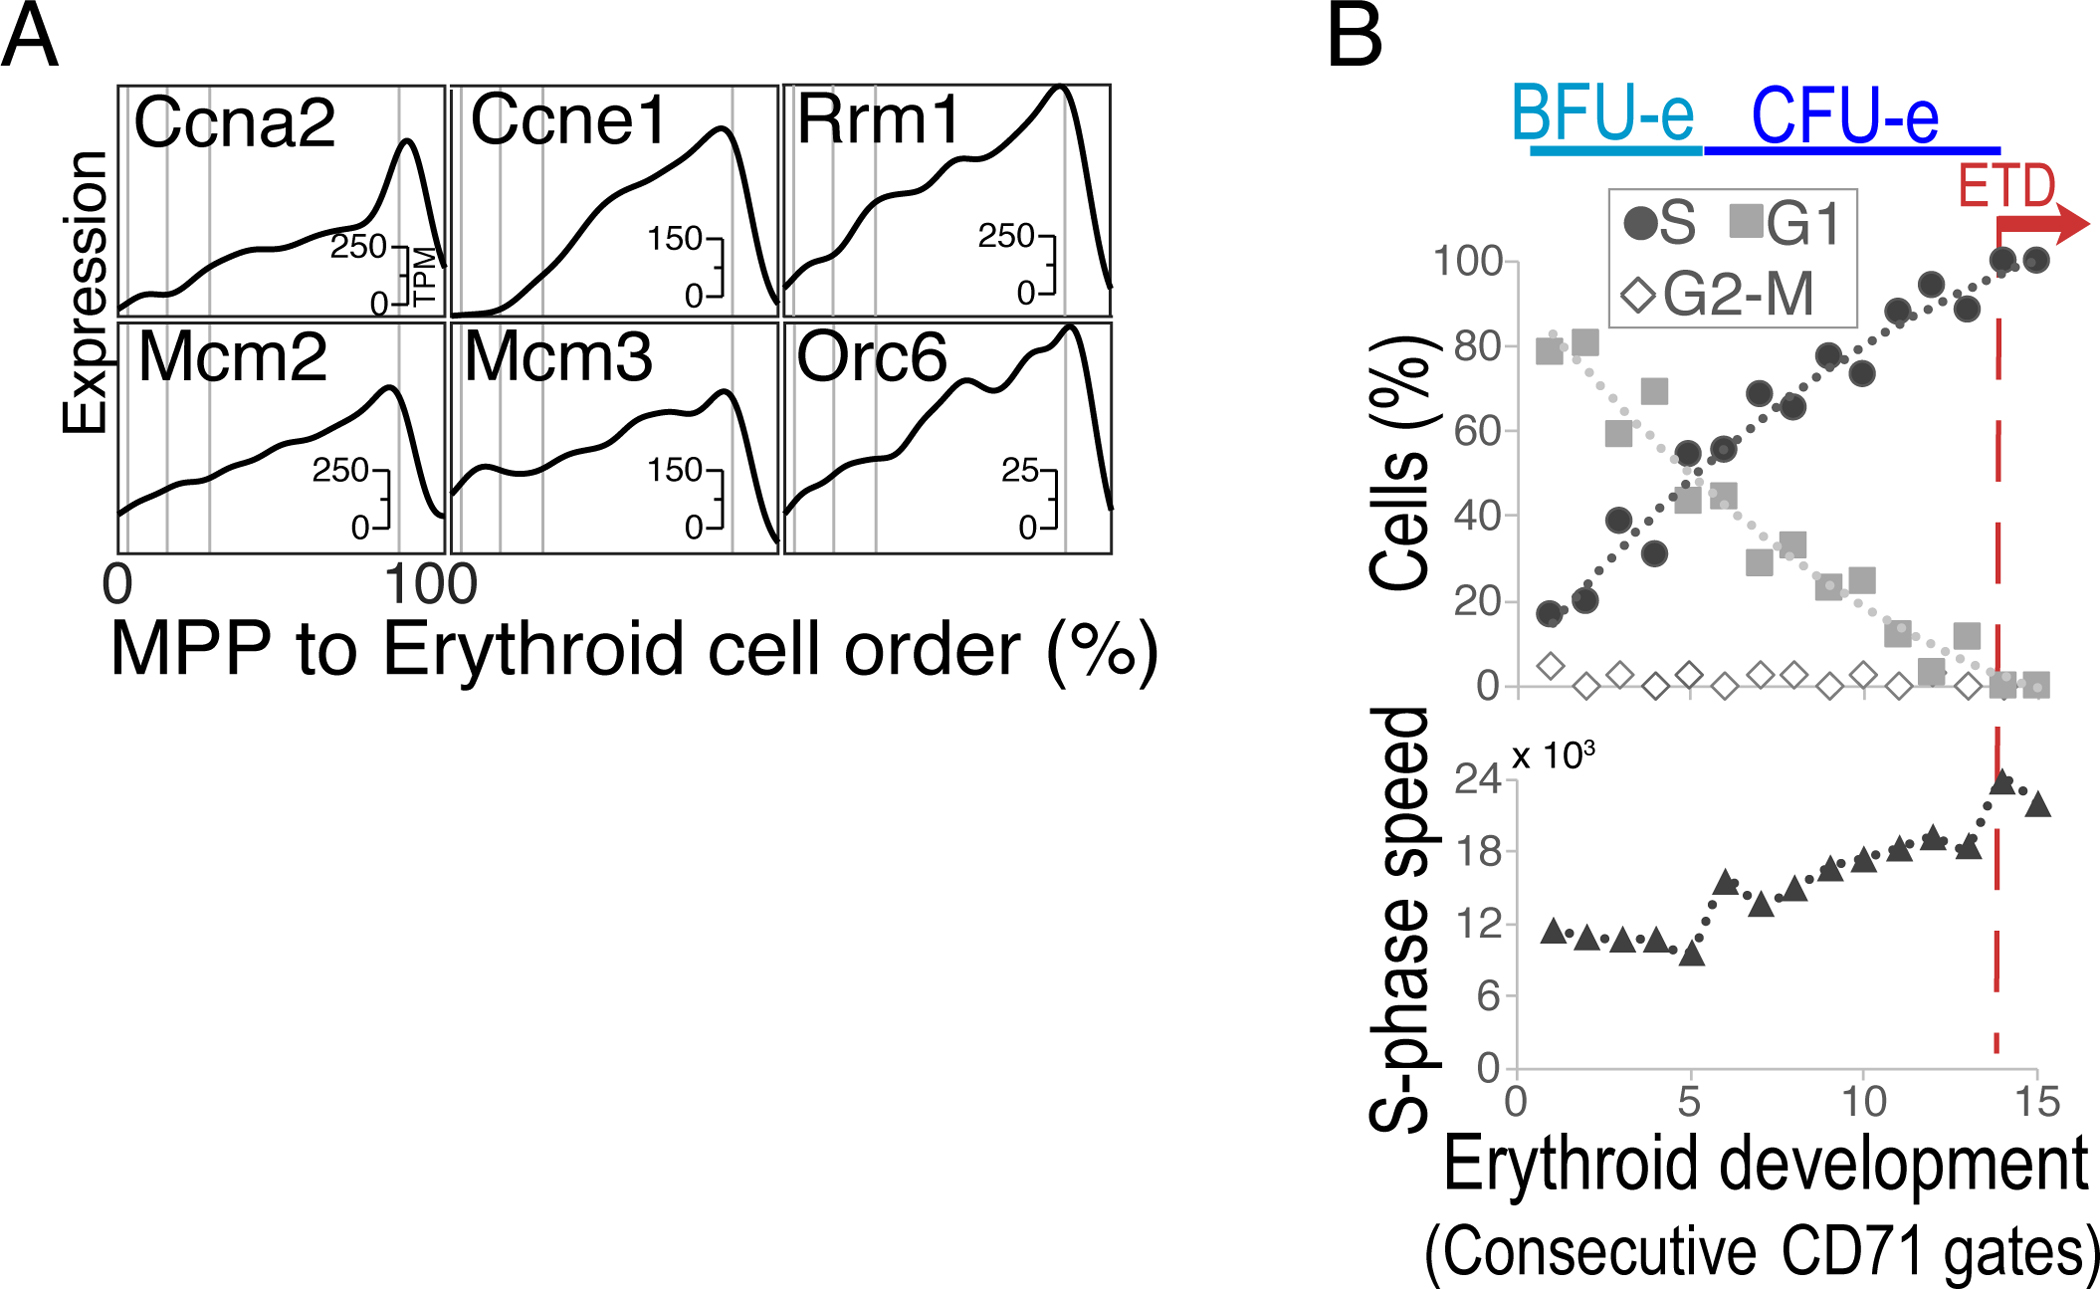
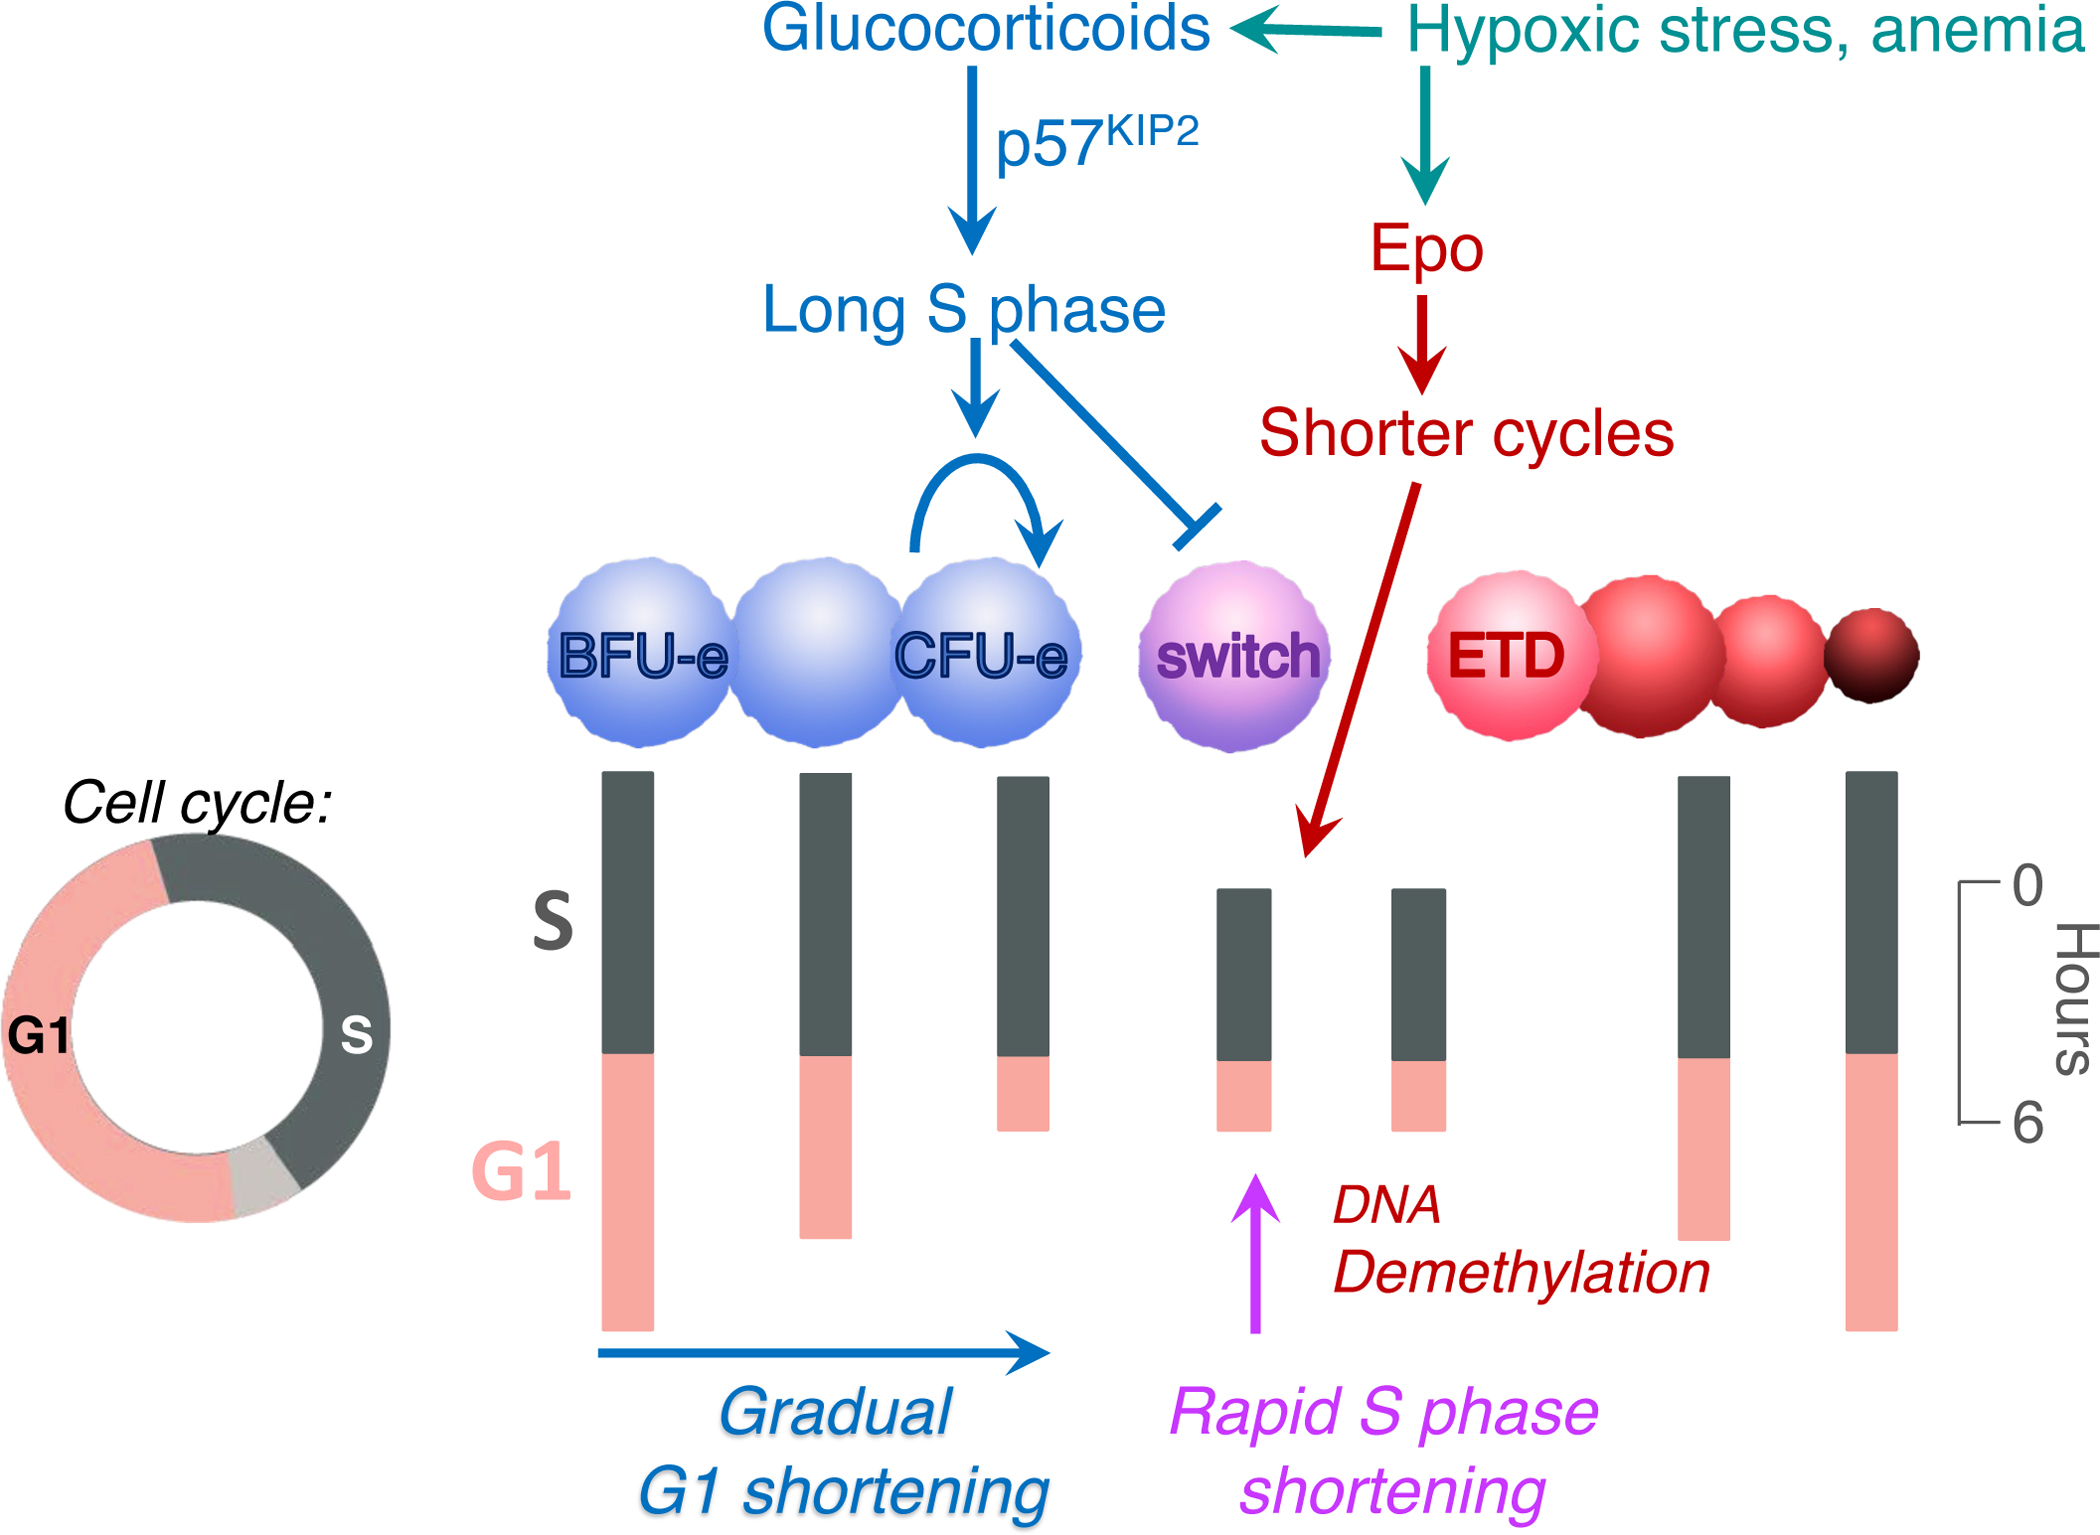
Early erythroid progenitors known as CFU-e undergo multiple self-renewal cell cycles. The CFU-e developmental stage ends with the onset of erythroid terminal differentiation (ETD). The transition from CFU-e to ETD is a critical cell fate decision that determines erythropoietic rate. Here we review recent insights into the regulation of this transition, garnered from flow cytometric and single-cell RNA sequencing studies. We find that the CFU-e/ETD transition is a rapid S phase-dependent transcriptional switch. It takes place during an S phase that is much shorter than in preceding or subsequent cycles, as a result of globally faster replication forks. Furthermore, it is preceded by cycles in which G1 becomes gradually shorter. These dramatic cell cycle and S phase remodeling events are directly linked to regulation of the CFU-e/ETD switch. Moreover, regulators of erythropoietic rate exert their effects by modulating cell cycle duration and S phase speed. Glucocorticoids increase erythropoietic rate by inducing the CDK inhibitor p57KIP2, which slows replication forks, inhibiting the CFU-e/ETD switch. Conversely, erythropoietin promotes induction of ETD by shortening the cycle. S phase shortening was reported during cell fate decisions in non-erythroid lineages, suggesting a fundamentally new developmental role for cell cycle speed.
Keywords: CDK inhibitors; Cell cycle; Erythropoiesis; Erythropoietic stress response; Glucocorticoids; Replication forks.
© 2022. Japanese Society of Hematology.
Conflict of interest statement
The authors declare that they have no conflict of interest.
Figures
Similar articles
-
Pas de deux: the coordinated coupling of erythroid differentiation with the cell cycle.Curr Opin Hematol. 2024 May 1;31(3):96-103. doi: 10.1097/MOH.0000000000000811. Epub 2024 Feb 16. Curr Opin Hematol. 2024. PMID: 38415760 Free PMC article. Review.
-
The Black Book of Psychotropic Dosing and Monitoring.Psychopharmacol Bull. 2024 Jul 8;54(3):8-59. Psychopharmacol Bull. 2024. PMID: 38993656 Free PMC article. Review.
-
Short-Term Memory Impairment.2024 Jun 8. In: StatPearls [Internet]. Treasure Island (FL): StatPearls Publishing; 2025 Jan–. 2024 Jun 8. In: StatPearls [Internet]. Treasure Island (FL): StatPearls Publishing; 2025 Jan–. PMID: 31424720 Free Books & Documents.
-
Comparison of Two Modern Survival Prediction Tools, SORG-MLA and METSSS, in Patients With Symptomatic Long-bone Metastases Who Underwent Local Treatment With Surgery Followed by Radiotherapy and With Radiotherapy Alone.Clin Orthop Relat Res. 2024 Dec 1;482(12):2193-2208. doi: 10.1097/CORR.0000000000003185. Epub 2024 Jul 23. Clin Orthop Relat Res. 2024. PMID: 39051924
-
Global increase in replication fork speed during a p57KIP2-regulated erythroid cell fate switch.Sci Adv. 2017 May 26;3(5):e1700298. doi: 10.1126/sciadv.1700298. eCollection 2017 May. Sci Adv. 2017. PMID: 28560351 Free PMC article.
Cited by
-
Pas de deux: the coordinated coupling of erythroid differentiation with the cell cycle.Curr Opin Hematol. 2024 May 1;31(3):96-103. doi: 10.1097/MOH.0000000000000811. Epub 2024 Feb 16. Curr Opin Hematol. 2024. PMID: 38415760 Free PMC article. Review.
-
diffGEK: differential gene expression kinetics.Bioinformatics. 2025 Jun 2;41(6):btaf316. doi: 10.1093/bioinformatics/btaf316. Bioinformatics. 2025. PMID: 40495353 Free PMC article.
-
RNA Polymerase II pausing temporally coordinates cell cycle progression and erythroid differentiation.medRxiv [Preprint]. 2023 Mar 7:2023.03.03.23286760. doi: 10.1101/2023.03.03.23286760. medRxiv. 2023. Update in: Dev Cell. 2023 Oct 23;58(20):2112-2127.e4. doi: 10.1016/j.devcel.2023.07.018. PMID: 36945604 Free PMC article. Updated. Preprint.
-
RNA polymerase II pausing temporally coordinates cell cycle progression and erythroid differentiation.Dev Cell. 2023 Oct 23;58(20):2112-2127.e4. doi: 10.1016/j.devcel.2023.07.018. Epub 2023 Aug 15. Dev Cell. 2023. PMID: 37586368 Free PMC article.
-
Defect in hematopoiesis and embryonic lethality at midgestation of Vps13a/Vps13c double knockout mice.bioRxiv [Preprint]. 2025 May 13:2025.05.09.653147. doi: 10.1101/2025.05.09.653147. bioRxiv. 2025. PMID: 40463036 Free PMC article. Preprint.
References
-
- Axelrad AA; McLeod DL; Shreeve MM; Heath DS, Properties of cells that produce erythrocytic colonies in vitro. In Hemopoiesis in culture, Robinson WA, Ed. U.S. Government Printing Office: Washington, 1974.
-
- Heath DS; Axelrad AA; McLeod DL; Shreeve MM, Separation of the erythropoietin-responsive progenitors BFU-E and CFU-E in mouse bone marrow by unit gravity sedimentation. Blood 1976, 47 (5), 777–92. - PubMed
-
- Iscove NN; Sieber F, Erythroid progenitors in mouse bone marrow detected by macroscopic colony formation in culture. Exp Hematol 1975, 3 (1), 32–43. - PubMed
Publication types
MeSH terms
Substances
Grants and funding
LinkOut - more resources
Full Text Sources
