. 2022 Jun 27;18(6):e1010206.
doi: 10.1371/journal.pcbi.1010206. eCollection 2022 Jun.

Inferring the effective reproductive number from deterministic and semi-deterministic compartmental models using incidence and mobility data

Affiliations

Inferring the effective reproductive number from deterministic and semi-deterministic compartmental models using incidence and mobility data

Jair Andrade et al. PLoS Comput Biol. .

Abstract

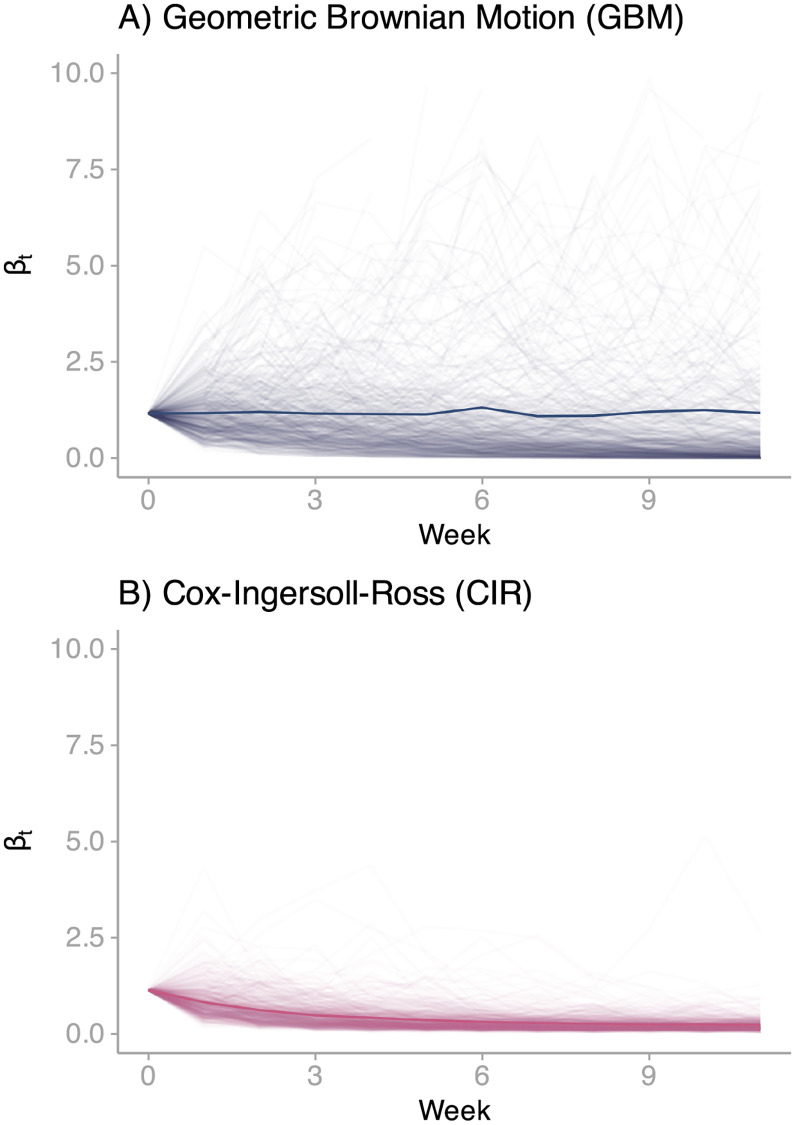
The effective reproduction number (ℜt) is a theoretical indicator of the course of an infectious disease that allows policymakers to evaluate whether current or previous control efforts have been successful or whether additional interventions are necessary. This metric, however, cannot be directly observed and must be inferred from available data. One approach to obtaining such estimates is fitting compartmental models to incidence data. We can envision these dynamic models as the ensemble of structures that describe the disease's natural history and individuals' behavioural patterns. In the context of the response to the COVID-19 pandemic, the assumption of a constant transmission rate is rendered unrealistic, and it is critical to identify a mathematical formulation that accounts for changes in contact patterns. In this work, we leverage existing approaches to propose three complementary formulations that yield similar estimates for ℜt based on data from Ireland's first COVID-19 wave. We describe these Data Generating Processes (DGP) in terms of State-Space models. Two (DGP1 and DGP2) correspond to stochastic process models whose transmission rate is modelled as Brownian motion processes (Geometric and Cox-Ingersoll-Ross). These DGPs share a measurement model that accounts for incidence and transmission rates, where mobility data is assumed as a proxy of the transmission rate. We perform inference on these structures using Iterated Filtering and the Particle Filter. The final DGP (DGP3) is built from a pool of deterministic models that describe the transmission rate as information delays. We calibrate this pool of models to incidence reports using Hamiltonian Monte Carlo. By following this complementary approach, we assess the tradeoffs associated with each formulation and reflect on the benefits/risks of incorporating proxy data into the inference process. We anticipate this work will help evaluate the implications of choosing a particular formulation for the dynamics and observation of the time-varying transmission rate.


Conflict of interest statement

I have read the journal’s policy and the authors of this manuscript have the following competing interests: 1. Prof. Jim Duggan is a member of the WHO Global Outbreak and Response Network (GOARN), through the involvement of the National University of Ireland Galway as a GOARN partner. (NGO) 2. Prof. Jim Duggan is a member of the Irish Epidemiological Modelling Advisory Group (IEMAG), and in this volunteering role, provides modelling advice to the Department of Health, Ireland. Also, the work presented is independent of (1) and has only benefited from an aggregated data set received from (2).

Figures

Fig 1
Fig 1. Schematic diagram of the data generating processes (DGPs) explored in this paper.
This diagram aims to portray the DGPs as the ensemble of two components: a measurement or observational model (ellipse) and a process model (rounded rectangle). For instance, DGP1 is the amalgamation of the measurement model OM1 and the process model PM1. The process model is in turn the ensamble of two structures: a within-host profile (hexagon) and a time-dependent transmission rate (rhombus). Whereas all process models share a common within-host profile (SEI3R), they differ in the formulation of the transmission rate: Geometric Brownian Motion (GBM), Cox-Ingersoll-Ross (CIR), and nth-order exponential smoothing (NTH-SM). The inference method employed on each DGP depends upon the nature of the process model (Iterated Filtering + Particle Filter for stochastic structures and Hamiltonian Monte Carlo for deterministic ones).
Fig 2
Fig 2. Incidence and mobility data.
(A) Daily number (rhombus-shaped points) of COVID-19 cases detected during Ireland’s first wave, from the 29th of February 2020 to the 17th of May 2020. The x-axis indicates the date in which the infected individuals were swabbed. The line represents the smoothed trend (via LOESS method) from the data (B) Weekly number of COVID-19 cases detected in during Ireland’s first wave. The x-axis indicates the number of weeks since the first case was detected. (C) Apple data for Ireland from the 29th of February 2020 to the 17th of May 2020. Points represent the normalised amount of daily requests for driving directions. These indexes are normalised to the value on the 28th of February 2020. We highlight points every 7 days. These highlighted points are used to calibrate DGP1 and DGP2. The line represents the smoothed trend (via LOESS method) from the data. (D) Normalised amount of daily requests for driving directions at the end of each week starting from the 29th of February 2020. These bars correspond to the highlighted points in C.
Fig 3
Fig 3. Brownian motion trajectories.
(A) 200 simulations from a transmission rate described in terms of Geometric Brownian Motion. We generate these simulations from DGP1’s Maximum Likelihood Estimate (MLE) using the Euler-Maruyama algorithm. The highlighted trend corresponds to the mean trajectory path. (B) 200 simulations from a transmission rate described in terms of the Cox-Ingersoll-Ross model. We generate these simulations from DGP2’s Maximum Likelihood Estimate (MLE) using the Euler-Maruyama algorithm. The highlighted trend corresponds to the mean trajectory path.
Fig 4
Fig 4. Inference on DGP1.
In these three figures, the predicted values stem from DGP1’s filtering distribution. Further, in the LHS, the solid line indicates the median, and the darker and lighter ribbons represent the 50% and 95% CI, respectively. (A) Comparison between the predicted incidence (solid line and ribbons in the LHS; violin plots in the RHS) and weekly detected cases from Ireland’s first COVID-19 wave (rhombi in the LHS; horizontal dotted lines in the RHS). (B) Comparison between the predicted relative transmission rate (solid line and ribbons in the LHS; violin plots in the RHS) compared to Apple’s mobility indexes in Ireland (points in the LHS; horizontal dotted lines in the RHS). (C) Predicted effective reproduction number (solid line and ribbons in the LHS; violin plots in the RHS). Horizontal dashed lines denote the epidemics threshold.
Fig 5
Fig 5. Inference on DGP2.
In these three figures, the predicted values stem from DGP2’s filtering distribution. Further, in the LHS, the solid line indicates the median, and the darker and lighter ribbons represent the 50% and 95% CI, respectively. (A) Comparison between the predicted incidence (solid line and ribbons in the LHS; violin plots in the RHS) and weekly detected cases from Ireland’s first COVID-19 wave (rhombi in the LHS; horizontal dotted lines in the RHS). (B) Comparison between the predicted relative transmission rate (solid line and ribbons in the LHS; violin plots in the RHS) compared to Apple’s mobility indexes in Ireland (points in the LHS; horizontal dotted lines in the RHS). (C) Predicted effective reproduction number (solid line and ribbons in the LHS; violin plots in the RHS). Horizontal dashed lines denote the epidemics threshold.
Fig 6
Fig 6. Inference on DGP3.
Comparison between expected values and data. On the LHS, for each model, we show 100 overlapped simulations of the predicted incidence against daily case counts. On the RHS, for each model, we show 100 overlapped simulations of the predicted relative transmission rate against Apple’s mobility data. In this plot, we estimate the predicted values from the posterior distribution of each of the DGP3’s nine candidate process models.
Fig 7
Fig 7. Comparison of predicted latent states.
In this plot, predicted values stem either from the filtering distribution (DGP1 and DGP2) or the posterior predictive distribution (DGP3). Here, DGP3’s process model corresponds to the structure that describes the transmission rate in terms of a 4th-order information delay. Further, solid lines indicates the median, and the ribbons represent the 95% CI. (A) Comparison between predicted incidences by DGP (solid lines and ribbons) and weekly detected COVID-19 cases (rhombi) in Ireland during the first wave. (B) Comparison between predicted relative transmission rates by DGP (solid lines and ribbons) and Apple’s driving mobility indexes (points) in Ireland during the first wave. (C) Predicted effective reproductive numbers by DGP (solid lines and ribbons) during Ireland’s first COVID-19 wave. The dashed horizontal line denotes the epidemics threshold.

References

    1. Flaxman S, Mishra S, Gandy A, Unwin HJT, Mellan TA, Coupland H, et al.. Estimating the effects of non-pharmaceutical interventions on COVID-19 in Europe. Nature. 2020;584(7820):257–261. doi: 10.1038/s41586-020-2405-7 - DOI - PubMed
    1. Douglas M, Katikireddi SV, Taulbut M, McKee M, McCartney G. Mitigating the wider health effects of covid-19 pandemic response. BMJ. 2020;369. doi: 10.1136/bmj.m1557 - DOI - PMC - PubMed
    1. Anderson RM, May RM. Infectious Diseases of Humans: Dynamics and Control. Oxford University Press; 1992.
    1. Nishiura H, Chowell G. In: Chowell G, Hyman JM, Bettencourt LMA, Castillo-Chavez C, editors. The Effective Reproduction Number as a Prelude to Statistical Estimation of Time-Dependent Epidemic Trends. Dordrecht: Springer Netherlands; 2009. p. 103–121. Available from: 10.1007/978-90-481-2313-1_5. - DOI
    1. Vynnycky E, White R. An Introduction to Infectious Disease Modelling. Oxford University Press; 2010.

Publication types