. 2022 Jun 27;18(6):e1010667.
doi: 10.1371/journal.ppat.1010667. eCollection 2022 Jun.

PHEV infection: A promising model of betacoronavirus-associated neurological and olfactory dysfunction

Affiliations

PHEV infection: A promising model of betacoronavirus-associated neurological and olfactory dysfunction

Junchao Shi et al. PLoS Pathog. .

Abstract

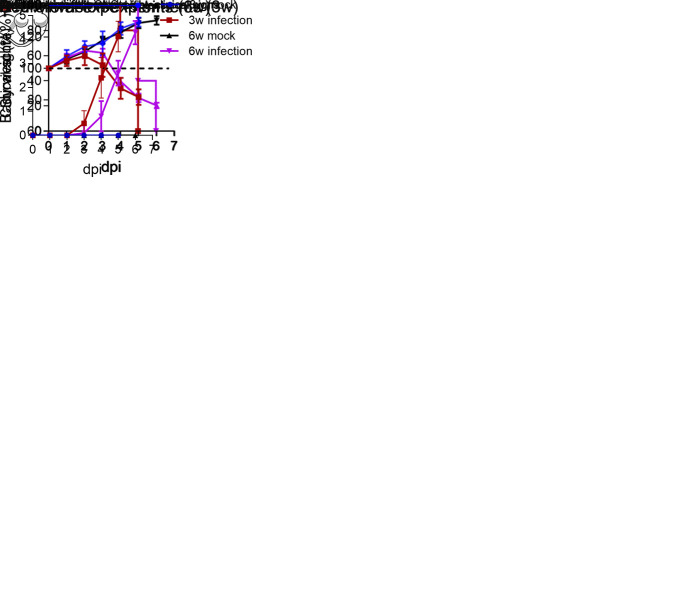
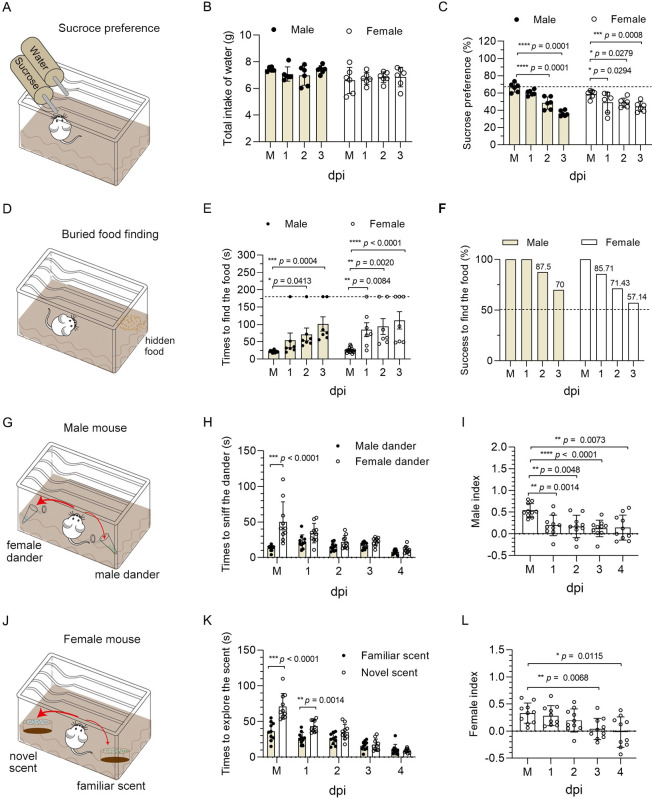
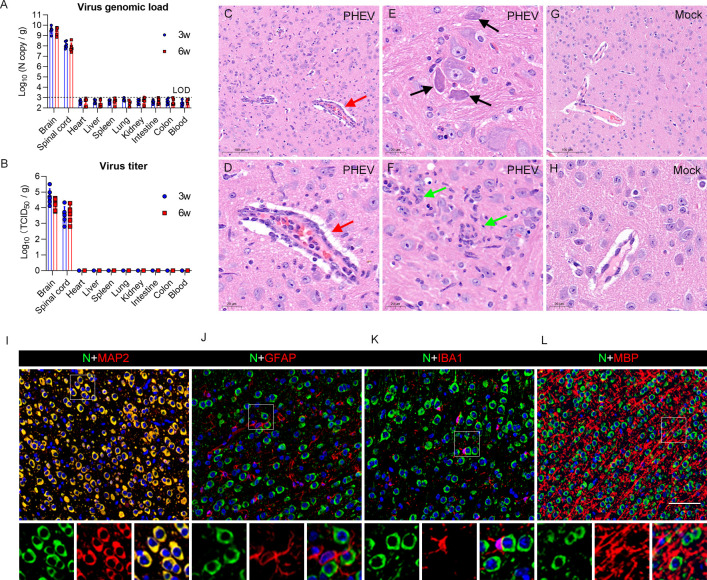
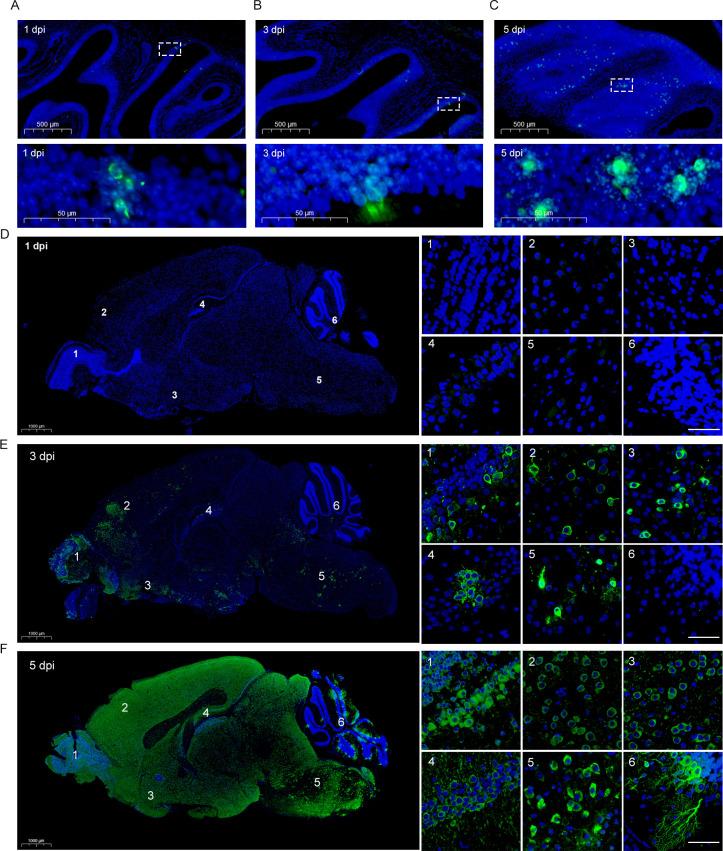
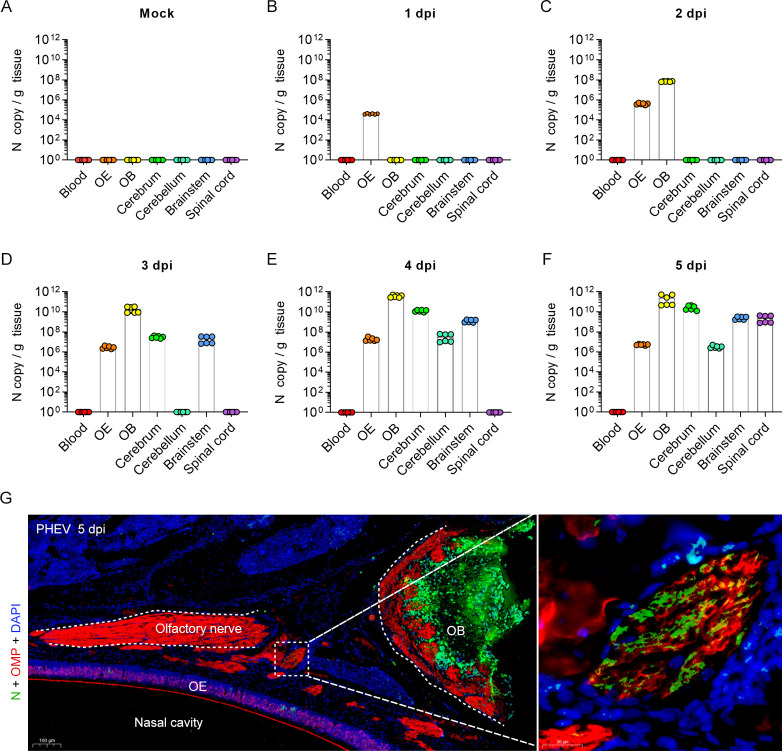
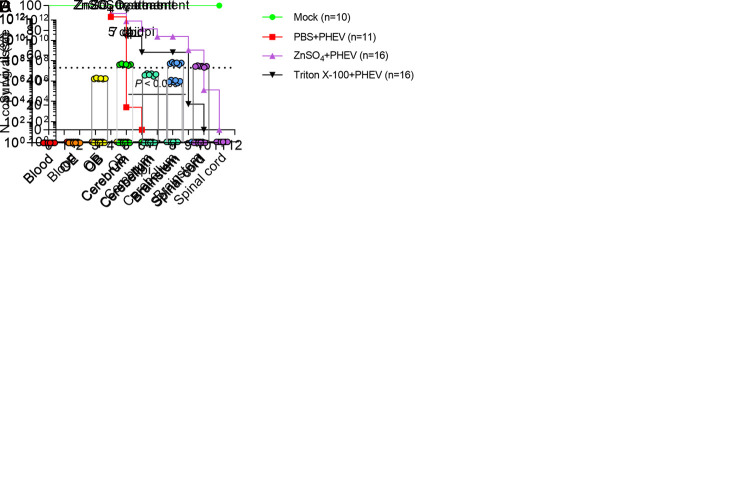
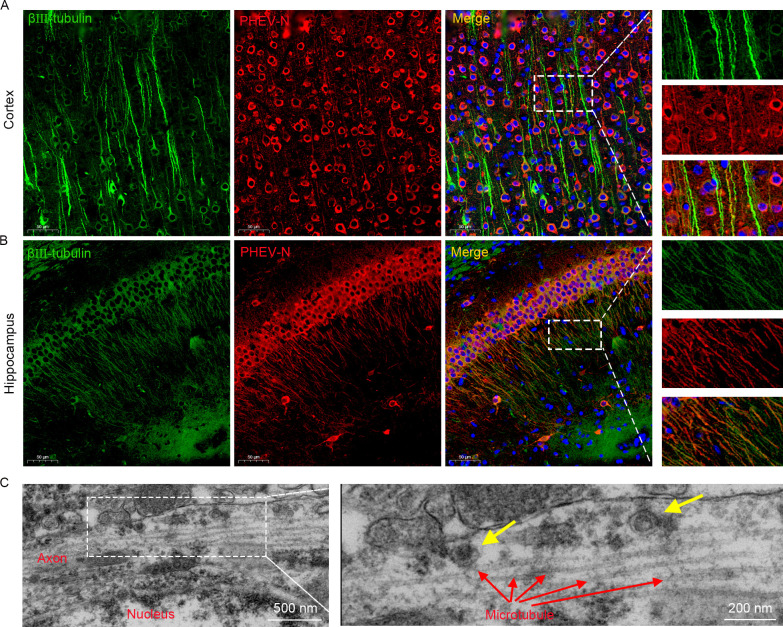
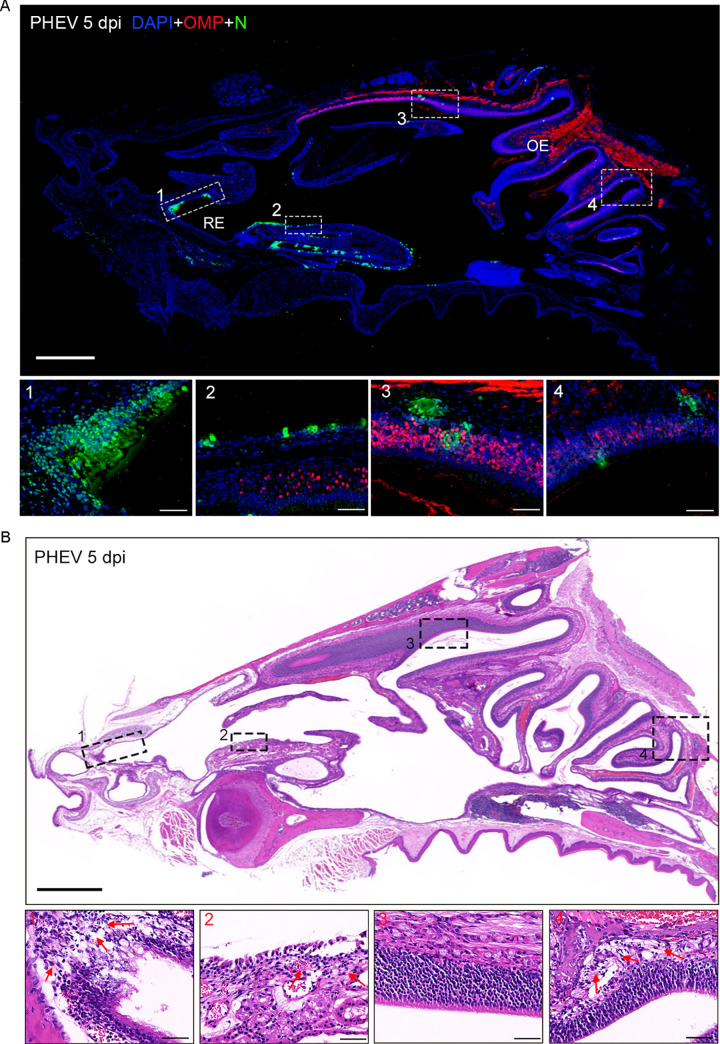
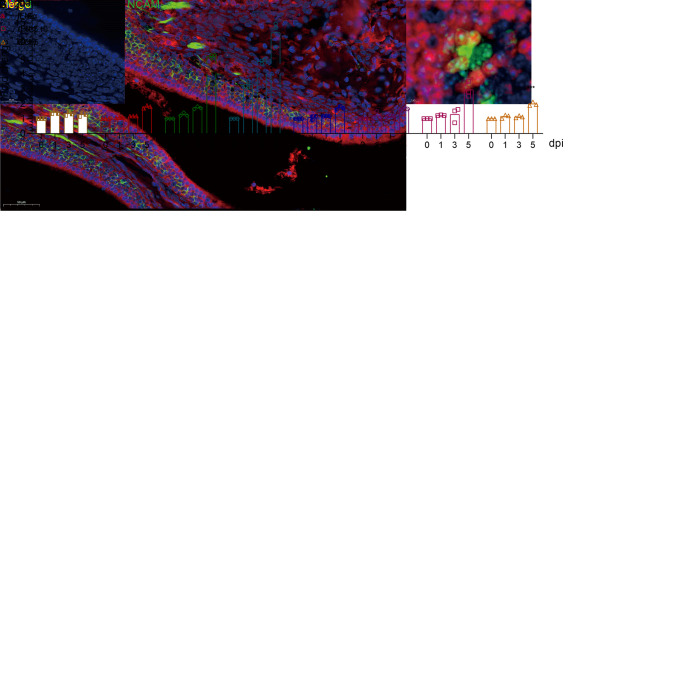
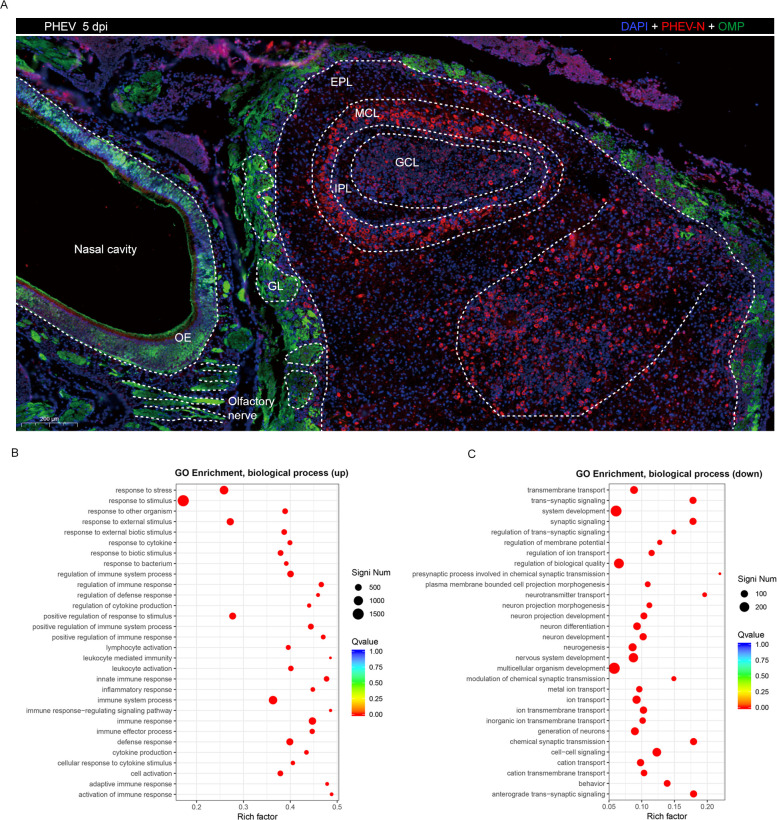
Porcine hemagglutinating encephalomyelitis virus (PHEV) is a highly neurotropic coronavirus belonging to the genus Betacoronavirus. Similar to pathogenic coronaviruses to which humans are susceptible, such as SARS-CoV-2, PHEV is transmitted primarily through respiratory droplets and close contact, entering the central nervous system (CNS) from the peripheral nerves at the site of initial infection. However, the neuroinvasion route of PHEV are poorly understood. Here, we found that BALB/c mice are susceptible to intranasal PHEV infection and showed distinct neurological manifestations. The behavioral study and histopathological examination revealed that PHEV attacks neurons in the CNS and causes significant smell and taste dysfunction in mice. By tracking neuroinvasion, we identified that PHEV invades the CNS via the olfactory nerve and trigeminal nerve located in the nasal cavity, and olfactory sensory neurons (OSNs) were susceptible to viral infection. Immunofluorescence staining and ultrastructural observations revealed that viral materials traveling along axons, suggesting axonal transport may engage in rapid viral transmission in the CNS. Moreover, viral replication in the olfactory system and CNS is associated with inflammatory and immune responses, tissue disorganization and dysfunction. Overall, we proposed that PHEV may serve as a potential prototype for elucidating the pathogenesis of coronavirus-associated neurological complications and olfactory and taste disorders.


Conflict of interest statement

The authors have declared that no competing interests exist.

Figures

Fig 1
Fig 1. Intranasal inoculation of PHEV in BALB/c mice results in lethal infection.
Three-week-old (3w) and six-week-old (6w) BALB/c mice were mock-infected (n = 3/sex/age) or intranasally inoculated (n = 5/sex/age) with 103.96 TCID50 PHEV. (A) Schematic diagram of the study design and workflow. Mice were monitored daily for survival (B), relative weight change (C), and clinical signs (D). Statistical analyses were performed using log-rank (Mantel–Cox) tests (B), Wilcoxon matched-pairs rank test (C), and one-way ANOVA, two-tailed Student’s t test (D). Data are representative of three replicate experiments and are shown as the means ± SD.
Fig 2
Fig 2. PHEV-associated anosmia and ageusia in BALB/c mice.
The 6w male and female BALB/c mice were intranasally inoculated with 103.96 TCID50 PHEV or mock-infected with PBS (M), and a series of behavioral experiments was performed to assess the olfactory and taste functions in mock and PHEV-infected mice. (A) Schematic diagram of the sucrose preference test (n = 6 per sex). (B) Total intake of water overnight. (C) Sucrose preference of mock and PHEV-infected mice at 1–3 dpi. Each circle represents a mouse. (D) Schematic diagram of the buried food finding test (n = 7 per sex). (E) The time it took for male and female mice to find buried food. The dashed line represents the time limit of 3 min. (F) Percentage of mice that successfully found buried food within 3 min. (G) Schematic diagram of the social scent-discrimination test for male mice (n = 10). (H) Time that male mice spent sniffing male or female dander. (I) Preference indices for male mice. (J) Schematic diagram of the social scent-discrimination test for female mice (n = 10). (K) Time that female mice spent exploring familiar or novel scents. (L) Preference indices for female mice. P values were calculated by two-way ANOVA (B, C, E, H and K) and the two-tailed Mann–Whitney U test (I and L). Data are representative of three replicate experiments and are shown as the means ± SD.
Fig 3
Fig 3. Brain damage and viral tropism in the CNS of PHEV-infected mice.
(A-B) The 3w and 6w BALB/c mice were inoculated with 103.96 TCID50 PHEV and samples were collected at 5 dpi for qRT–PCR and viral titer determination (n = 6). (A) Viral genome loads were monitored in different organs and blood. The limit of detection (LOD) is shown with a dashed line. (B) Infectious viral titers were detected in different organs (n = 6). (C-L) The 3w BALB/c mice were intranasally inoculated with 103.96 TCID50 PHEV. Mice were euthanized at 5 dpi, and brain samples were harvested for histopathological examination. (C-H) H&E staining of brain sections from control and PHEV-infected mice. (C-D) Lymphocytic perivascular cuffing (red arrows). (E) Dying neurons undergoing degeneration (black arrows). (F) Microglial nodules (green arrows). (G-H) Brains from mock-infected mice. (I-L) Immunofluorescence images of PHEV-infected neurons in 3w BALB/c mice. MAP-2, GFAP, IBA1, and MBP are markers for neurons, astrocytes, microglia, and oligodendroglia, respectively. Scale bars, 100 μm (C, G), 20 μm (D-F, H), and 50 μm (I-L).
Fig 4
Fig 4. Viral antigen distribution in the mouse OE and brain during PHEV infection.
The 3w BALB/c mice were inoculated intranasally with 103.96 TCID50 PHEV and sacrificed at 1, 3 and 5 dpi, respectively. (A-C) Representative images of immunofluorescence staining for viral antigens in the nasal cavity at 1 dpi (A), 3 dpi (B) and 5 dpi (C). The bottom panels show the magnified images of the dashed rectangles. Scale bars, 500 μm (A-C, top panels), 50 μm (A-C, bottom panels). (D-F) Representative images of immunofluorescence staining for viral antigens in the brains at 1 dpi (D), 3 dpi (E) and 5 dpi (F). Right panels represent the OB (panel 1), cerebral cortex (panel 2), piriform cortex (panel 3), hippocampus (panel 4), brain stem (panel 5), and cerebellum (panel 6). Scale bars, 1,000 μm (D-F, left panels), 30 μm (D-F, right panels). PHEV-N (green), DAPI (blue).
Fig 5
Fig 5. PHEV invasion into the CNS via the olfactory nerve.
The 3w BALB/c mice were inoculated intranasally with 103.96 TCID50 PHEV and sacrificed at 1–5 dpi. (A-F) Mock and PHEV-infected CNS tissues (including OB, cerebrum, cerebellum, brain stem, and spinal cord), OE, and blood were collected for PHEV N RNA quantification by qRT–PCR (n = 6). The Y axis represents the PHEV N RNA copy number per gram of tissue. (G) Detection of PHEV-positive signals (N, green) in the olfactory nerve (OMP, red) of PHEV-infected 3w mice at 5 dpi. Nuclei stained with DAPI (blue). N, PHEV nucleocapsid protein; OMP, olfactory marker protein; OE, olfactory epithelium; OB, olfactory bulb. Scale bars, 100 μm (left panel), 20 μm (right panel).
Fig 6
Fig 6. Chemical treatment delayed the time of animal death.
(A) The 3w BALB/c mice were untreated (n = 10) or intranasally irrigated with 10 μl of PBS (n = 11), ZnSO4 (0.17 M) (n = 16), or a 0.7% Triton X-100 (n = 16) solution in both nostrils daily for 3 days before intranasal inoculation with 103.96 TCID50 PHEV. The survival curves were plotted for these four groups. (B-D) The 3w BALB/c mice were intranasally irrigated with 10 μl of ZnSO4 (0.17 M) in both nostrils 3 days before intranasal inoculation with 103.96 TCID50 PHEV. Mice were euthanized at different time points, and infected CNS tissues, OE, and blood were collected for PHEV N RNA quantification by qRT–PCR. Six mice per time point were analyzed. The Y axis represents the PHEV N RNA copy number per gram of tissue.
Fig 7
Fig 7. The trigeminal nerve is an alternative route for PHEV neuroinvasion.
The 3w BALB/c mice were inoculated with 103.96 TCID50 PHEV by the intranasal route and sacrificed at 5 dpi. (A) Brains from PHEV-infected mice were subjected to immunofluorescence staining using a PHEV-N antibody (red). A magnified image of the trigeminal nerve is shown in the lower panel. (B) Trigeminal ganglions of mock- and PHEV-infected mice were immunofluorescence stained using NSE (green) and PHEV-N (red) antibodies. The right three panels represent magnified images of the area delimited by the dotted box. Arrows indicate cells colocalized with NSE and PHEV-N. DAPI stains nuclei (blue). NSE, neuron-specific enolase.
Fig 8
Fig 8. PHEV N protein and viral particles are associated with axons in vivo.
The 3w BALB/c mice were intranasally inoculated with 103.96 TCID50 PHEV. (A-B) Brains were collected at 5 dpi, sagittally sectioned, and subjected to immunofluorescence staining with β III-tubulin (green) and PHEV-N protein (red) antibodies. The nuclei were stained with DAPI (blue). (C) Brains were collected at 5 dpi and analyzed by TEM. Red arrows, microtubules. Yellow arrows, virus particles.
Fig 9
Fig 9. Viral antigen distribution and histological changes in the nasal cavity.
The 3w BALB/c mice were intranasally inoculated with 103.96 TCID50 PHEV, and nose tissue samples were collected at 5 dpi. (A) Immunofluorescence staining of PHEV-N antigens in the RE and OE of the nasal cavity at 5 dpi. Magnified images indicate N-expressing cells in RE (panels 1–2) and OE (panels 3–4). OMP, olfactory marker protein (red); N, PHEV nucleocapsid protein (green). The nuclei were stained with DAPI (blue). Scale bars, 1,000 μm (upper panel), 50 μm (lower panels 1–4). (B) H&E staining of tissue sections showed destruction and inflammatory cell infiltration of the RE (panels 1–2) and OE (panels 3–4) at 5 dpi. The red arrows represent infiltrating inflammatory cells. Scale bars, 1,000 μm (upper panel), 50 μm (lower panels 1–4).
Fig 10
Fig 10. Cell target and inflammatory responses in the OE of PHEV-infected mice.
The 3w BALB/c mice were intranasally inoculated with 103.96 TCID50 PHEV, and nose samples were collected at indicated times. (A) Immunofluorescence staining of PHEV-N (green) and olfactory neuron marker OMP (red) in OE at 5 dpi. Magnified images (panels 1–4) show the colocalization of N with OMP-expressing OSNs. (B) Immunofluorescence staining of NCAM (green) and olfactory neuron marker OMP (red) in the mice OE at 5 dpi. NCAM, neural cell adhesion molecule. (C) Expression of IL-1β, IL-6, CXCL10, CCL5, TNF-α, IFN-α, IFN-β, and IFN-γ mRNA in homogenized nasal turbinate tissues was determined by qRT–PCR. Three mice per time point were analyzed. Data are normalized to GAPDH and presented as fold changes in expression relative to mock (0 dpi) and shown as the means ± SD. P values were determined by one-way ANOVA.
Fig 11
Fig 11. Differentially expressed genes screened in the OB of PHEV-infected mice.
The 3w BALB/c mice were inoculated intranasally with 103.96 TCID50 PHEV. (A) At 5 dpi, mice were euthanized and OB samples were collected for immunofluorescence staining with antibodies against OMP (green) and PHEV-N (red). PHEV-positive cells were widely distributed in the OB, especially in the MCL and GCL. GL, glomerular layer; EPL, external plexiform layer; MCL, mitral cell layer; IPL, internal plexiform layer; GCL, granular cell layer. (B-C) Differentially expressed genes in the OB of PHEV-infected mice at 5 dpi were analyzed by RNA-seq. Scatter plot of biological processes identified in the GO enrichment analysis. The vertical axis represents the functional annotation information, and the horizontal axis represents the Rich factor corresponding to the function. (Only the 30 most enriched KEGG and GO terms are plotted for the significantly differentially expressed gene set).

Similar articles

Cited by

References

    1. Zhou P, Yang XL, Wang XG, Hu B, Zhang L, Zhang W, et al.. A pneumonia outbreak associated with a new coronavirus of probable bat origin. Nature. 2020;579(7798):270–3. doi: 10.1038/s41586-020-2012-7 . - DOI - PMC - PubMed
    1. Coronaviridae Study Group of the International Committee on Taxonomy of V. The species Severe acute respiratory syndrome-related coronavirus: classifying 2019-nCoV and naming it SARS-CoV-2. Nature microbiology. 2020. doi: 10.1038/s41564-020-0695-z . - DOI - PMC - PubMed
    1. Butowt R, Bilinska K. SARS-CoV-2: Olfaction, Brain Infection, and the Urgent Need for Clinical Samples Allowing Earlier Virus Detection. ACS Chemical Neuroscience. 2020;11(9):1200–3. doi: 10.1021/acschemneuro.0c00172 - DOI - PubMed
    1. Spinato G, Fabbris C, Polesel J, Cazzador D, Borsetto D, Hopkins C, et al.. Alterations in Smell or Taste in Mildly Symptomatic Outpatients With SARS-CoV-2 Infection. JAMA. 2020;323(20):2089–90. Epub 2020/04/23. doi: 10.1001/jama.2020.6771 ; PubMed Central PMCID: PMC7177631. - DOI - PMC - PubMed
    1. Xydakis MS, Dehgani-Mobaraki P, Holbrook EH, Geisthoff UW, Bauer C, Hautefort C, et al.. Smell and taste dysfunction in patients with COVID-19. The Lancet Infectious Diseases. 2020;20(9):1015–6. doi: 10.1016/S1473-3099(20)30293-0 - DOI - PMC - PubMed