. 2022 Jul 12;119(28):e2123274119.
doi: 10.1073/pnas.2123274119. Epub 2022 Jun 27.

Long-distance facilitation of coastal ecosystem structure and resilience

Affiliations

Long-distance facilitation of coastal ecosystem structure and resilience

Bo Wang et al. Proc Natl Acad Sci U S A. .

Abstract

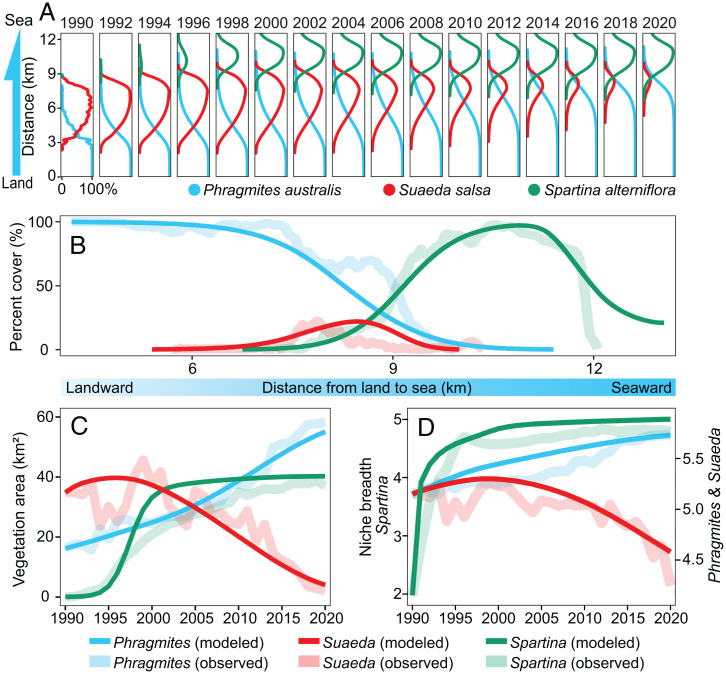
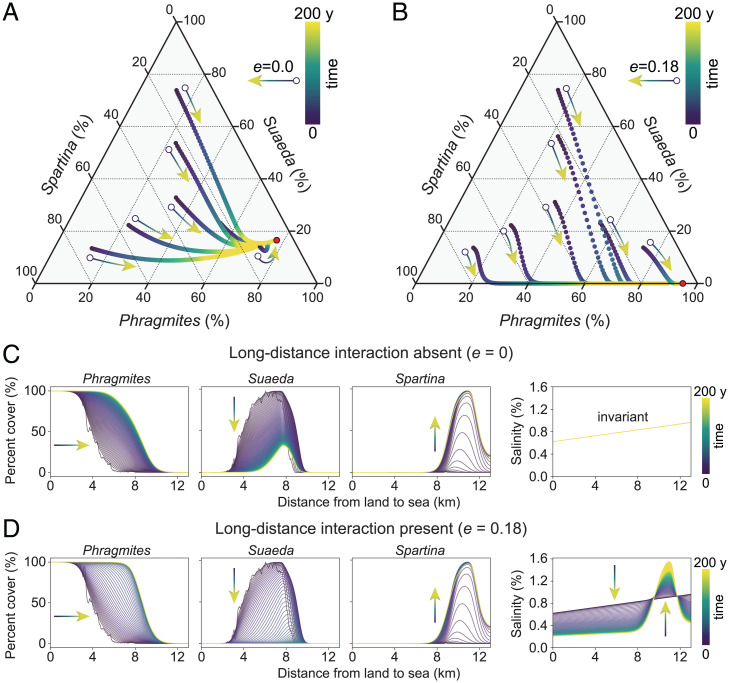
Biotic interactions that hierarchically organize ecosystems by driving ecological and evolutionary processes across spatial scales are ubiquitous in our biosphere. Biotic interactions have been extensively studied at local and global scales, but how long-distance, cross-ecosystem interactions at intermediate landscape scales influence the structure, function, and resilience of ecological systems remains poorly understood. We used remote sensing, modeling, and field data to test the hypothesis that the long-distance impact of an invasive species dramatically affects one of the largest tidal flat ecosystems in East Asia. We found that the invasion of exotic cordgrass Spartina alterniflora can produce long-distance effects on native species up to 10 km away, driving decadal coastal ecosystem transitions. The invasive cordgrass at low elevations facilitated the expansion of the native reed Phragmites australis at high elevations, leading to the massive loss and reduced resilience of the iconic Suaeda salsa "Red Beach" marshes at intermediate elevations, largely as a consequence of reduced soil salinity across the landscape. Our results illustrate the complex role that long-distance interactions can play in shaping landscape structure and ecosystem resilience and in bridging the gap between local and global biotic interactions.

Keywords: biological invasion; biotic interaction; coastal saltmarsh; long-distance interaction; resilience.


Conflict of interest statement

The authors declare no competing interest.

Figures

Fig. 1.
Fig. 1.
Remotely sensed landscape change in the studied coastal region during 1982 to 2020. (A) Location of the study area. (BD) Photos of vegetation dominated by P. australis, S. salsa, and S. alterniflora. (E) Maps of vegetation distribution in the study area. (F) Percent covers of the vegetation along the one-dimensional spatial gradient from land to sea. Note that the landscape changes are illustrated on a biannual basis here (E and F), whereas data analyses are performed on an annual basis (see SI Appendix, Fig. S2 for a complete illustration).
Fig. 2.
Fig. 2.
Schematic illustration of the long-distance interaction triggered by Spartina invasion. (A) Sedimentation-erosion equilibrium and salinity input from tidal water ensure the persistence of the extensive red Suaeda saltmarsh before the Spartina invasion. (B) The invasion of Spartina triggers a building process characterized by enhanced sedimentation and increased elevation at the local scale. At a larger scale across the landscape at higher elevations behind the Spartina zone, the elevated low tidal zone produces a blocking effect, resulting in reduced salinity input from tidal water and declined soil salinity due to shorter inundation, in turn facilitating the expansion of Phragmites. (C) This long-distance effect of Spartina eventually leads to the massive loss of Suaeda, as replaced by Phragmites.
Fig. 3.
Fig. 3.
The spatiotemporal patterns of elevation, soil and vegetation. (A) Time series of vegetation area show increasing trends of Phragmites (blue) and Spartina (green) but an abruptly declining trend of Suaeda (red). (B) Time series of the breadths of the “spatial niches” along the spatial gradient from land to sea show that the core distribution range of Spartina (green) increased abruptly before ∼1995, followed by a saturation trend afterward. The time series of Phragmites (blue) and Suaeda (red) show piecewise trends with a consistent turning point around 2005. (C) Elevation data show clear increases of elevation after the successful invasion of Spartina (2001 to 2010) in the Spartina zone but not in the Suaeda zone. The five inset panels show the vertical distribution of sediment composition in terms of fractions of sand, silt and clay (measured in 2007, locations labeled as I to V). The dashed lines indicate the turning points of the vertical distribution patterns of % silt (fine sediments), detected using a break point analysis. The elevation and sediment composition data were obtained from refs. and . (D) Soil salinity generally shows a humped pattern along the spatial gradient from land to sea, peaked in the cordgrass zone. Point color indicates the year when salinity was measured. (E) The studied landscape can be separated into three distinctive vegetation zones on the basis of vegetation distribution along the land–sea spatial gradient in 1995. The intersection points of the percent cover curves are used to identify the boundaries of the vegetation zones. (FH) The temporal trends of soil salinity in the above-mentioned vegetation zones separately show different patterns: a linear-like decreasing trend in the Phragmites zone (F), an abruptly decreasing trend after ∼2005 in the Suaeda zone (G), and a slightly increasing trend in the Spartina zone (H). Note that the y axis range in H is different from in F and G. The trends in A, B, D, and FH are fitted using generalized additive models with 95% CIs.
Fig. 4.
Fig. 4.
Comparison between the modeled and the remotely sensed vegetation dynamics. (A) Modeled percent covers of vegetation (see SI Appendix, Fig. S2 for a complete illustration). (B) Modeled and observed percent vegetation covers along the land–sea spatial gradient at the end of the study time period (year 2020). (C) Modeled and observed (see also Fig. 3A) spatial extent of the three vegetation types during 1990 to 2020. (D) Modeled and observed (see also Fig. 3B) spatial niche breadths along the land–sea gradient during 1990 to 2020. See SI Appendix, section S1 for the methodological details.
Fig. 5.
Fig. 5.
Model predicted effect of long-distance interaction on system behavior. System states in terms of percent covers of the three species are illustrated using triangle plots (A and B). (A) In the absence of long-distance interaction (e = 0), the system will converge to an equilibrium characterized by the three-species coexistence (red dot). (B) When sufficiently strong long-distance interaction is present (e = 0.18), the system will converge to a two-species coexistence equilibrium at which Suaeda cannot be maintained. The trajectories of system state over time are shown for six randomly selected initial conditions in each scenario (A and B). (C and D) Changes of spatial patterns of the three species for the absence (C) and presence (D) of the long-distance interaction. The arrows indicate the direction of the change over time (from purple to yellow). The spatial patterns are modeled and plotted annually for 200 y. The color gradient (for the curves and arrows) from dark blue to yellow indicating modeling time from 0 to 200 y. The initial condition (t = 0) of vegetation cover is taken from the remotely sensed data in 1990 (the ragged curves), and the initial condition of salinity is taken from a linear fit of the measured salinity (the straight lines). The yellow curves represent steady distributions over the one-dimensional space (from land to sea). When the long-distance interaction is present, Suaeda cover approaches zero as an equilibrium (D). The spatial patterns of the steady states with different long-distance interaction strength are shown in Movie S2.
Fig. 6.
Fig. 6.
Model-predicted effect of long-distance interaction on coastal resilience. (A) The model predicts increasing growths of Suaeda as well as declines of Phragmites with increasing speed of sea-level rise. The presence of the long-distance interaction (solid lines) can result in amplified growth rates of Suaeda and the reduced loss rate of Phragmites, as compared with the situation absent of the long-distance interaction (dashed lines). The model thus predicts higher resilience of the coastal ecosystems (in terms of persistence of the native Suaeda and Phragmites vegetation) facing sea-level rise. (B) In the presence of long-distance interaction, Suaeda is predicted to increase whereas Phragmites and Spartina are predicted to decline in the upcoming ∼40 y with accelerated sea-level rise (solid lines) at a speed of 5.0 mm per year (∼50% increase over the current speed). Note that in each panel the y axis at the right-hand side (with blue labels) indicates Phragmites.

References

    1. Hutchinson G. E., Homage to Santa Rosalia or why are there so many kinds of animals? Am. Nat. 93, 145–159 (1959).
    1. Andresen E., Arroyo-Rodríguez V., Escobar F., “Tropical biodiversity: The importance of biotic interactions for its origin, maintenance, function, and conservation” in Ecological Networks in the Tropics, Dáttilo W., Rico-Gray V., Eds. (Springer, 2018), pp. 1–13.
    1. Brown J. H., Two decades of homage to Santa Rosalia: Toward a general theory of diversity. Am. Zool. 21, 877–888 (1981).
    1. Vellend M., The Theory of Ecological Communities (MPB-57) (Princeton University Press, 2016).
    1. Olejarz J., Iwasa Y., Knoll A. H., Nowak M. A., The Great Oxygenation Event as a consequence of ecological dynamics modulated by planetary change. Nat. Commun. 12, 3985 (2021). - PMC - PubMed

Publication types