. 2022 Jul 5;119(27):e2123227119.
doi: 10.1073/pnas.2123227119. Epub 2022 Jun 27.

Activating STING1-dependent immune signaling in TP53 mutant and wild-type acute myeloid leukemia

Affiliations

Activating STING1-dependent immune signaling in TP53 mutant and wild-type acute myeloid leukemia

Aksinija A Kogan et al. Proc Natl Acad Sci U S A. .

Abstract

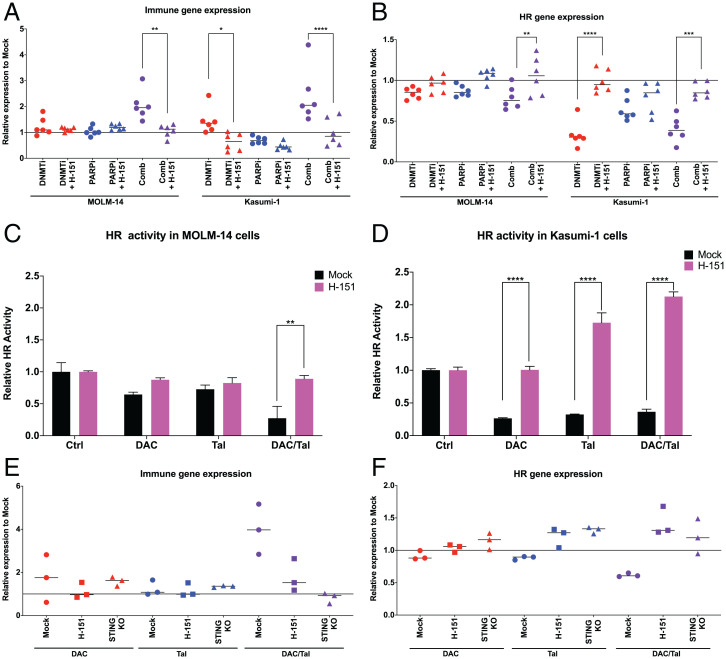
DNA methyltransferase inhibitors (DNMTis) reexpress hypermethylated genes in cancers and leukemias and also activate endogenous retroviruses (ERVs), leading to interferon (IFN) signaling, in a process known as viral mimicry. In the present study we show that in the subset of acute myeloid leukemias (AMLs) with mutations in TP53, associated with poor prognosis, DNMTis, important drugs for treatment of AML, enable expression of ERVs and IFN and inflammasome signaling in a STING-dependent manner. We previously reported that in solid tumors poly ADP ribose polymerase inhibitors (PARPis) combined with DNMTis to induce an IFN/inflammasome response that is dependent on STING1 and is mechanistically linked to generation of a homologous recombination defect (HRD). We now show that STING1 activity is actually increased in TP53 mutant compared with wild-type (WT) TP53 AML. Moreover, in TP53 mutant AML, STING1-dependent IFN/inflammatory signaling is increased by DNMTi treatment, whereas in AMLs with WT TP53, DNMTis alone have no effect. While combining DNMTis with PARPis increases IFN/inflammatory gene expression in WT TP53 AML cells, signaling induced in TP53 mutant AML is still several-fold higher. Notably, induction of HRD in both TP53 mutant and WT AMLs follows the pattern of STING1-dependent IFN and inflammatory signaling that we have observed with drug treatments. These findings increase our understanding of the mechanisms that underlie DNMTi + PARPi treatment, and also DNMTi combinations with immune therapies, suggesting a personalized approach that statifies by TP53 status, for use of such therapies, including potential immune activation of STING1 in AML and other cancers.

Keywords: AML; TP53; combination therapy; epigenetics; immune signaling.


Conflict of interest statement

The authors declare a competing interest. F.V.R. and S.B.B. share co-inventorship on US Provisional Patent Application No. 61/929,680 for the concept of the combinatorial therapy.

Figures

Fig. 1.
Fig. 1.
DNMTi treatment increases ERV gene expression in TP53 mutant AML. Relative RNA expression for a subset of ERV genes after mock or 10 nM DAC treatment in (A) TP53 WT (MOLM-14, OCI-AML2, and OCI-AML3) and TP53 mutant (Kasumi-1, KG-1a, and U937) cell lines (72 h, n = 3 biological replicates) and (B) TP53 WT (n = 6) and TP53 mutant (n = 6) primary AML PBMCs or bone marrow (BM) samples. (CF) Relative RNA expression for a subset of ERV genes after mock or 10 nM DAC treatment ± 50 μM pifithrin in MOLM-14 (C), Kasumi-1 (D), OCI/AML2 (E), and KG1a (F) cells (72 h, n = 3 biological replicates). All data are presented as mean ± SEM, with statistical significance derived from two-tailed unpaired Student’s t test (or ANOVA).
Fig. 2.
Fig. 2.
PARPi treatment increases cytosolic dsDNA in TP53 mutant AML in a dose-dependent manner. (A) Immunoblot for PARP1 in TP53 WT (MOLM-14, OCI/AML2, and OCI/AML3) and TP53 mutant (Kasumi-1, KG-1a, and U937) cell lines at baseline with β-actin used as a loading control (n = 3 biological replicates). (B) Violin plots for PARP1 mRNA expression in TCGA AML samples grouped by TP53 status. (C) Immunoblot for PARP1 after mock, or 5 nM, 10 nM, and 20 nM Tal treatment in MOLM-14, and Kasumi-1 cell lines with β-actin used as a loading control (72 h, n = 3 biological replicates). (D) Representative immunofluorescence images for dsDNA (left) and quantified (right) in MOLM-14 and Kasumi-1 cells after mock, or 5 nM, 10 nM, and 20 nM Tal treatment (72 h, n = 3 biological replicates). All data are presented as mean ± SEM, with statistical significance derived from two-tailed unpaired Student’s t test (or ANOVA), or Wilcoxon signed-rank test.
Fig. 3.
Fig. 3.
STING1 activity is increased in TP53 mutant AML. (A) Violin plots for STING1 mRNA expression in TCGA AML samples grouped by TP53 status. (B) Immunoblot for STING1 in TP53 WT (MOLM-14, OCI/AML2, and OCI/AML3) and TP53 mutant (Kasumi-1, KG-1a, and U937) cell lines at baseline with vinculin used as a loading control (n = 3 biological replicates). (C and D) Immunoblot for pSTING1 and STING1 in MOLM-14 (C) and Kasumi-1 (D) cells after mock, 10 nM DAC, 5 nM Tal, or DAC/Tal combination: 10 nM DAC + 5 nM Tal treatment with vinculin used as a loading control, quantified values below each respective protein (72 h, n = 3 biological replicates). (E) Quantification of proportion of pSTING1 in MOLM-14, OCI/AML2, OCI/AML3, Kasumi-1, U937, and KG1a cells after mock, 10 nM DAC, 5 nM Tal, or DAC/Tal combination: 10 nM DAC + 5 nM Tal treatment (72 h, n = 3 biological replicates). All data are presented as mean ± SEM, with statistical significance derived from two-tailed unpaired Student’s t test (or ANOVA), or Wilcoxon signed-rank test.
Fig. 4.
Fig. 4.
DNMTi treatment increases IFN signaling in TP53 mutant AML. (A) Unsupervised hierarchical clustering of MSigDB Hallmarks pathways normalized enrichment scores for MOLM-14 after 10 nM DAC, 5 nM Tal, or DAC/Tal combination: 10 nM DAC + 5 nM Tal treatment, cDNA microarray data. Blue: down-regulated Hallmark pathways, red: up-regulated Hallmark pathways, pathway ranking metric: Log2 fold change relative to mock (72 h). (B) Relative RNA expression for a subset of immune genes after mock, 10 nM DAC, 5 nM Tal, or DAC/Tal combination: 10 nM DAC + 5 nM Tal treatment in TP53 WT MOLM-14 and TP53 mutant Kasumi-1 AML cell lines (72 h, n = 3 biological replicates). (C and D) Relative RNA expression for a subset of immune genes after mock, 10 nM DAC, 5 nM Tal, or DAC/Tal combination: 10 nM DAC + 5 nM Tal treatment in TP53 WT (C) and mutant (D) AML primary samples (72 h, n = 3 biological replicates). All data are presented as mean ± SEM, with statistical significance derived from two-tailed unpaired Student’s t test (or ANOVA).
Fig. 5.
Fig. 5.
DNMTi treatment drives decreases in HR in TP53 mutant AML. (A) STRING protein–protein interaction map of homologous recombination and IFN genes of interest. See SI Appendix, Fig. S5A for an expanded version, overlayed ellipses annotate immune (blue), DNA repair (red) clusters, and TP53 (orange). (B) Relative HR activity analysis 24 h after 5 μM ruxolitinib, 100 ng/mL IFNβ, or 5 μM ruxolitinib + 100 ng/mL IFNβ treatment in MOLM-14 cells (n = 3 biological replicates). (C) Relative RNA expression for a subset of HR genes after mock, 10 nM DAC, 5 nM Tal, or DAC/Tal combination: 10 nM DAC + 5 nM Tal treatment in TP53 WT MOLM-14 and TP53 mutant Kasumi-1 cell lines (72 h, n = 3 biological replicates). (D) Relative HR activity analysis in MOLM-14 and Kasumi-1 cell lines after mock, 10 nM DAC, 5 nM Tal, or DAC/Tal combination: 10 nM DAC + 5 nM Tal treatment (72 h, n = 3 biological replicates). (E and F) Relative RNA expression for a subset of HR genes after mock, 10 nM DAC, 5 nM Tal, or DAC/Tal combination: 10 nM DAC + 5 nM Tal treatment in TP53 WT (E) and mutant (F) AML primary samples (72 h, n = 3 biological replicates). All data are presented as mean ± SEM, with statistical significance derived from two-tailed unpaired Student’s t test (or ANOVA).
Fig. 6.
Fig. 6.
STING1 inhibition abrogates IFN signaling and rescues HR activity in TP53 WT and TP53 mutant AML. (A) Relative RNA expression for a subset of immune genes after mock, 10 nM DAC, 5 nM Tal, or DAC/Tal combination: 10 nM DAC + 5 nM Tal treatment ± 500 nM STING1i (H-151) for all conditions in MOLM-14 and Kasumi-1 AML cell lines (72 h, n = 3 biological replicates). (B) Relative RNA expression for a subset of HR genes after mock, 10 nM DAC, 5 nM Tal, or DAC/Tal combination: 10 nM DAC + 5 nM Tal treatment ± 500 nM STING1i for all conditions in MOLM-14 and Kasumi-1 cell lines (72 h, n = 3 biological replicates). (C and D) Relative HR activity analysis of MOLM-14 (C) and Kasumi-1 (D) cells after 72-h treatment with mock, 10 nM DAC, 5 nM Tal, or DAC/Tal combination: 10 nM DAC + 5 nM Tal ± 500 nM STING1i for all conditions (n = 3 biological replicates). (E and F) Relative expression of immune (E) and HR (F) genes after CRISPR KO of STING1 or cotreatment with 500 nM STING1i in C1498 mouse AML cells treated with mock, 10 nM DAC, 5 nM Tal, or DAC/Tal combination: 10 nM DAC + 5 nM Tal ± 500 nM STING1i for all conditions (72 h, n = 3 biological replicates). All data are presented as mean ± SEM, with statistical significance derived from two-tailed unpaired Student’s t test (or ANOVA).
Fig. 7.
Fig. 7.
Induction of inflammasome related signaling by decitabine in TP53 mutant AML patients. (A and B) Gene set enrichment analysis (GSEA) of Hallmarks pathway for TP53 status (mutant ([MT] vs. WT) and treatment (Dac vs. screening) interaction analysis of GSE138696 dataset. Pathway dot plot, color indicates adjusted P value, and size indicates gene count (A). Normalized enrichment score plot for top five activated Hallmarks pathways (B). (C and D) GSEA of Hallmarks pathway for TP53 status (MT vs. WT) in screening samples of GSE138696 dataset. Pathway dot plot, color indicates adjusted P value, and size indicates gene count. (C) Normalized enrichment score plot for top five enriched Hallmarks pathways. (D) For each group biological replicate n values are as follows: Dac_WT n = 7, screening_WT n = 7, Dac_MT n = 6, screening MT n = 6, WT, wild-type TP53; MT, mutant TP53. (E) Heatmap of Hallmarks TNF_NFKB pathway from MSigDB. Unsupervised hierarchical clustering of Z score scaled average log2 intensity values by Ward’s method. Blue indicates positive Z score; yellow indicates negative Z score. Differentially expressed genes (DEG) tracks associated with heatmap are derived from differential expression analysis of screening samples for the following comparisons: MT vs. WT and TP53 Dac interaction. Genes are scored as yes or no for differential expression based on FDR adjusted P value <0.05. (F) Diagrammatic representation of therapeutic molecular model of DNMTi DAC and/or PARPi TAL treatment impacted by TP53 mutant status in AML. Left arrow or route depicts effects of DAC treatment, which significantly increases expression of ERV transcripts that lead to cytosolic dsRNA in TP53-mutated vs. WT cells. Right arrow or route depicts effects of PARPi treatment, which induces cytosolic dsDNA. The target of PARPi, PARP1 is actually increased in TP53 mutant cells. Therefore, at given concentrations of PARPi TAL, increased cytosolic dsDNA is seen in TP53-WT vs. TP53-mutated cells. Both Left and Right arrows or routes converge on STING1, the key mediator of interferon and inflammasome signaling. STING1 is activated by posttranslational phosphorylation, and at baseline phospho-STING1 is increased in TP53 mutant vs. WT cells, potentially through noncanonical STING1 signaling pathways. Treatment with DAC and/or TAL can further increase STING1 activity. In TP53-mutated cells, downstream interferon and inflammasome signaling is driven by DAC treatment and further increased by DAC/TAL combination treatment. In contrast, in TP53-WT cells increased by interferon and inflammasome signaling is seen only with the DAC/TAL combination treatment. Increased interferon and inflammasome signaling leads to HRD and antileukemia effects.

References

    1. Conway O’Brien E., Prideaux S., Chevassut T., The epigenetic landscape of acute myeloid leukemia. Adv. Hematol. 2014, 103175 (2014). - PMC - PubMed
    1. Kogan A. A., Lapidus R. G., Baer M. R., Rassool F. V., Exploiting epigenetically mediated changes: Acute myeloid leukemia, leukemia stem cells and the bone marrow microenvironment. Adv. Cancer Res. 141, 213–253 (2019). - PubMed
    1. Bullinger L., Döhner K., Döhner H., Genomics of acute myeloid leukemia diagnosis and pathways. J. Clin. Oncol. 35, 934–946 (2017). - PubMed
    1. Bowen D., et al. , TP53 gene mutation is frequent in patients with acute myeloid leukemia and complex karyotype, and is associated with very poor prognosis. Leukemia 23, 203–206 (2009). - PubMed
    1. Haferlach C., et al. , Mutations of the TP53 gene in acute myeloid leukemia are strongly associated with a complex aberrant karyotype. Leukemia 22, 1539–1541 (2008). - PubMed

Publication types

MeSH terms