. 2022 Sep 8;140(10):1119-1131.
doi: 10.1182/blood.2022015926.

Aberrant expansion of spontaneous splenic germinal centers induced by hallmark genetic lesions of aggressive lymphoma

Affiliations

Aberrant expansion of spontaneous splenic germinal centers induced by hallmark genetic lesions of aggressive lymphoma

Grace M Pindzola et al. Blood. .

Abstract

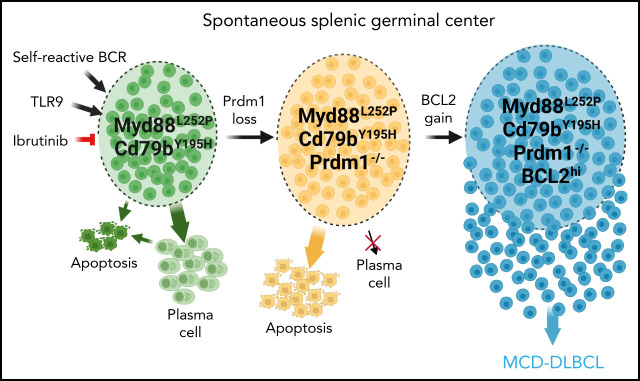
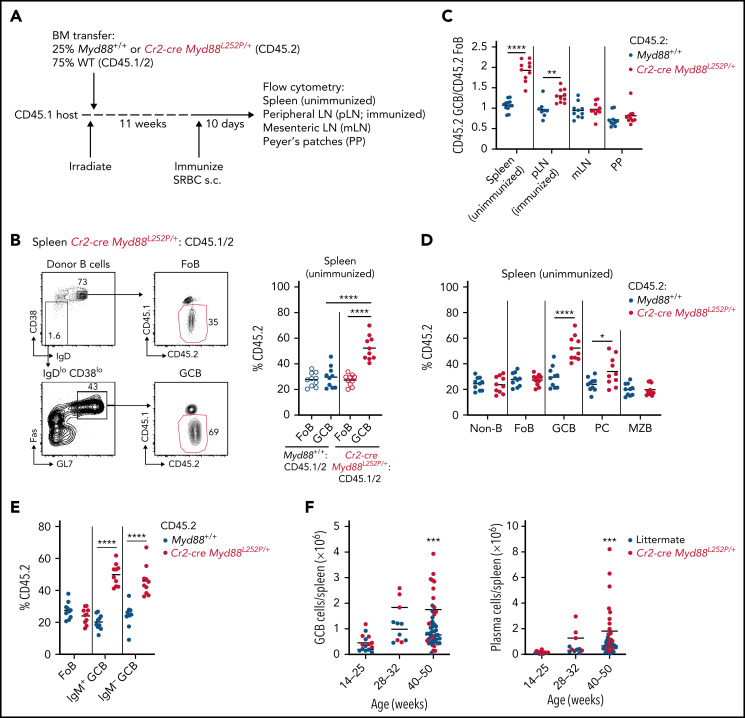
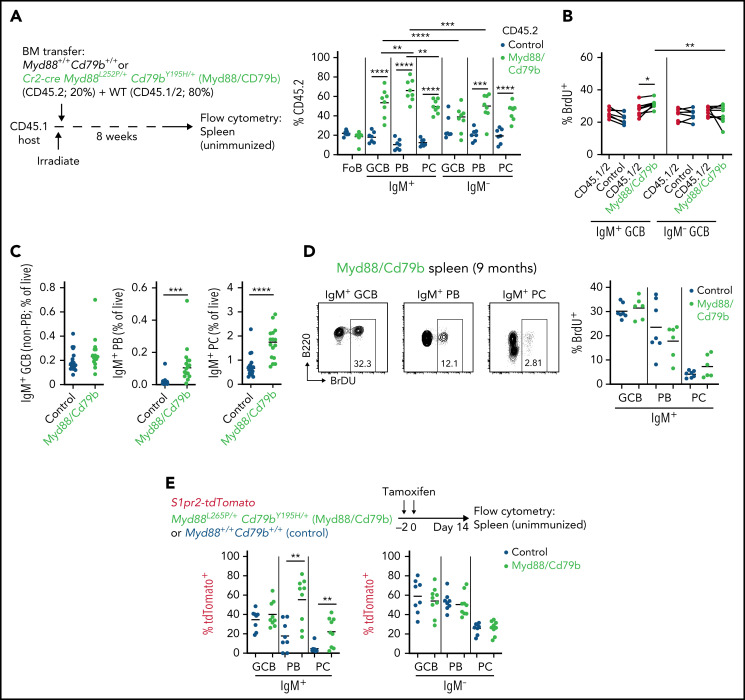
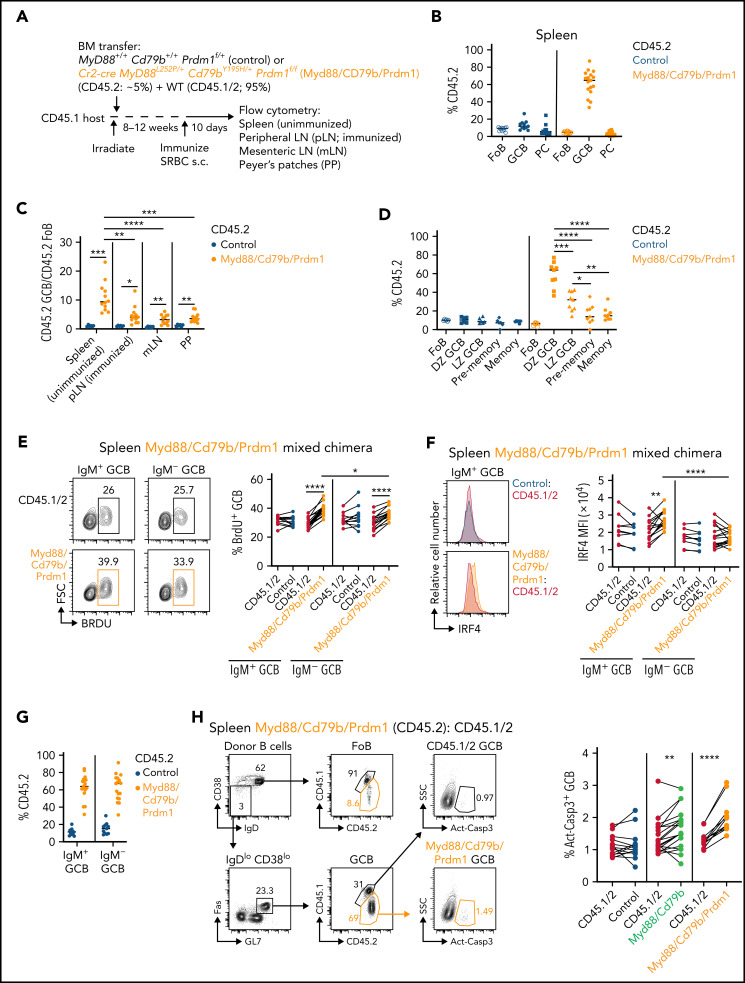
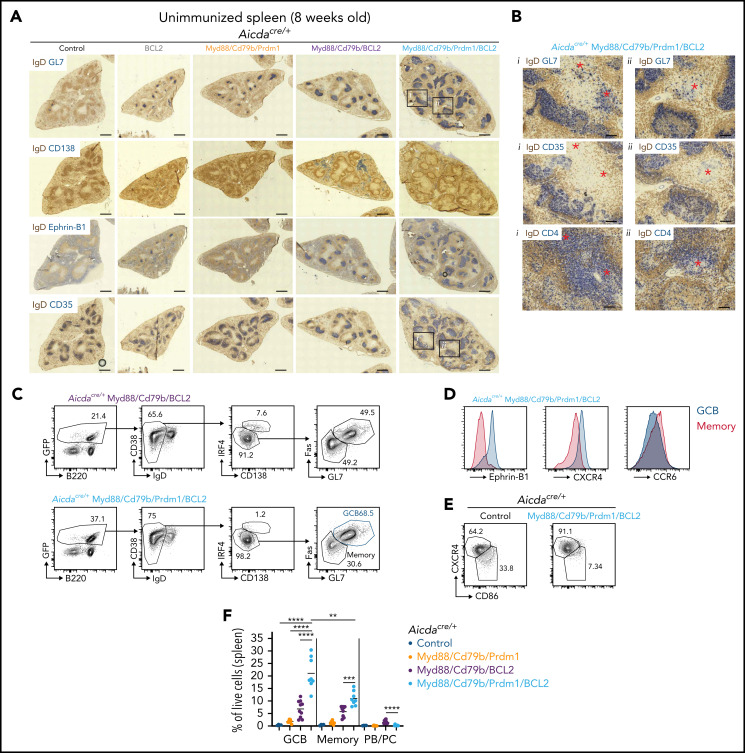
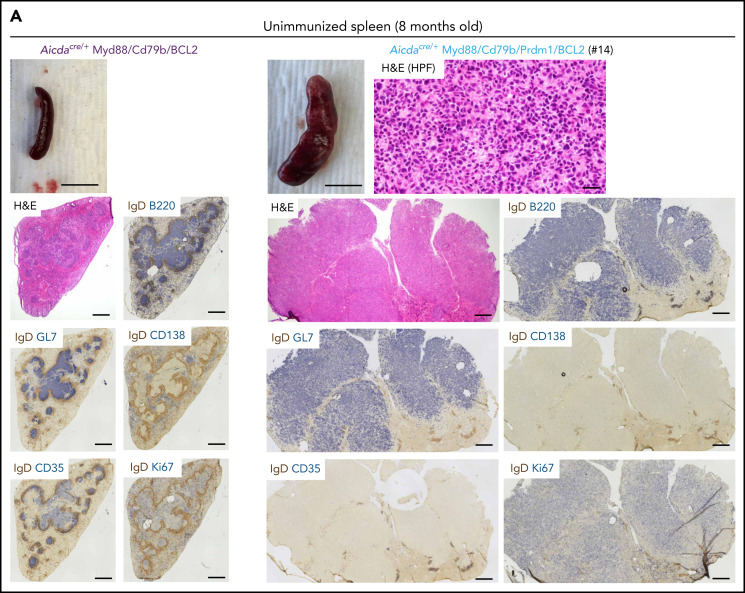
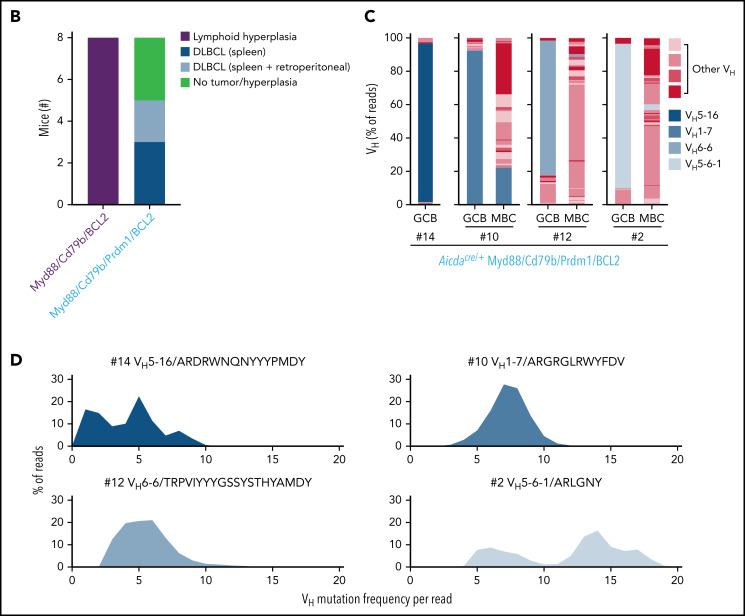
Unique molecular vulnerabilities have been identified in the aggressive MCD/C5 genetic subclass of diffuse large B-cell lymphoma (DLBCL). However, the premalignant cell-of-origin exhibiting MCD-like dependencies remains elusive. In this study, we examined animals carrying up to 4 hallmark genetic lesions found in MCD consisting of gain-of-function mutations in Myd88 and Cd79b, loss of Prdm1, and overexpression of BCL2. We discovered that expression of combinations of these alleles in vivo promoted a cell-intrinsic accumulation of B cells in spontaneous splenic germinal centers (GCs). As with MCD, these premalignant B cells were enriched for B-cell receptors (BCRs) with evidence of self-reactivity, displayed a de novo dependence on Tlr9, and were more sensitive to inhibition of Bruton's tyrosine kinase. Mutant spontaneous splenic GC B cells (GCB) showed increased proliferation and IRF4 expression. Mice carrying all 4 genetic lesions showed a >50-fold expansion of spontaneous splenic GCs exhibiting aberrant histologic features with a dark zone immunophenotype and went on to develop DLBCL in the spleen with age. Thus, by combining multiple hallmark genetic alterations associated with MCD, our study identifies aberrant spontaneous splenic GCBs as a likely cell-of-origin for this aggressive genetic subtype of lymphoma.


Figures

None
Graphical abstract
Figure 1.
Figure 1.
Myd88L252P promotes cell-intrinsic expansion of spontaneous splenic GCBs. (A) Experimental scheme for data in panels B to E. (B) Percentages of CD45.2 follicular B cells (FoB) and GCBs in unimmunized spleen of mixed BM chimeras generated as in panel A. Example gating strategy for FoB and GCBs is shown on left in panel B. (C) Ratio of frequency of CD45.2 GCBs to CD45.2 FoB in control or Cr2-cre Myd88L252P/+ mixed BM chimeras in unimmunized spleen, SRBC-immunized pLNs, mesenteric lymph nodes (mLNs), and PPs. (D) Percentages of CD45.2 non-B cells (non-B), FoBs, GCBs, PCs, and marginal zone B cells (MZB) from mixed chimeras generated as in panel A. (E) Percentages of CD45.2 FoBs and IgM+ or IgM GCBs in unimmunized spleen of mixed BM chimeras generated as in panel A. (F) GCBs or PCs per spleen of littermate or Cr2-cre Myd88L252P mice aged up to 1 year. Data in panels A to E are pooled from 2 independent experiments representative of 4 with 5 mice per group total. Data in panel F are from a total of 43 control and 28 Cr2-cre Myd88L252P animals. *P < .05, **P < .01, ***P < .001, **** P < .0001, unpaired two-tailed t test.
Figure 2.
Figure 2.
Myd88L252P induces MCD lymphoma-associated dependencies in spontaneous splenic GCBs. (A-B) Cas9-expressing TMD8 (MCD-DLBCL) cells were transduced with vectors expressing sgRNA directed against endogenous heavy chain and rescued with vectors expressing autologous or heterologous IgVH from BCRs from TMD8 itself or GCB-DLBCL cell lines (OCI-Ly-19 or BJAB) or spontaneous splenic or immunized GCBs from Cr2-cre Myd88L252P fused to the mouse IgM constant region; percent rescue relative to autologous heavy chain was assessed 6 days later. Data in panel B are pooled from 5 independent experiments; each bar represents a distinct heavy chain, 15 IgVH were cloned from unimmunized and 6 IgVH were cloned from SRBC-immunized Cr2-cre Myd88L252P/+ GCBs (see Methods). (C-D) Frequency of CD45.2+ cells among follicular B cells (FoB), IgM+, or IgM GCBs in Cr2-cre Myd88L252P/+ mixed BM chimeras were treated with ibrutinib for 3 days. Data in panel D are pooled from 2 independent experiments with a total of 10 mice per group. (E-F) Irradiated hosts were reconstituted with Rosa26Cas9 or Cr2-cre Myd88L252P/+Rosa26Cas9 BM that was transduced with vectors expressing control sgRNA or sgRNA targeting Tlr9 and the fluorescent reporter Ametrine. The ratio of sgRNA+ (Ametrine+) GCBs (GCB) relative to sgRNA+ (Ametrine+) FoB in unimmunized spleen was assessed 12 weeks later. Data in panel F are pooled from 2 independent experiments with a total of 10 mice per group. (G-H) Frequency of CD45.2+ cells among FoB, IgM GCBs, or IgM+ GCBs in Cr2-cre Myd88L252P/+ mixed BM chimeras were treated with antibiotics (ampicillin 1 g/L, vancomycin 0.5 g/L, neomycin 1 g/L, and metronidazole 1 g/L) in drinking water for 12 weeks. Data in panel H are from one experiment with 9 and 10 mice per group, respectively. *P < .05, **P < .01, ***P < .001, unpaired two-tailed t test.
Figure 3.
Figure 3.
Myd88L252P and Cd79bY195H cooperate to promote IgM+ PB and PC output from spontaneous splenic GCs. (A) Percentages of CD45.2 follicular B cells (FoB), IgM or IgM+ GCBs, PBs, or PCs in unimmunized spleens of mixed BM chimeras that were generated with a mixture of 20% Cr2-cre Myd88L252P/+Cd79bY195H/+ (Myd88/Cd79b) or control BM (CD45.2) and 80% WT CD45.1/2 eight weeks after irradiation. Example gating scheme is depicted in supplemental Figure 2A. (B) Intracellular fluorescence-activated cell sorting for 5-bromo-2′-deoxyuridine (BrdU) incorporation in IgM or IgM+ GCBs from spleens of control or Myd88/Cd79b mixed BM chimeras that were treated intraperitoneally with BrdU 30 minutes before euthanasia. Frequency of (C) or BrdU incorporation in (D) IgM+ GCBs, IgM+ PBs, or IgM+ PCs in spleens of unimmunized control or Myd88/Cd79b mice that were 6 to 9 months old. (E) Frequency of tdTomato+ cells among IgM+ or IgM GCs, PBs, PCs, or MBCs in S1pr2-creERT2 Rosa26LSLtdTomato/+ Myd88L252P/+ Cd79bY195H/+ or control mice 14 days after Cre induction by tamoxifen. Example gating for tdTomato is shown in supplemental Figure 2B. Data in panel A are from one experiment representative of three with 7 and 8 mice per group, respectively; data in panel B are from one experiment representative of two with 7 and 8 mice per group; data in panel C are pooled data from 8 independent experiments with 19 and 16 mice per group; data in panel D are pooled data from 4 independent experiments with 7 and 5 mice per group; data in panel E are pooled from 5 independent experiments with a total of 8 and 9 mice per group. *P < .05, **P < .01, ***P < .001, ****P < .0001, paired two-tailed t test for data in panel A comparing populations from the same mice and in panel B; and unpaired two-tailed t test for data in panel A comparing populations between mice and in panel E.
Figure 4.
Figure 4.
Loss of Prdm1 synergizes with Myd88L252P and Cd79bY195H to promote outgrowths in spontaneous splenic GCs. (A) Experimental scheme for data in panels B to H. Percentages of CD45.2 follicular B cells (FoB), GCBs, or PCs in unimmunized spleens (B) or ratios of frequency of CD45.2 GCB to CD45.2 follicular B cells (C) in unimmunized spleens, immunized pLNs, mesenteric lymph nodes (mLNs), or PPs of mixed BM chimeras that were generated with a mixture of ∼5% Cr2-cre Myd88L252P/+Cd79bY195H/+Prdm1f/f (Myd88/Cd79b/Prdm1) or control BM (CD45.2) and ∼95% WT CD45.1/2 eight weeks after irradiation. (D) Frequency of CD45.2 cells among FoB, DZ GCBs, LZ GCBs, pre-memory GCBs, or MBCs in Myd88/Cd79b/Prdm1 mixed chimeras. Example gating strategy is shown in supplemental Figure 3D. Intracellular fluorescence-activated cell sorting for 5-bromo-2′-deoxyuridine (BrdU) incorporation (E) or IRF4 expression (F) in IgM+ or IgM GCBs from spleens of control or Myd88/Cd79b/Prdm1 mixed BM chimeras that were treated intraperitoneally with BrdU 30 minutes before euthanasia. (G) Frequency of CD45.2 IgM+ or IgM GCBs in spleens of control or Myd88/Cd79b/Prdm1 mixed chimeras. (H) Percentage of active-Caspase-3+ GCBs in control, Myd88/Cd79b, or Myd88/Cd79b/Prdm1 mixed chimeras. Example gating strategy is shown on the left. Data in panels B, C, and E to H are pooled from 3 to 5 independent experiments with a total of at least 11 mice per group. Data in panel D are pooled from 2 experiments with 6 and 9 mice per group, respectively. *P < .05, **P < .01, ****P < .0001 paired two-tailed t test for data in panels E, F, and H. *P < .05, **P<.01, ***P < .001, ****P < .0001, unpaired two-tailed t test for all other data. MFI, mean fluorescence intensity.
Figure 5.
Figure 5.
Overexpression of BCL2 cooperates with Myd88/Cd79b/Prdm1 to induce massive expansion of aberrant spontaneous splenic GCBs. (A) Immunohistochemistry of unimmunized spleens from 8-week-old mice that were Aicdacre/+ and control, Rosa26LSLBCL2-IRES-GFP (BCL2), Myd88/Cd79b/Prdm1, Myd88/Cd79b/BCL2, or Myd88/Cd79b/Prm1/BCL2. Sections were stained for IgD and GL7, CD138, Ephrin-B1, or CD35. Scale bar = 500 μm. Additional examples of Aicdacre/+ Myd88/Cd79b/BCL2 or Aicdacre/+ Myd88/Cd79b/Prdm1/BCL2 mice are shown in supplemental Figure 3A. (B) High-power images of areas marked in panel A. Sections were stained for IgD and GL7, CD35, or CD4. Red asterisks mark areas of GL7+ cell infiltration into T-cell areas of spleens of Myd88/Cd79b/Prdm1/BCL2 animals. Scale bar = 100 μm. (C) Flow cytometry of splenocytes from Aicdacre/+ Myd88/Cd79b/BCL2 or Aicdacre/+ Myd88/Cd79b/Prdm1/BCL2 mice. (D) Expression of Ephrin-B1, CXCR4, or CCR6 on splenic GCs or MBCs from Aicdacre/+ Myd88/Cd79b/Prdm1/BCL2 mice. (E) Expression of LZ or DZ GC markers on splenic GCBs from Aicdacre/+ control or Myd88/Cd79b/Prdm1/BCL2 mice. (F) Frequency of splenic GCBs, MBCs, or PBs/PCs in 8- to 10-week-old Aicdacre/+ control, Myd88/Cd79b/Prdm1, Myd88/Cd79b/BCL2, or Myd88/Cd79b/Prdm1/BCL2. Data in panels A and B are representative of 2 to 5 mice per genotype; data in panels C to E are from one experiment representative of 4 independent experiments with 1 mouse per group; and data in panel F are pooled from 8 independent experiments with up to 1 mouse per group per experiment. **P < .01, ***P < .001, ****P < .0001, unpaired two-tailed t test.
Figure 6.
Figure 6.
MCD-associated genetic alterations promote DLBCL in vivo. (A) Spleen image and histologic analysis of 8-month-old Myd88/Cd79b/BCL2 or Myd88/Cd79b/Prdm1/BCL2 full BM chimeras. Sections were stained with hematoxylin and eosin (H&E) or for IgD and GL7, CD35, B220, CD138, or Ki-67. Scale bar is 1 cm in spleen images, 500 μM in low-power H&E and immunohistochemistry images, and 20 μm in high-power H&E (H&E [HPF]). Additional examples of Myd88/Cd79b/BCL2 or Myd88/Cd79b/Prdm1/BCL2 animals are shown in supplemental Figures 4 and 5, respectively. (B) Frequency of lymphoid hyperplasia or DLBCL in 6- to 8-month-old Myd88/Cd79b/BCL2 or Myd88/Cd79b/Prdm1/BCL2 full BM chimeras. (C) VH usage from repertoire sequencing of sorted GCBs or MBCs from tumor-bearing Myd88/Cd79b/Prdm1/BCL2 animals. (D) V-region mutation frequency per read of monoclonal outgrowths in GCBs of tumor-bearing Myd88/Cd79b/Prdm1/BCL2 animals. Dominant CDR3 peptide sequence of monoclonal outgrowth is indicated.
Figure 6.
Figure 6.
MCD-associated genetic alterations promote DLBCL in vivo. (A) Spleen image and histologic analysis of 8-month-old Myd88/Cd79b/BCL2 or Myd88/Cd79b/Prdm1/BCL2 full BM chimeras. Sections were stained with hematoxylin and eosin (H&E) or for IgD and GL7, CD35, B220, CD138, or Ki-67. Scale bar is 1 cm in spleen images, 500 μM in low-power H&E and immunohistochemistry images, and 20 μm in high-power H&E (H&E [HPF]). Additional examples of Myd88/Cd79b/BCL2 or Myd88/Cd79b/Prdm1/BCL2 animals are shown in supplemental Figures 4 and 5, respectively. (B) Frequency of lymphoid hyperplasia or DLBCL in 6- to 8-month-old Myd88/Cd79b/BCL2 or Myd88/Cd79b/Prdm1/BCL2 full BM chimeras. (C) VH usage from repertoire sequencing of sorted GCBs or MBCs from tumor-bearing Myd88/Cd79b/Prdm1/BCL2 animals. (D) V-region mutation frequency per read of monoclonal outgrowths in GCBs of tumor-bearing Myd88/Cd79b/Prdm1/BCL2 animals. Dominant CDR3 peptide sequence of monoclonal outgrowth is indicated.

Comment in

References

    1. Alizadeh AA, Eisen MB, Davis RE, et al. . Distinct types of diffuse large B-cell lymphoma identified by gene expression profiling. Nature. 2000;403(6769):503-511. - PubMed
    1. Chapuy B, Stewart C, Dunford AJ, et al. . Molecular subtypes of diffuse large B cell lymphoma are associated with distinct pathogenic mechanisms and outcomes [published corrections appears in Nat Med. 2018;24(8):1290–1291 and Nat Med. 2018;24(8):1292]. Nat Med. 2018;24(5):679-690. - PMC - PubMed
    1. Schmitz R, Wright GW, Huang DW, et al. . Genetics and pathogenesis of diffuse large B-cell lymphoma. N Engl J Med. 2018;378(15):1396-1407. - PMC - PubMed
    1. Wright GW, Huang DW, Phelan JD, et al. . A probabilistic classification tool for genetic subtypes of diffuse large B cell lymphoma with therapeutic implications. Cancer Cell. 2020;37(4):551-568.e14. - PMC - PubMed
    1. Phelan JD, Young RM, Webster DE, et al. . A multiprotein supercomplex controlling oncogenic signalling in lymphoma. Nature. 2018;560(7718):387-391. - PMC - PubMed