. 2022 Aug;175(8):1057-1064.
doi: 10.7326/M21-3956. Epub 2022 Jun 28.

Life Expectancy for White, Black, and Hispanic Race/Ethnicity in U.S. States: Trends and Disparities, 1990 to 2019

Affiliations

Life Expectancy for White, Black, and Hispanic Race/Ethnicity in U.S. States: Trends and Disparities, 1990 to 2019

Catherine O Johnson et al. Ann Intern Med. 2022 Aug.

Abstract

Background: Life expectancy (LE) differences within and between states by race/ethnicity have not been examined.

Objective: To estimate LE for selected race/ethnicity groups in states from 1990 to 2019.

Design: Cross-sectional time-series analysis.

Setting: United States.

Participants: Deidentified death records and Census data were used to construct regression models with smoothed time series of mortality from 1990 to 2019.

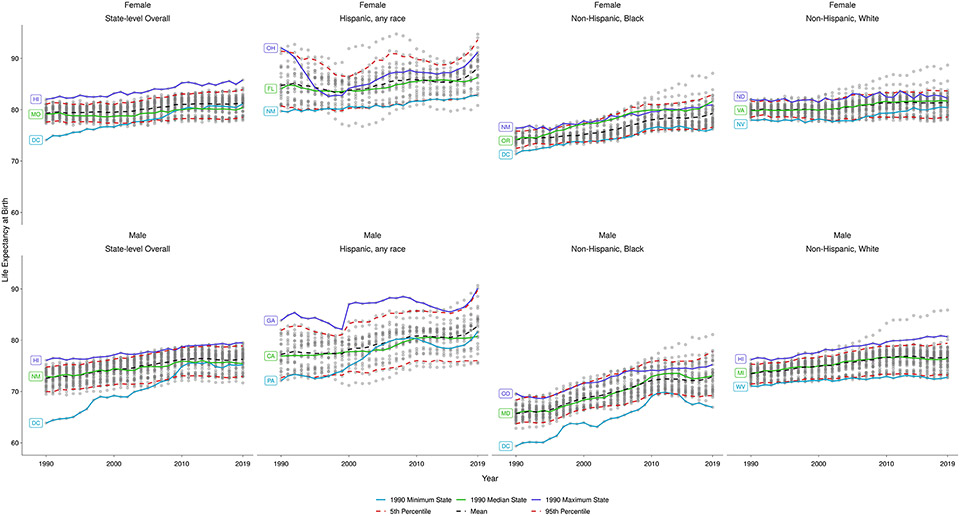
Measurements: LE at birth, by sex and year, for subgroups of people reporting Hispanic, non-Hispanic Black, or non-Hispanic White race/ethnicity.

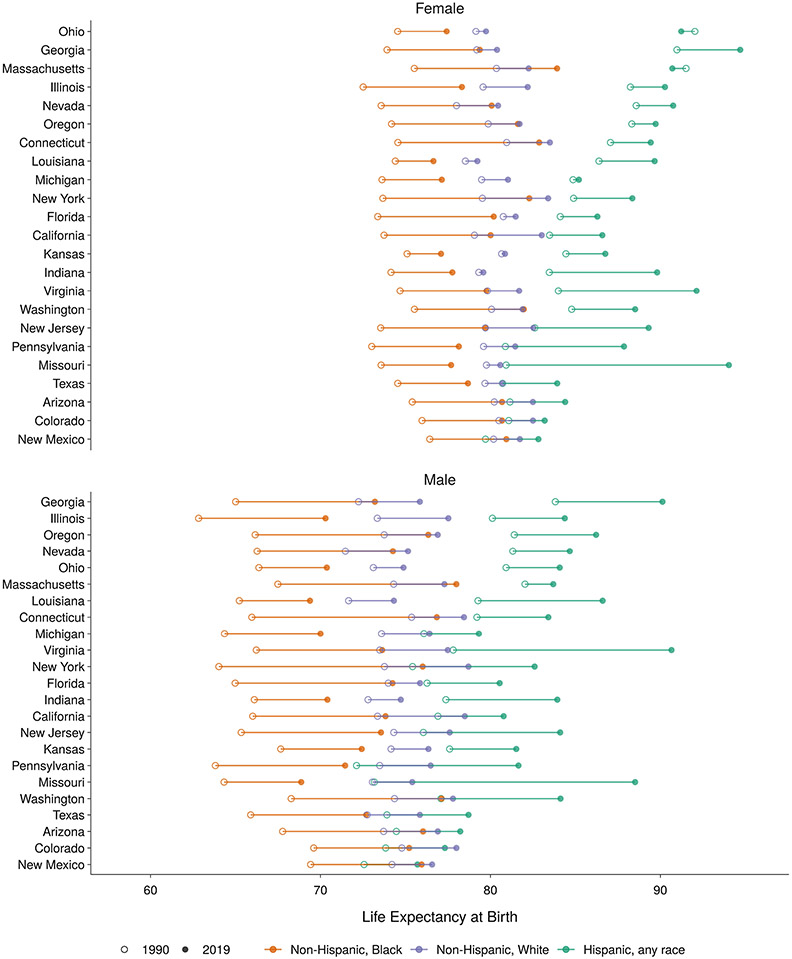
Results: Disparities in LE across states were 8.0 years for females and 12.2 years for males in 1990 and 7.9 years for females and 7.8 years for males in 2019. When race/ethnicity groups were accounted for, disparities across states were 20.7 years for females and 24.5 years for males in 1990, decreasing to 18.5 years for females and 23.7 years for males in 2019. Disparities across states increased within each race/ethnicity group between 1990 and 2019, with the largest increase for non-Hispanic White males and the smallest for Hispanic females. The disparity between race/ethnicity groups within states decreased for most of the 23 states with estimates for all 3 groups but increased for females in 7 states and males in 5 states.

Limitation: Because of small sample size, LE was not estimated for 37 of 153 state-race/ethnicity groups.

Conclusion: Disparity in LE across states was greater when race/ethnicity groups were considered. Disparities across all state-race/ethnicity groups in general have decreased over the past 3 decades. Within each race/ethnicity group, disparities across states have increased. Although racial/ethnic disparities decreased in most of the 23 states for which LE was estimated for all 3 groups, they increased for females in 7 states and males in 5 states.

Primary funding source: National Heart, Lung, and Blood Institute.


Figures

Figure 1:
Figure 1:. State-level estimates of life expectancy at birth between 1990 and 2019, total population and Hispanic, Black, and White race/ethnicity groups.
Figure shows LE at the state-level and for each race/ethnicity group for each year from 1990 to 2019 for women and men. Each dot represents a location or race/ethnicity group within that location. The state with minimum, median and maximum LE in 1990 is tracked through all years with a colored line as described in the legend. The LE mean, 5th, and 95th percentile of the distribution for each year is also shown plotted as dashed lines as described in the legend. The location with the minimum LE in 1990 was the District of Columbia (DC) at the overall state-level for women, New Mexico (NM) for Hispanic women of any race, the District of Columbia (DC) for non-Hispanic Black women, Nevada (NV) for non-Hispanic White women, the District of Columbia (DC) at the overall state-level for men, Pennsylvania (PA) for Hispanic men, the District of Columbia (DC) for non-Hispanic Black men, and West Virginia (WV) for non-Hispanic White men. In 1990, the state with the median LE value, or the lower of the two states with LE values closest to the median if there was an even number of states reported, was Missouri (MO) at the overall state-level for women, Florida (FL) for Hispanic women, Oregon (OR) for non-Hispanic Black women, Virginia (VA) for non-Hispanic White women, New Mexico (NM) at the overall state-level for men, California (CA) for Hispanic men, Maryland (MD) for non-Hispanic Black men, and Michigan (MI) for non-Hispanic White men. The state with the maximum LE in 1990 was Hawaii (HI) at the overall state-level for women, Ohio (OH) for Hispanic women, New Mexico (NM) for non-Hispanic Black women, North Dakota (ND) for non-Hispanic White women, Hawaii (HI) at the overall state-level for men, Georgia (GA) for Hispanic men, Colorado (CO) for non-Hispanic Black men, and Hawaii (HI) for non-Hispanic White men. CA = California, CO = Colorado, DC = District of Columbia, FL = Florida, GA = Georgia, HI = Hawaii, MD = Maryland, MI = Michigan, MO = Missouri, ND = North Dakota, NM = New Mexico, NV = Nevada, OH = Ohio, OR = Oregon, PA = Pennsylvania, VA = Virginia, WV = West Virginia.
Figure 2:
Figure 2:. Life expectancy gaps in states with estimates for all 3 race/ethnicity groups in 1990 and 2019
Figure shows locations where all three largest race/ethnicity groups were large enough to be estimated in both 1990 and 2019. Locations are ordered from greatest to smallest gap between the lowest and highest race/ethnicity group for LE in 1990. LE values for each race/ethnicity group in 1990 and 2019 are connected by lines as described in the legend, showing where these ranges overlap between groups and across states.

Comment in

References

    1. Woolf SH, Schoomaker H. Life Expectancy and Mortality Rates in the United States, 1959-2017. JAMA. 2019. Nov 26;322(20):1996. - PMC - PubMed
    1. Murphy SL, Xu J, Kochanek KD, Arias E. Mortality in the United States, 2017. NCHS Data Brief. 2018. Nov;(328):1–8. - PubMed
    1. Bailey ZD, Feldman JM, Bassett MT. How Structural Racism Works — Racist Policies as a Root Cause of U.S. Racial Health Inequities. New England Journal of Medicine. 2020. Dec 16;0(0):null. - PMC - PubMed
    1. Adler NE, Glymour MM, Fielding J. Addressing Social Determinants of Health and Health Inequalities. JAMA. 2016. Oct 25;316(16):1641–2. - PubMed
    1. Braveman PA, Cubbin C, Egerter S, Williams DR, Pamuk E. Socioeconomic Disparities in Health in the United States: What the Patterns Tell Us. Am J Public Health. 2010. Apr 1;100(S1):S186–96. - PMC - PubMed

Publication types