

Expression of active B-Raf proto-oncogene in kidney collecting ducts induces cyst formation in normal mice and accelerates cyst growth in mice with polycystic kidney disease
- PMID: 35760151
- PMCID: PMC9588601
- DOI: 10.1016/j.kint.2022.05.028
Expression of active B-Raf proto-oncogene in kidney collecting ducts induces cyst formation in normal mice and accelerates cyst growth in mice with polycystic kidney disease
Abstract
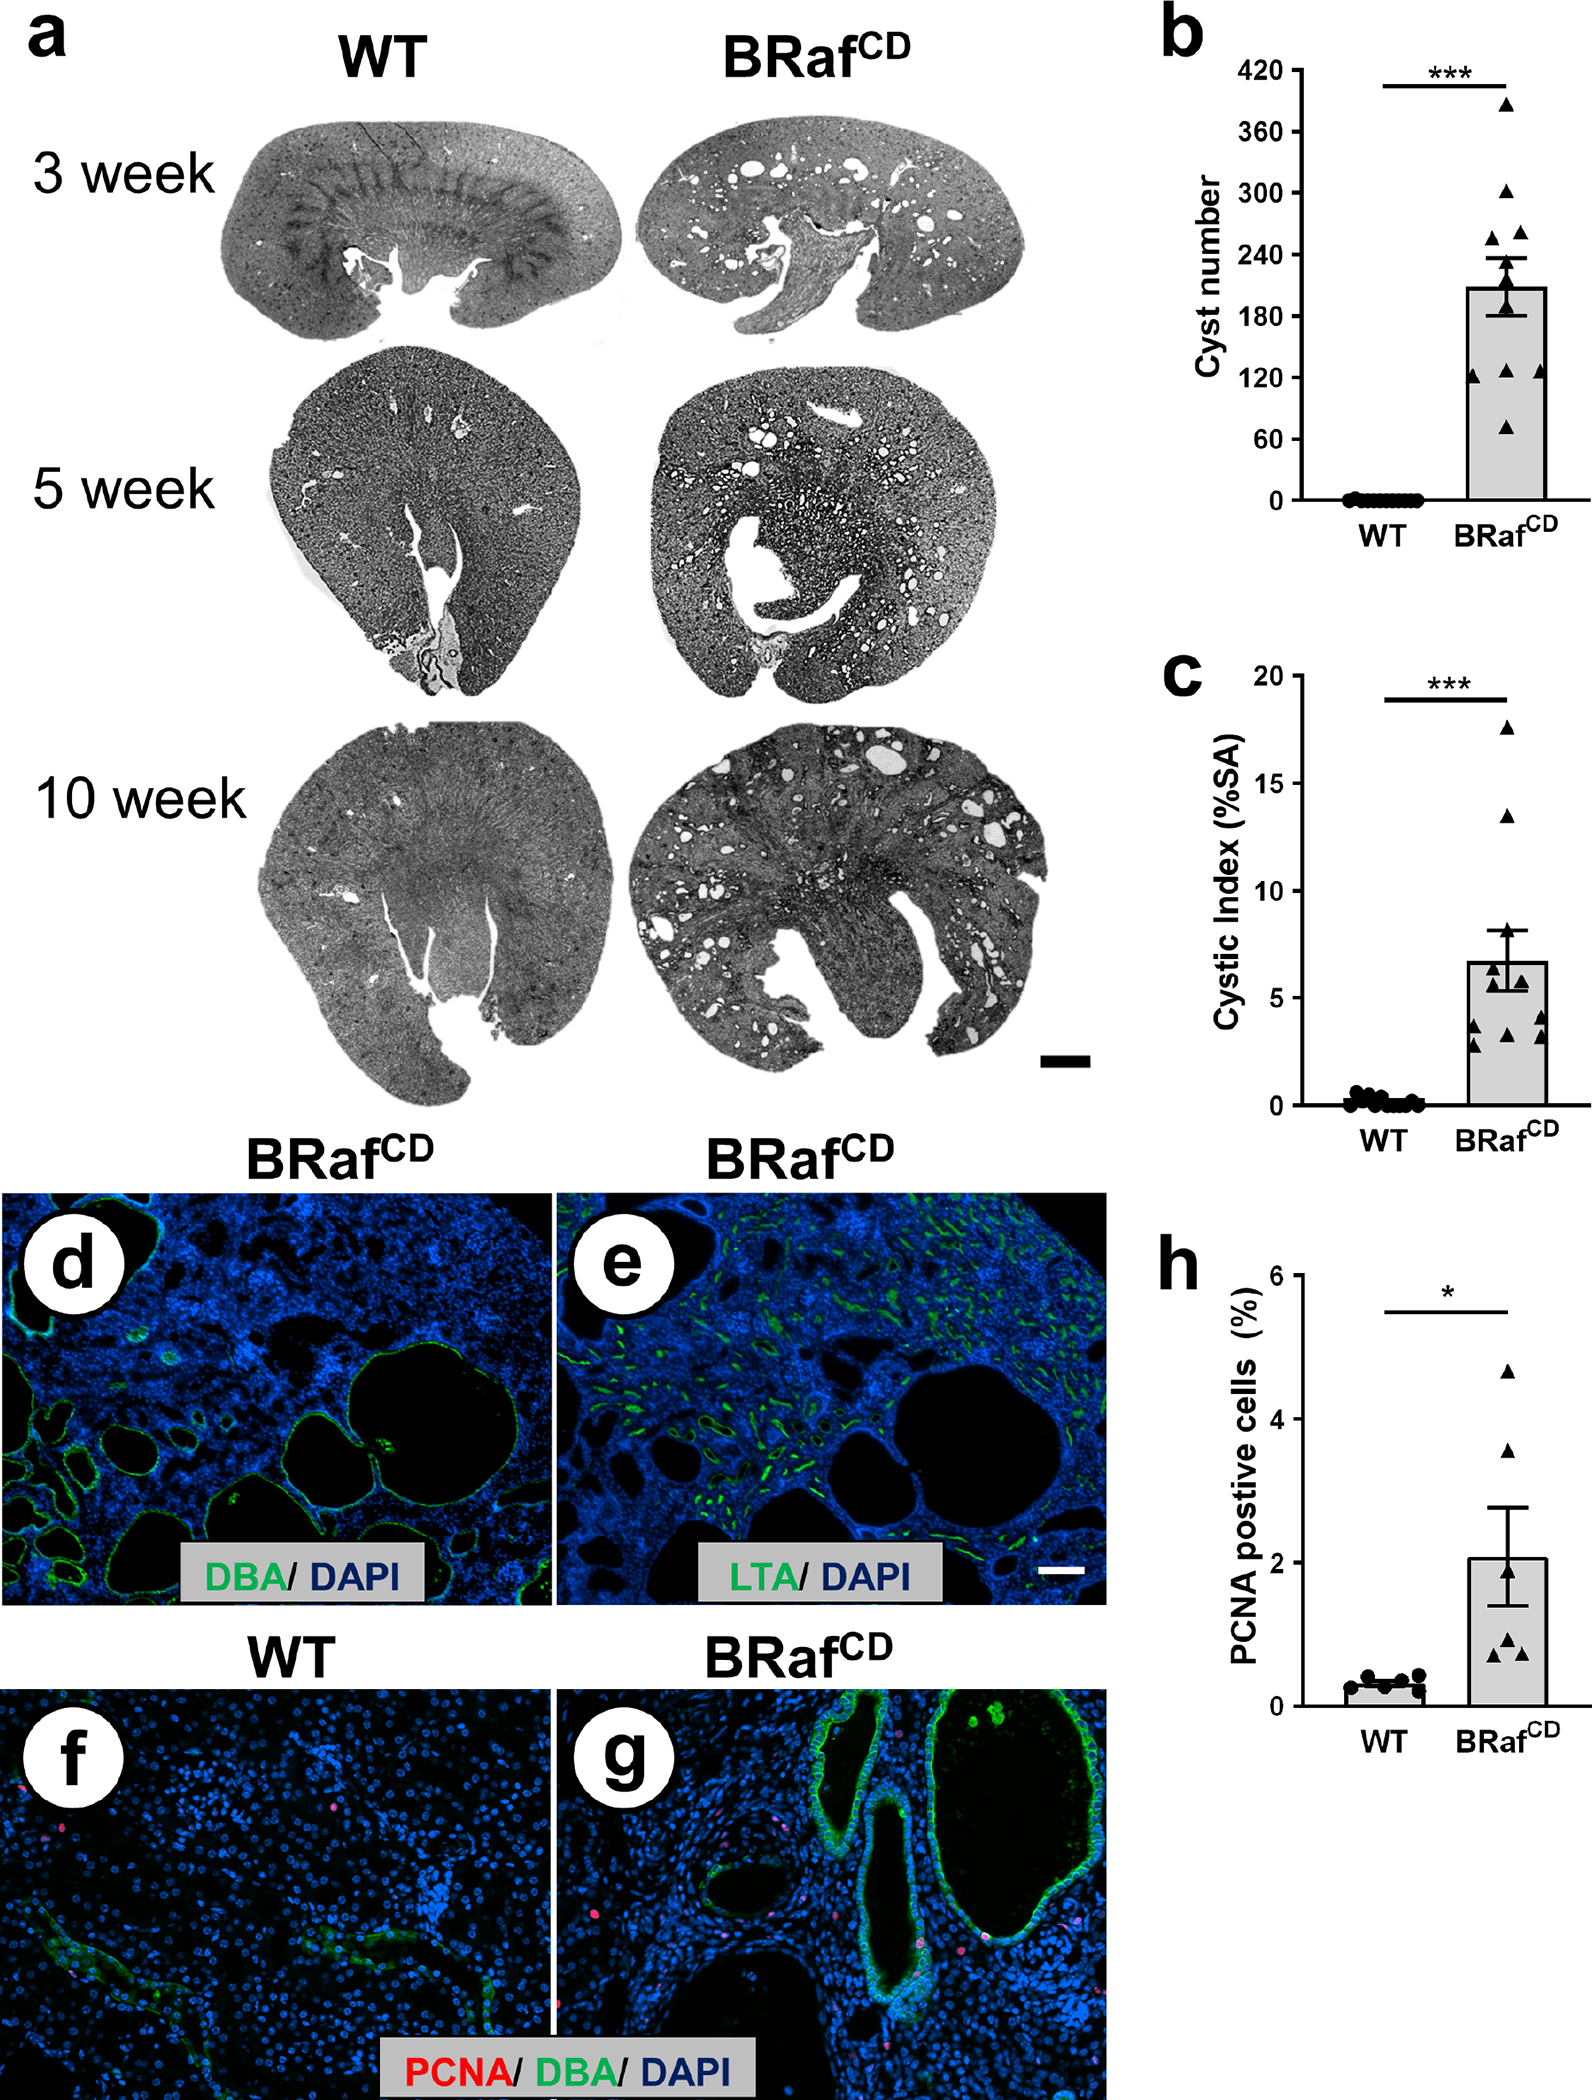
Polycystic kidney disease (PKD) is characterized by the formation and progressive enlargement of fluid-filled cysts due to abnormal cell proliferation. Cyclic AMP agonists, including arginine vasopressin, stimulate ERK-dependent proliferation of cystic cells, but not normal kidney cells. Previously, B-Raf proto-oncogene (BRAF), a MAPK kinase kinase that activates MEK-ERK signaling, was shown to be a central intermediate in the cAMP mitogenic response. However, the role of BRAF on cyst formation and enlargement in vivo had not been demonstrated. To determine if active BRAF induces kidney cyst formation, we generated transgenic mice that conditionally express BRAFV600E, a common activating mutation, and bred them with Pkhd1-Cre mice to express active BRAF in the collecting ducts, a predominant site for cyst formation. Collecting duct expression of BRAFV600E (BRafCD) caused kidney cyst formation as early as three weeks of age. There were increased levels of phosphorylated ERK (p-ERK) and proliferating cell nuclear antigen, a marker for cell proliferation. BRafCD mice developed extensive kidney fibrosis and elevated blood urea nitrogen, indicating a decline in kidney function, by ten weeks of age. BRAFV600E transgenic mice were also bred to Pkd1RC/RC and pcy/pcy mice, well-characterized slowly progressive PKD models. Collecting duct expression of active BRAF markedly increased kidney weight/body weight, cyst number and size, and total cystic area. There were increased p-ERK levels and proliferating cells, immune cell infiltration, interstitial fibrosis, and a decline in kidney function in both these models. Thus, our findings demonstrate that active BRAF is sufficient to induce kidney cyst formation in normal mice and accelerate cystic disease in PKD mice.
Keywords: ADPKD; ERK; MAPK; cell proliferation; mitogen-activated protein kinase; polycystic kidney disease.
Copyright © 2022 International Society of Nephrology. Published by Elsevier Inc. All rights reserved.
Conflict of interest statement
DISCLOSURE STATEMENT
The authors declare no competing interests.
Figures


Similar articles
-
Periostin overexpression in collecting ducts accelerates renal cyst growth and fibrosis in polycystic kidney disease.Am J Physiol Renal Physiol. 2018 Dec 1;315(6):F1695-F1707. doi: 10.1152/ajprenal.00246.2018. Epub 2018 Oct 17. Am J Physiol Renal Physiol. 2018. PMID: 30332313 Free PMC article.
-
Integrin-Linked Kinase Signaling Promotes Cyst Growth and Fibrosis in Polycystic Kidney Disease.J Am Soc Nephrol. 2017 Sep;28(9):2708-2719. doi: 10.1681/ASN.2016111235. Epub 2017 May 18. J Am Soc Nephrol. 2017. PMID: 28522687 Free PMC article.
-
Cyclic AMP activates B-Raf and ERK in cyst epithelial cells from autosomal-dominant polycystic kidneys.Kidney Int. 2003 Jun;63(6):1983-94. doi: 10.1046/j.1523-1755.2003.00023.x. Kidney Int. 2003. PMID: 12753285
-
Proliferative signaling by ERBB proteins and RAF/MEK/ERK effectors in polycystic kidney disease.Cell Signal. 2020 Mar;67:109497. doi: 10.1016/j.cellsig.2019.109497. Epub 2019 Dec 9. Cell Signal. 2020. PMID: 31830556 Free PMC article. Review.
-
The genetics and physiology of polycystic kidney disease.Semin Nephrol. 2001 Mar;21(2):107-23. doi: 10.1053/snep.2001.20929. Semin Nephrol. 2001. PMID: 11245774 Review.
Cited by
-
Transforming advancing autosomal dominant polycystic kidney disease care: investigating new horizons in treatment and research.Inflammopharmacology. 2025 Aug 14. doi: 10.1007/s10787-025-01894-9. Online ahead of print. Inflammopharmacology. 2025. PMID: 40813527 Review.
-
Mechanistic Insights into the Pathogenesis of Polycystic Kidney Disease.Cells. 2025 Aug 5;14(15):1203. doi: 10.3390/cells14151203. Cells. 2025. PMID: 40801635 Free PMC article. Review.
-
Polycystin-2-dependent transcriptome reveals early response of autosomal dominant polycystic kidney disease.Physiol Genomics. 2023 Nov 1;55(11):565-577. doi: 10.1152/physiolgenomics.00040.2023. Epub 2023 Sep 18. Physiol Genomics. 2023. PMID: 37720991 Free PMC article.
-
Physiologic mechanisms underlying polycystic kidney disease.Physiol Rev. 2025 Jul 1;105(3):1553-1607. doi: 10.1152/physrev.00018.2024. Epub 2025 Feb 12. Physiol Rev. 2025. PMID: 39938884 Free PMC article. Review.
-
Emerging therapies for autosomal dominant polycystic kidney disease with a focus on cAMP signaling.Front Mol Biosci. 2022 Sep 2;9:981963. doi: 10.3389/fmolb.2022.981963. eCollection 2022. Front Mol Biosci. 2022. PMID: 36120538 Free PMC article. Review.
References
-
- Torres VE, Harris PC. Polycystic kidney disease: genes, proteins, animal models, disease mechanisms and therapeutic opportunities. Journal of internal medicine 2007; 261: 17–31. - PubMed
-
- Hanaoka K, Qian F, Boletta A, et al. Co-assembly of polycystin-1 and −2 produces unique cation-permeable currents. Nature 2000; 408: 990–994. - PubMed
-
- Pearson G, Robinson F, Beers Gibson T, et al. Mitogen-activated protein (MAP) kinase pathways: regulation and physiological functions. Endocr Rev 2001; 22: 153–183. - PubMed
-
- Lewis TS, Shapiro PS, Ahn NG. Signal transduction through MAP kinase cascades. Adv Cancer Res 1998; 74: 49–139. - PubMed
Publication types
MeSH terms
Substances
Grants and funding
LinkOut - more resources
Full Text Sources
Research Materials
Miscellaneous
