. 2022 Aug 3;42(31):5992-6006.
doi: 10.1523/JNEUROSCI.2543-21.2022. Epub 2022 Jun 27.

Selective Ablation of Sod2 in Astrocytes Induces Sex-Specific Effects on Cognitive Function, d-Serine Availability, and Astrogliosis

Affiliations

Selective Ablation of Sod2 in Astrocytes Induces Sex-Specific Effects on Cognitive Function, d-Serine Availability, and Astrogliosis

Matthew P Baier et al. J Neurosci. .

Abstract

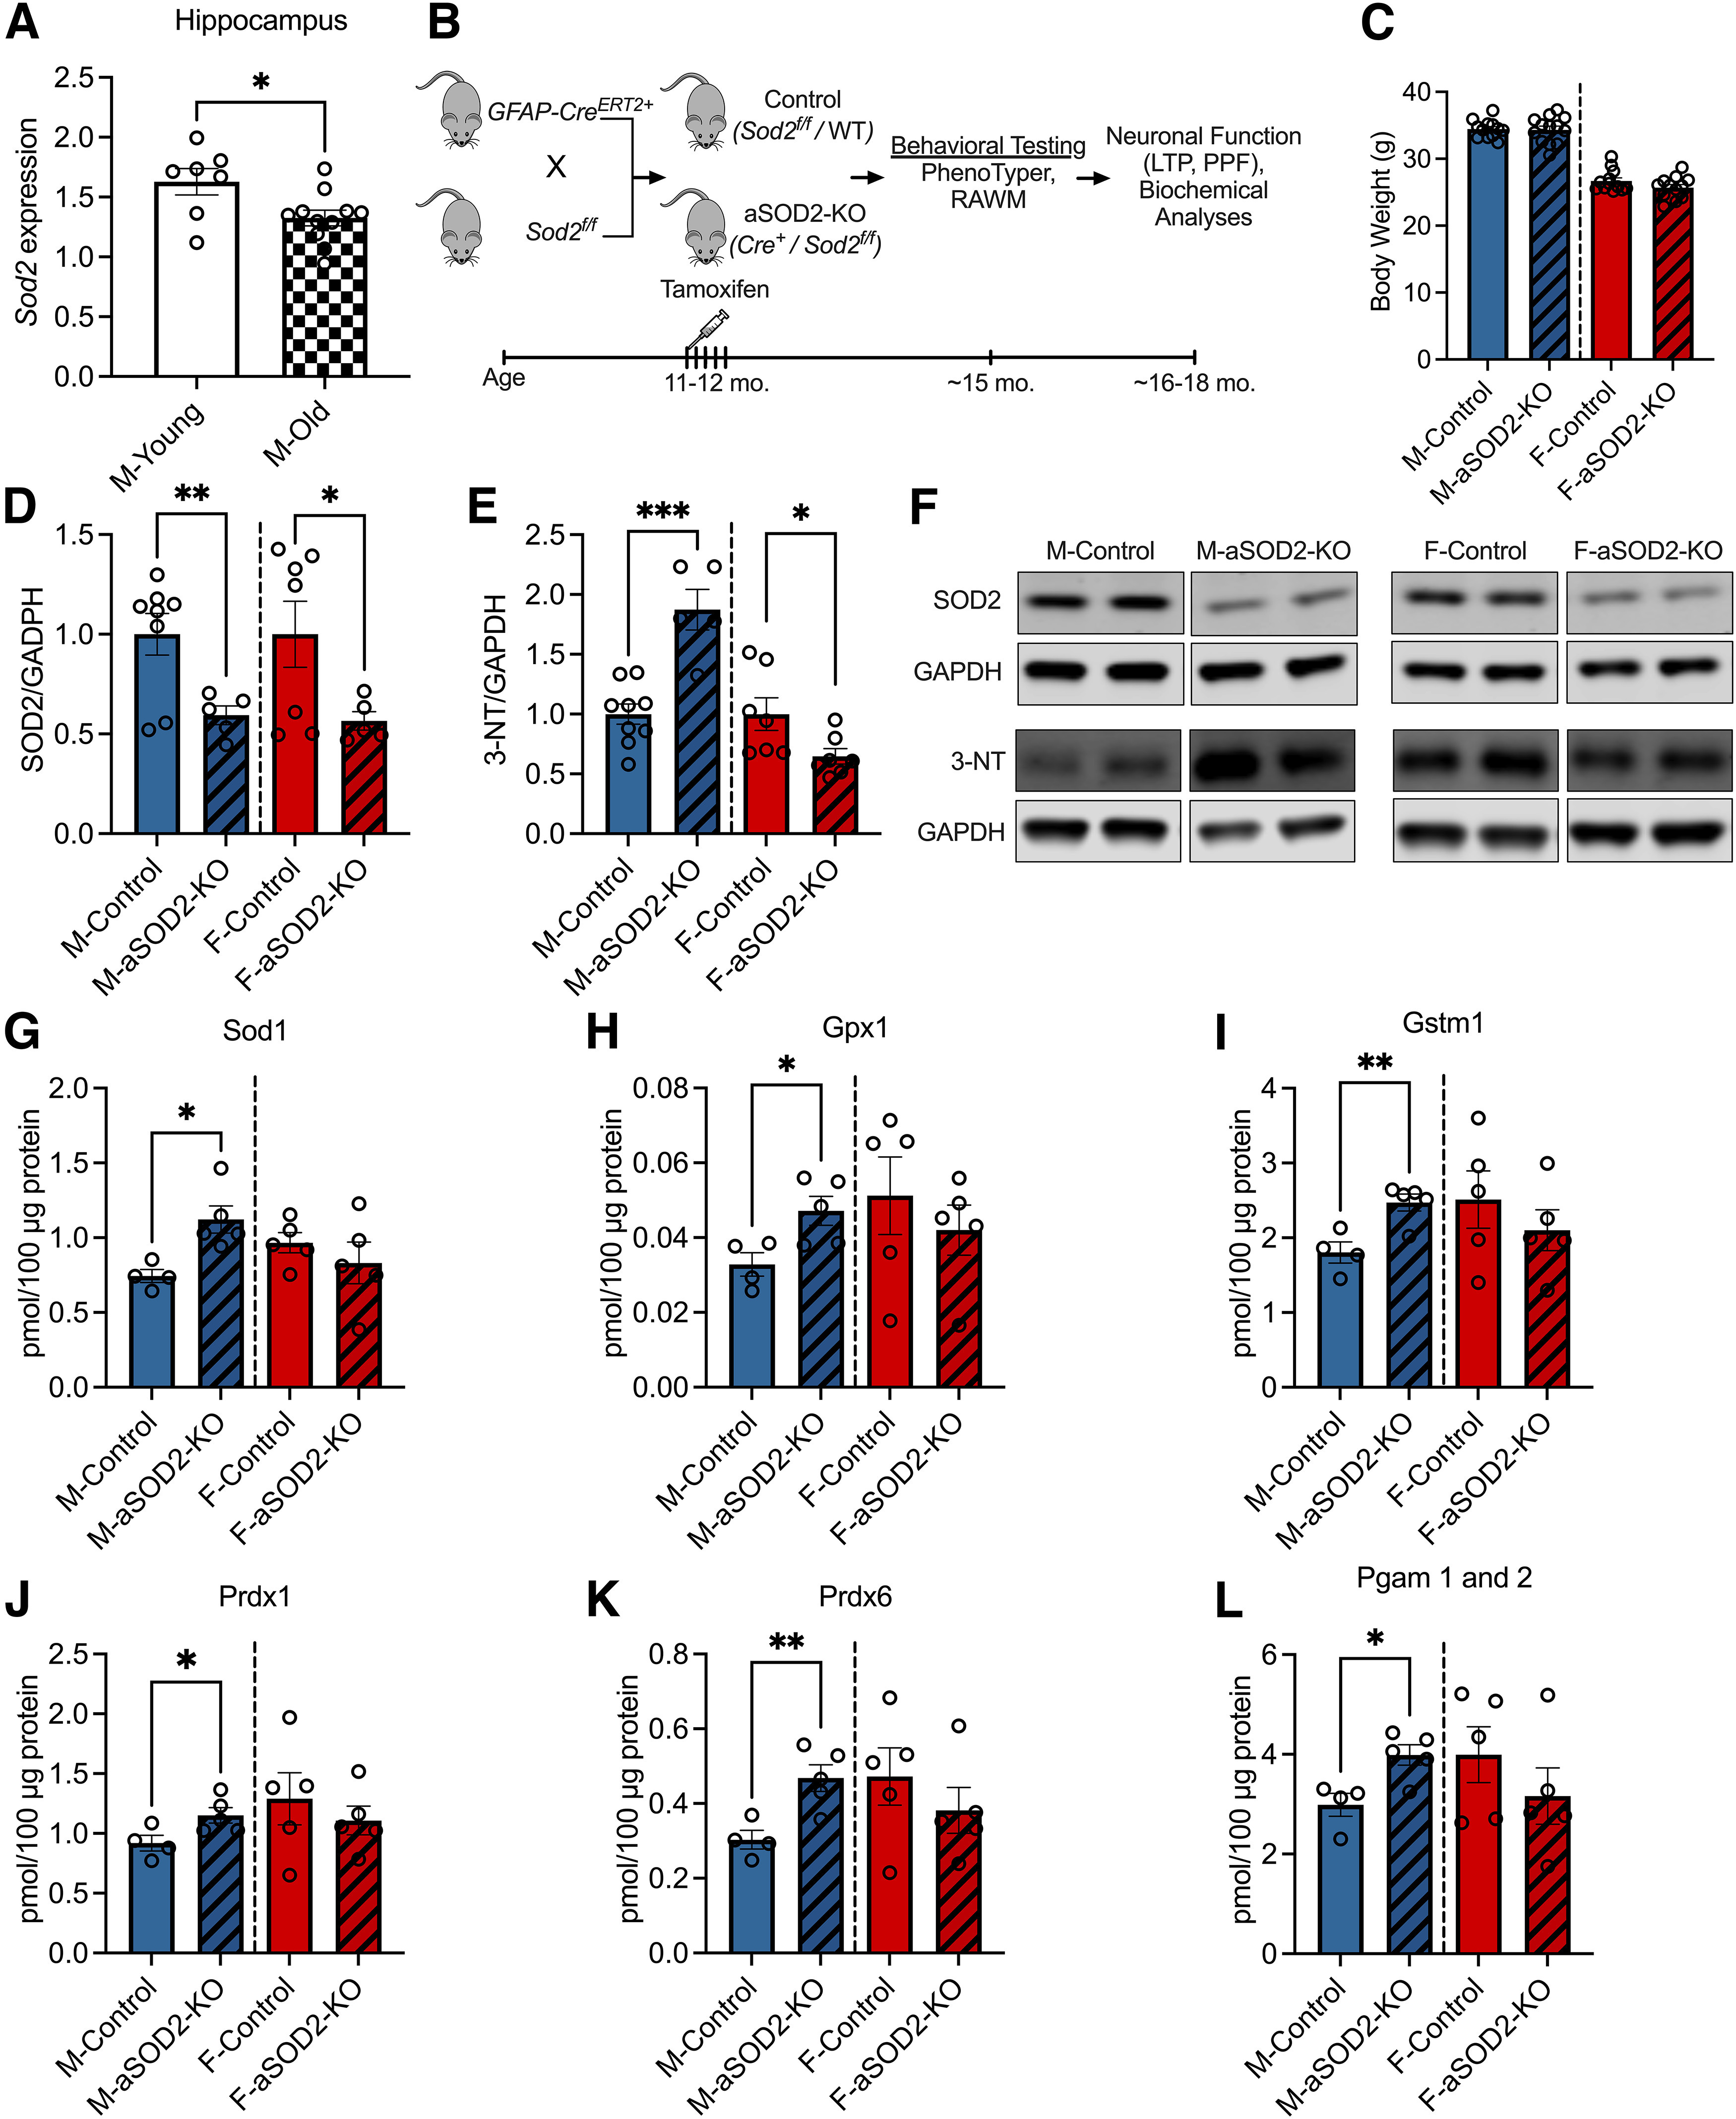
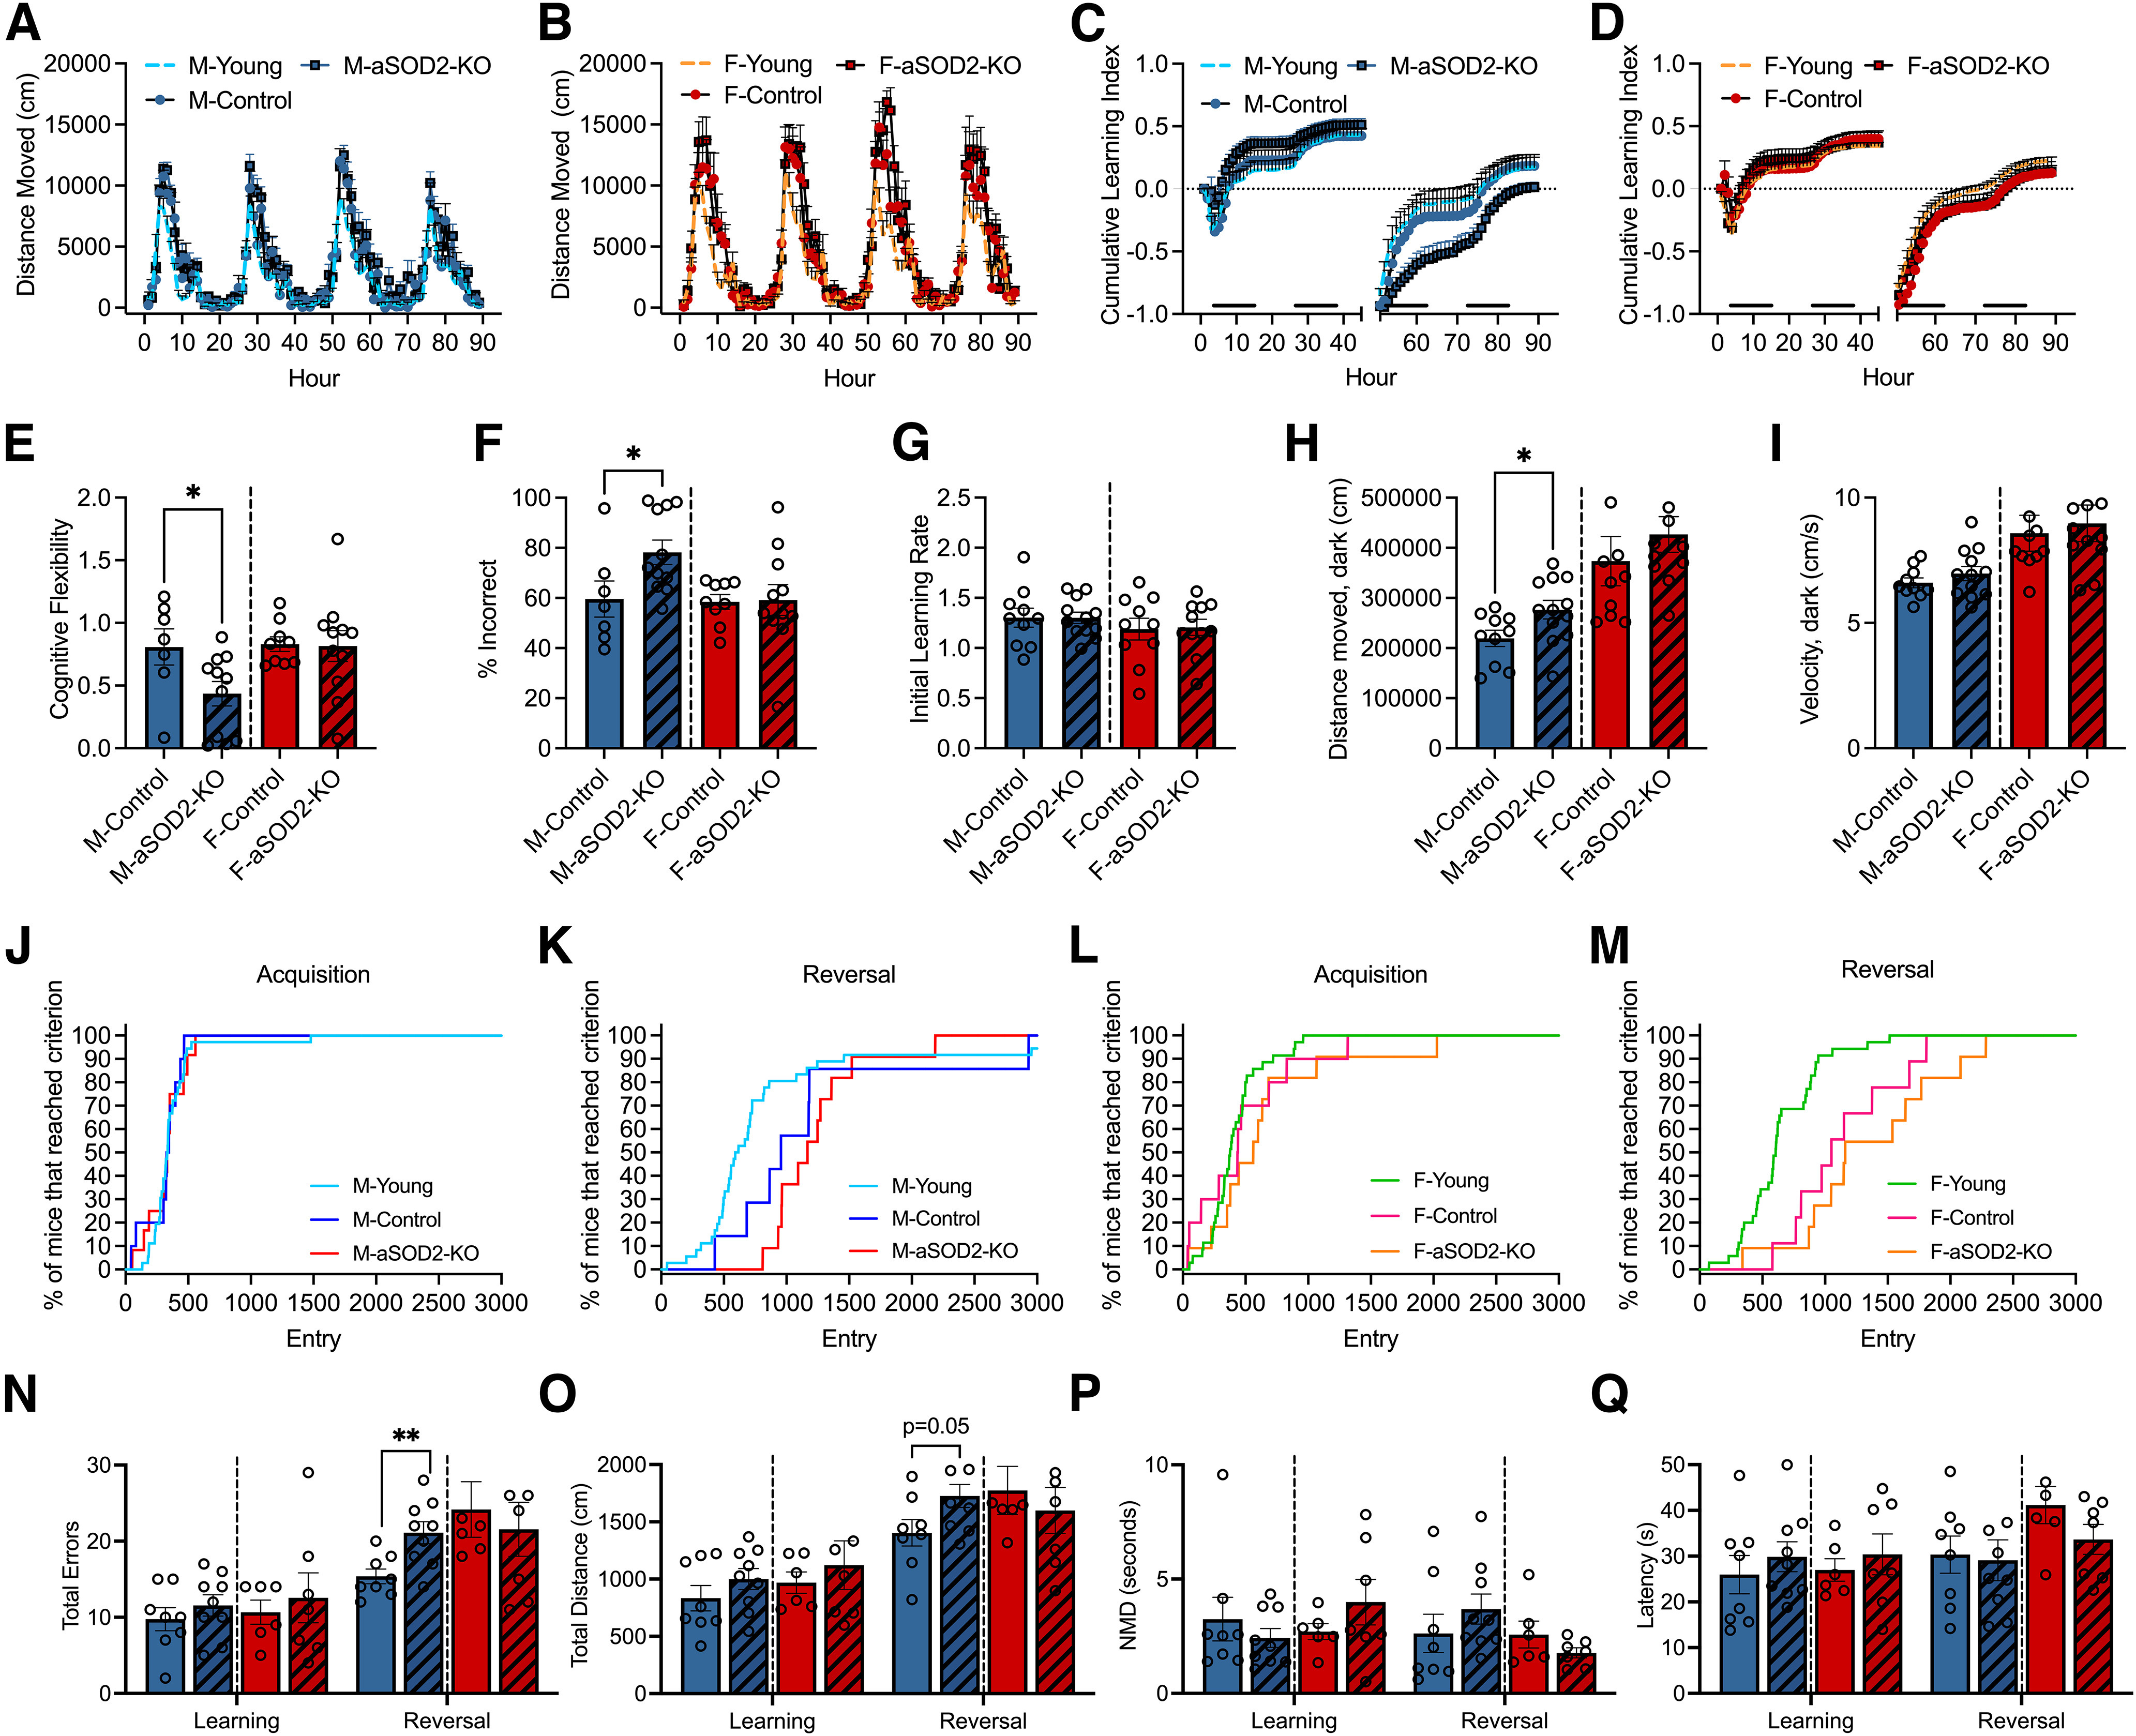
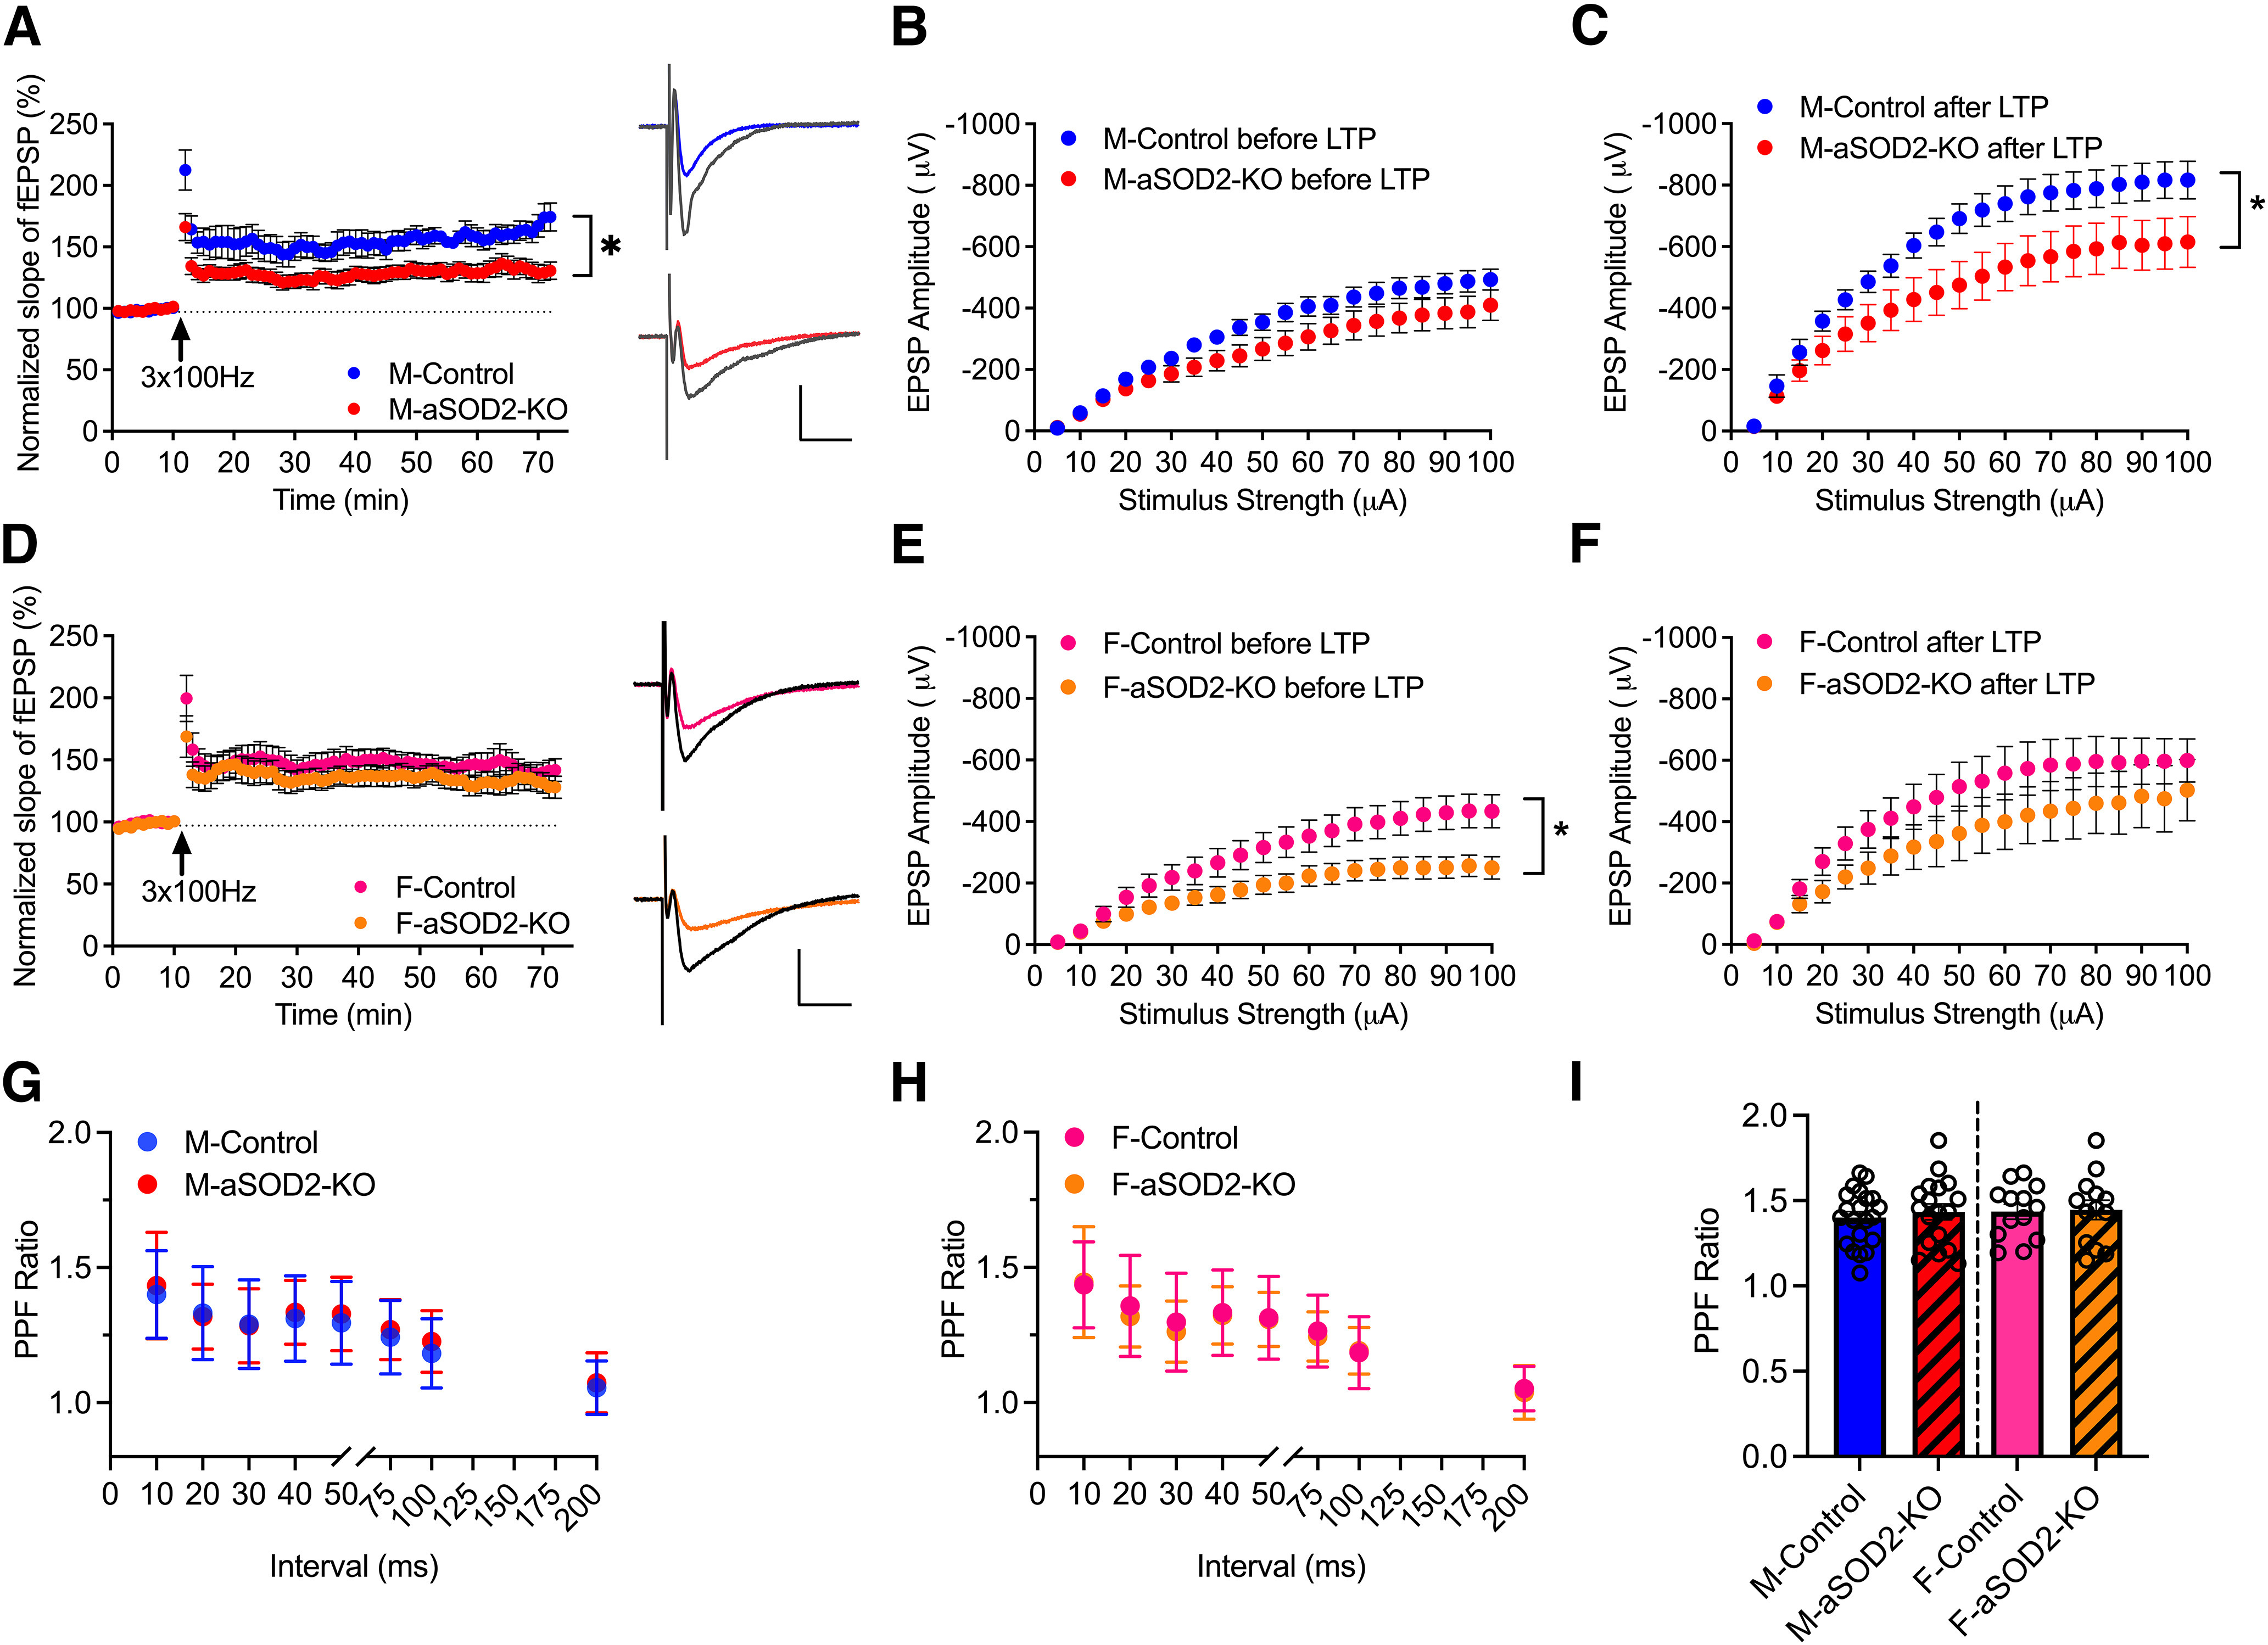
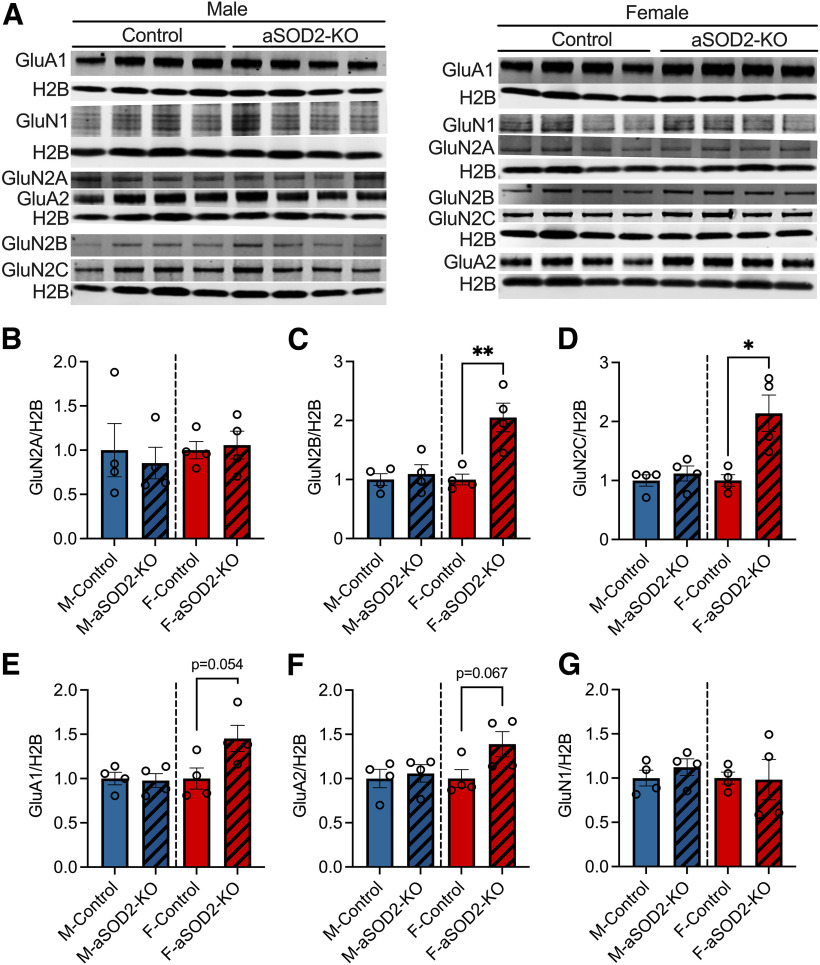
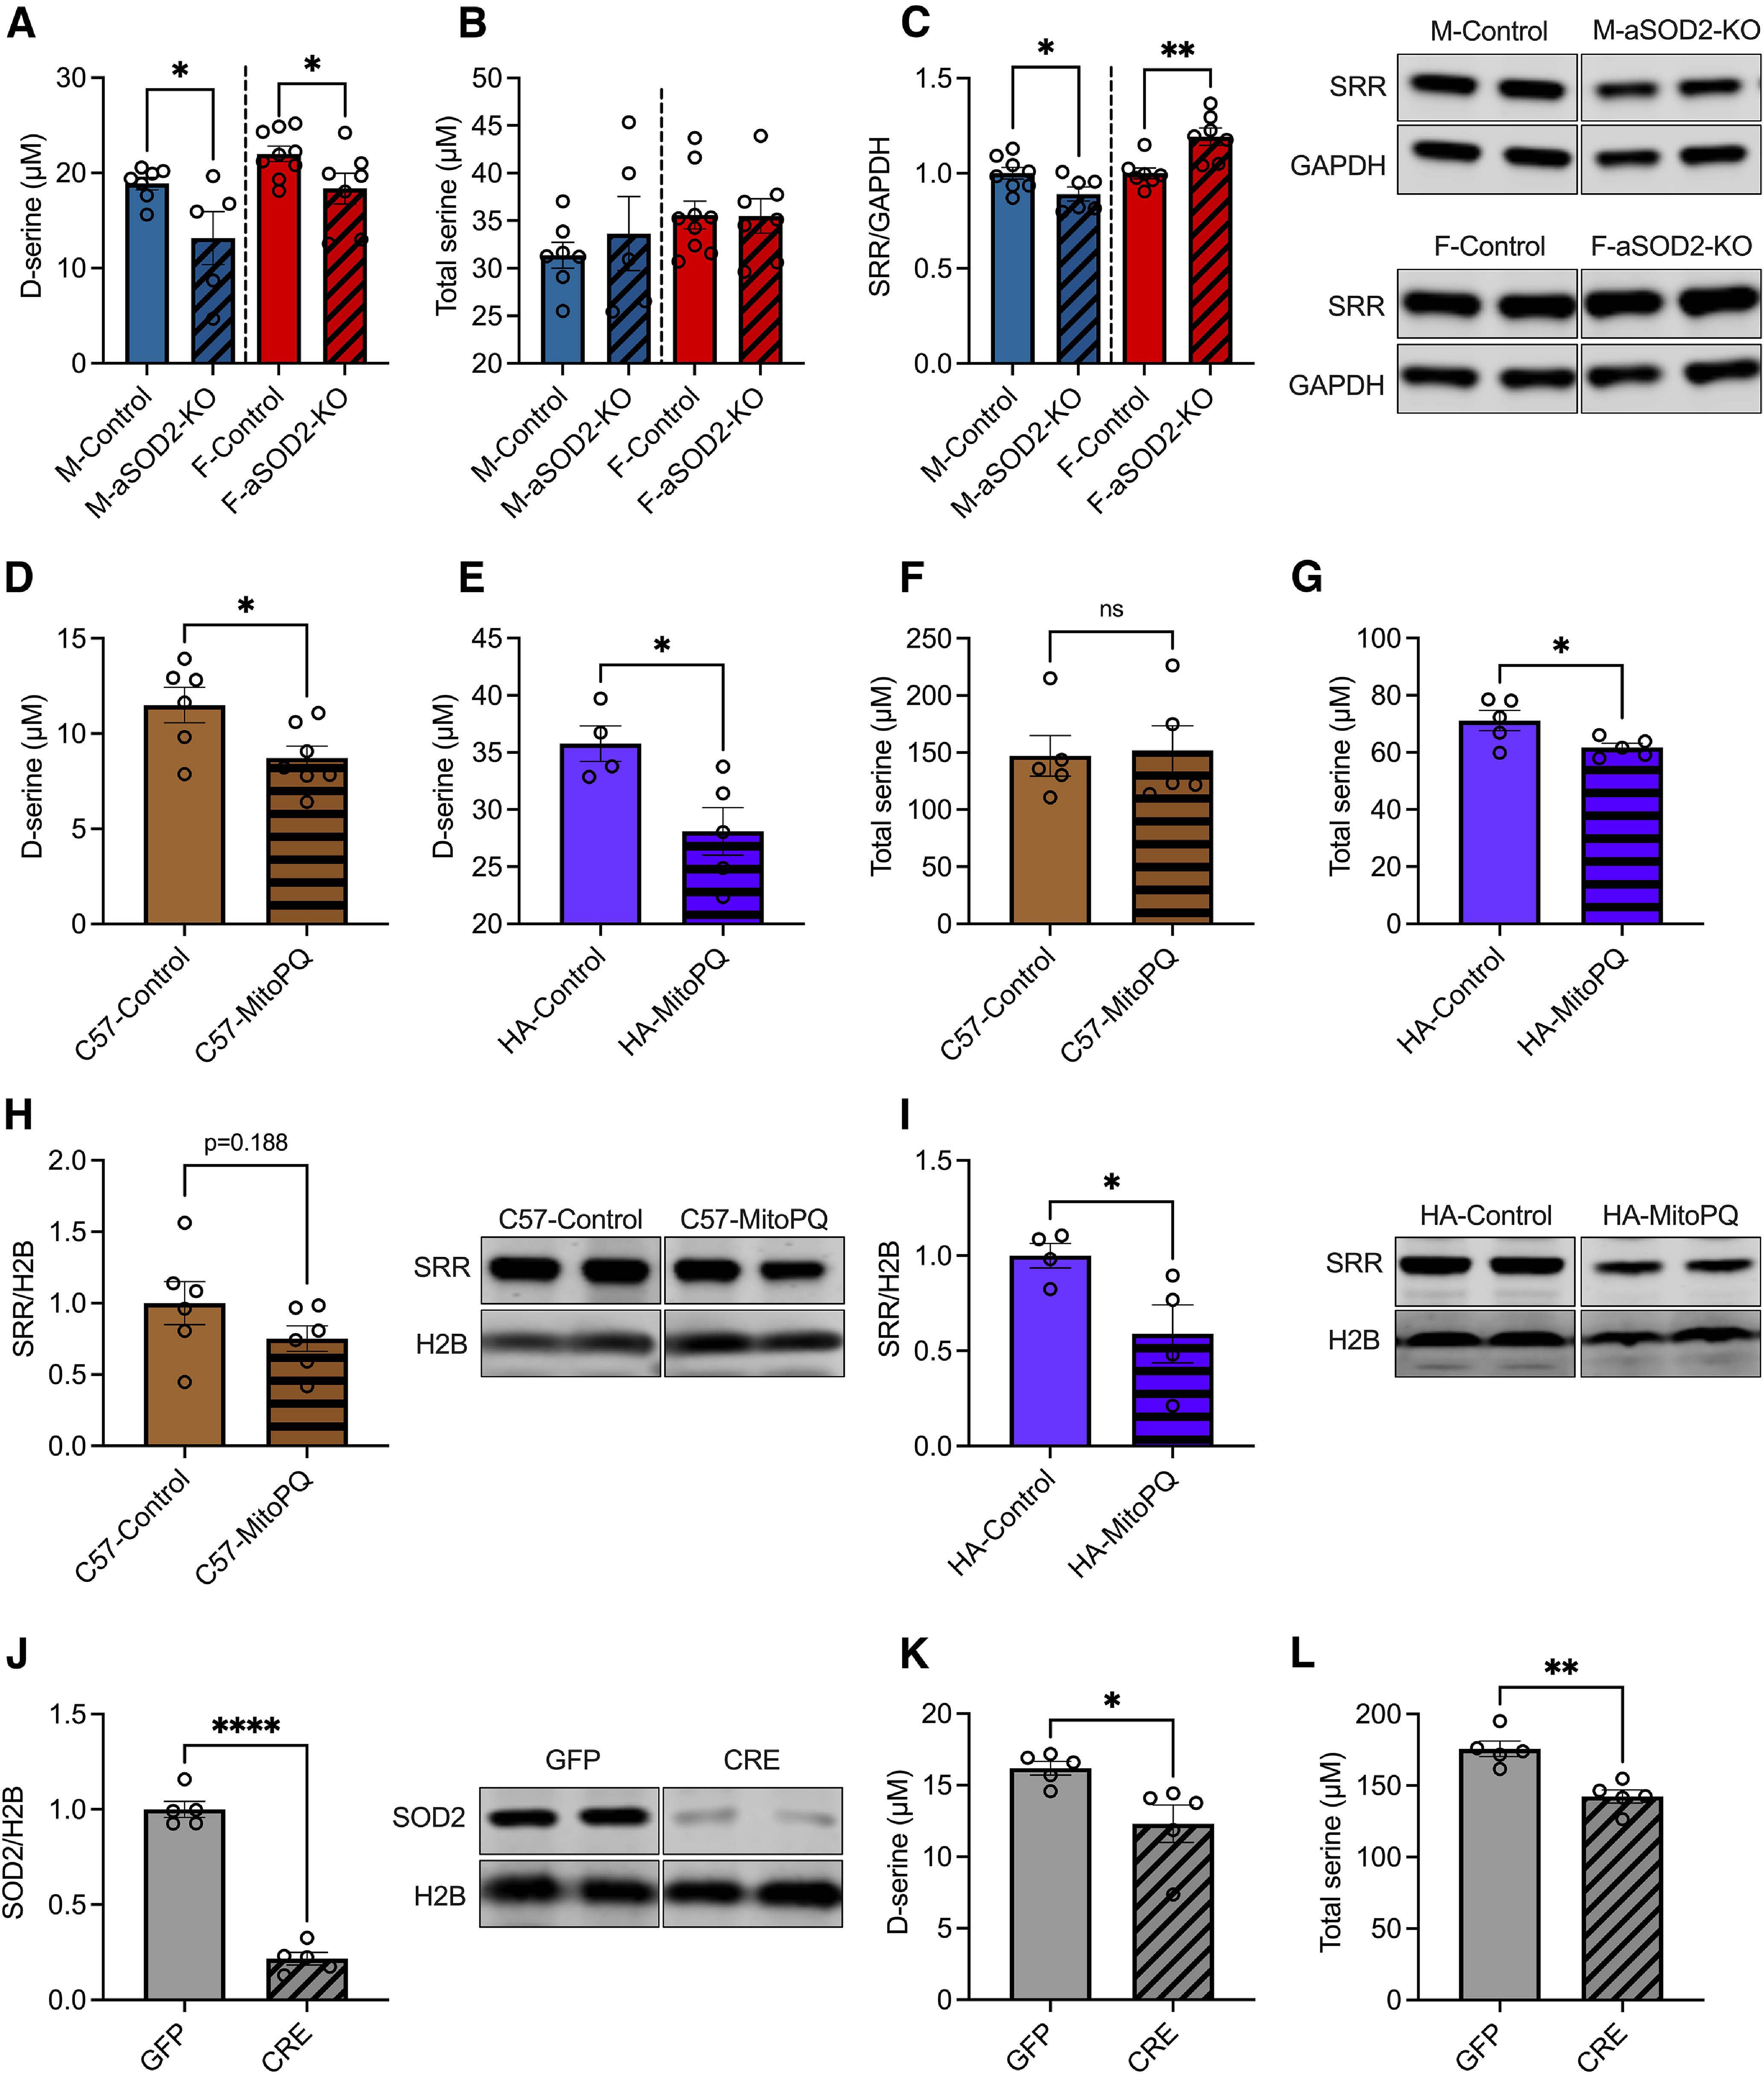
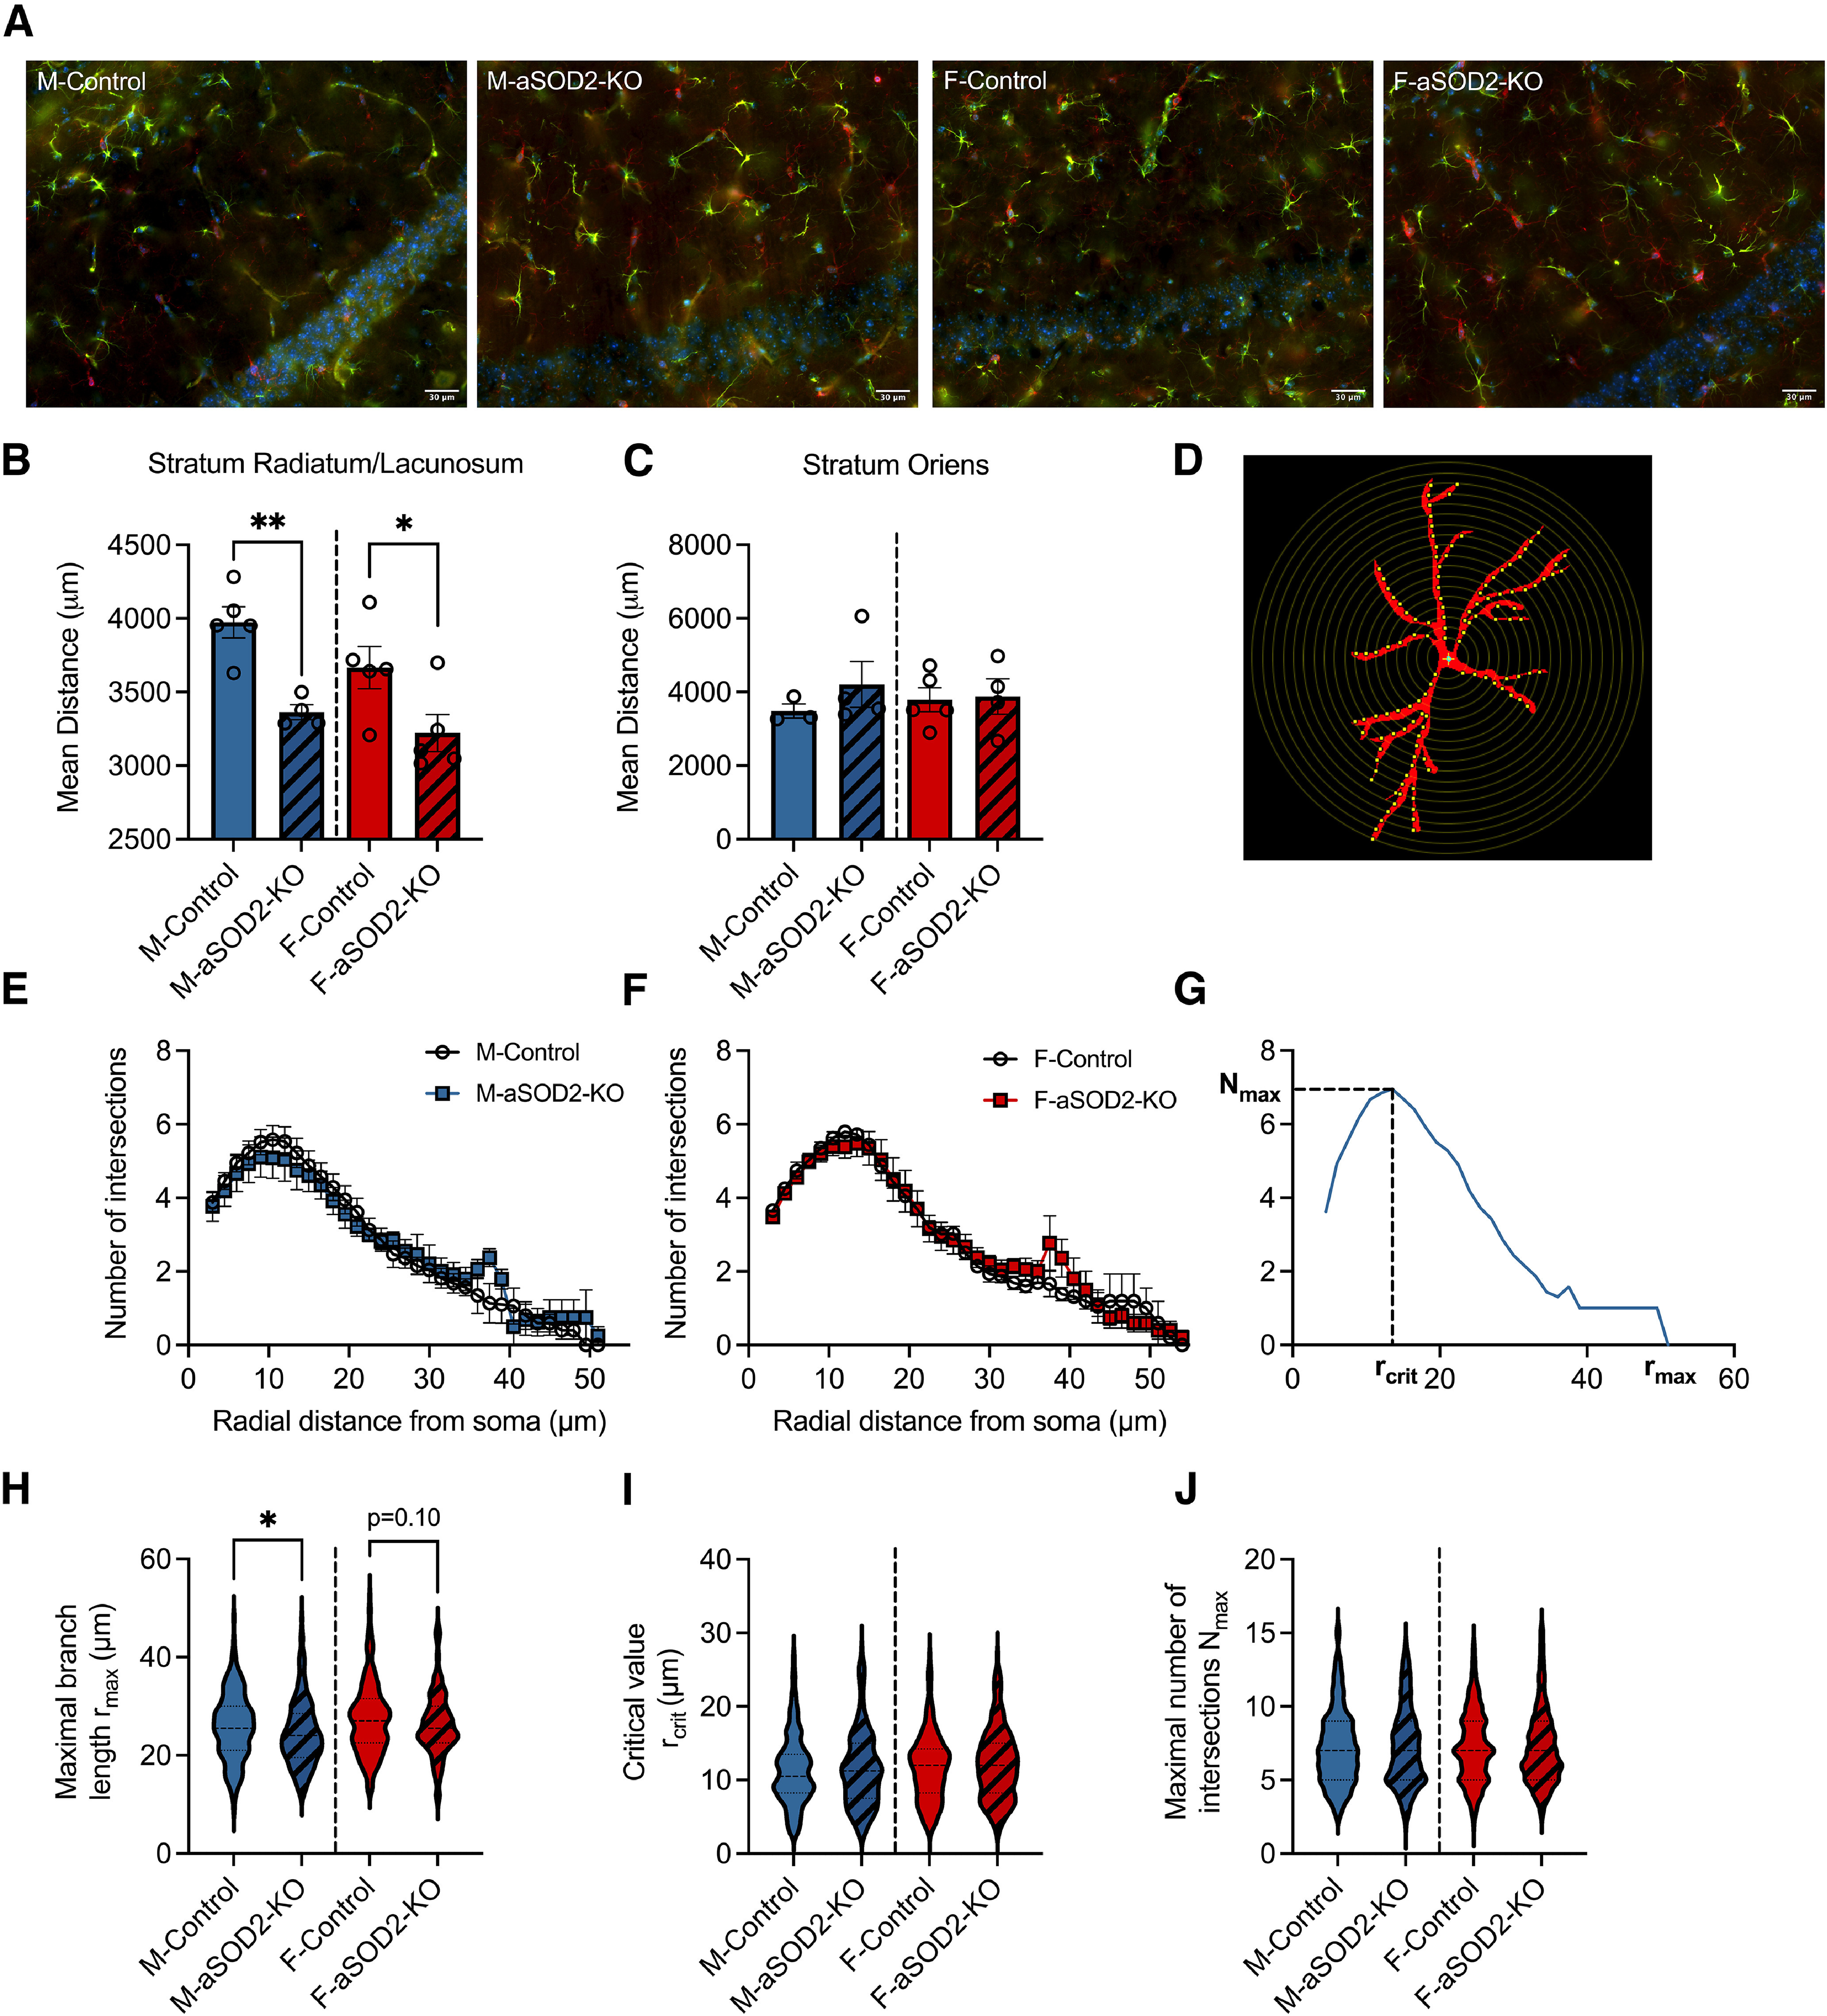
Cognitive decline is a debilitating aspect of aging and neurodegenerative diseases such as Alzheimer's disease are closely associated with mitochondrial dysfunction, increased reactive oxygen species, neuroinflammation, and astrogliosis. This study investigated the effects of decreased mitochondrial antioxidant response specifically in astrocytes on cognitive performance and neuronal function in C57BL/6J mice using a tamoxifen-inducible astrocyte-specific knockout of manganese superoxide dismutase (aSOD2-KO), a mitochondrial matrix antioxidant that detoxifies superoxide generated during mitochondrial respiration. We reduced astrocyte SOD2 levels in male and female mice at 11-12 months of age and tested in an automated home cage (PhenoTyper) apparatus for diurnal patterns, spatial learning, and memory function at 15 months of age. aSOD2-KO impaired hippocampal-dependent spatial working memory and decreased cognitive flexibility in the reversal phase of the testing paradigm in males. Female aSOD2-KO showed no learning and memory deficits compared with age-matched controls despite significant reduction in hippocampal SOD2 expression. aSOD2-KO males further showed decreased hippocampal long-term potentiation, but paired-pulse facilitation was unaffected. Levels of d-serine, an NMDA receptor coagonist, were also reduced in aSOD2-KO mice, but female knockouts showed a compensatory increase in serine racemase expression. Furthermore, aSOD2-KO mice demonstrated increased density of astrocytes, indicative of astrogliosis, in the hippocampus compared with age-matched controls. These data demonstrate that reduction in mitochondrial antioxidant stress response in astrocytes recapitulates age-related deficits in cognitive function, d-serine availability, and astrogliosis. Therefore, improving astrocyte mitochondrial homeostasis may provide a therapeutic target for intervention for cognitive impairment in aging.SIGNIFICANCE STATEMENT Diminished antioxidant response is associated with increased astrogliosis in aging and in Alzheimer's disease. Manganese superoxide dismutase (SOD2) is an antioxidant in the mitochondrial matrix that detoxifies superoxide and maintains mitochondrial homeostasis. We show that astrocytic ablation of SOD2 impairs hippocampal-dependent plasticity in spatial working memory, reduces long-term potentiation of hippocampal neurons and levels of the neuromodulator d-serine, and increases astrogliosis, consistent with defects in advanced aging and Alzheimer's disease. Our data provide strong evidence for sex-specific effects of astrocytic SOD2 functions in age-related cognitive dysfunction.

Keywords: SOD2; aging; astrogliosis; cognitive function; d-serine; long-term potentiation.


Figures

Figure 1.
Figure 1.
Effect of astrocyte-specific knockout of SOD2 on antioxidant response in male and female mice. A, Bar plots depicting decreased Sod2 mRNA expression in the hippocampus of aged (22 months of age; n = 11; shaded bar) male mice compared with young (6 months of age; n = 7; white bar) C57 controls (p = 0.02, two-tailed t test). B, Experimental schematic displaying the timeline of tamoxifen-induced aSOD2-KO in mice and subsequent behavioral testing, neuronal functional studies, and biochemical analyses. C, Bar plots depicting the weight of animals in our experimental cohort at the time of behavioral testing. There was no difference detected between the weights of aSOD2-KO animals compared with controls in male or female animals. D, Representative blot depicting reduced expression of SOD2 in the hippocampus of aSOD2-KO in male (n = 5; p = 0.006) and female (n = 5; p = 0.029) mice compared with aged-matched male (n = 8) and female (n = 7) controls, respectively (one-tailed t test). F, Blot was normalized to GAPDH. E, Western blot quantification of the oxidative stress marker 3-NT is significantly increased in aSOD2-KO males (n = 9/control, n = 5/KO; p = 0.001) and decreased in aSOD2-KO females (n = 6/controls, n = 7/KO; p = 0.018) compared with age-matched controls. F, Blot was normalized to GAPDH. G–L, Bar plots depicting quantification of mitochondrial antioxidant proteins Sod1 (p = 0.011), Gpx1 (p = 0.027), Gstm1 (p = 0.007), Prdx1 (p = 0.042), Prdx6 (p = 0.0087), and Pgam 1 and 2 (p = 0.014) in aSOD2-KO mice via targeted proteomic mass spectrometry analysis (n = 4–5 animals/group). For graphs in C–J, colored bars represent the following: males (blue), females (red), and aSOD2-KO (shaded). Error bars depict the mean ± SEM. Significance was tested using unpaired Student's t test (*p < 0.05, **p < 0.01, ***p < 0.001). Please see Extended Data Tables 1-1, 1-2, and 1-3.
Figure 2.
Figure 2.
Astrocyte-specific SOD2-KO impairs cognitive performance in males. A–Q, Behavioral data in the PhenoTyper (A–M) and RAWM (N–Q) are represented below. A, B, Circadian activity (distance moved) of aSOD2-KO (males: n = 11, blue square; females: n = 11, red square) and age-matched control (males: n = 7, blue circle; females: n = 9, red circle) males (A) and females (B) plotted per hour over a 90 h period in the PhenoTyper. Young (6 months) C57BL/6J (males: n = 12, blue dashed line; females: n = 12, red dashed line) mice served as reference controls for optimal activity and cognitive performance. C, D, Cumulative learning index during initial discrimination (acquisition; 0–49 h) and reversal (50–89 h) phases show a decline in aSOD2-KO males (C), but not in females (D), over the 90 h testing period. Black bars near the x-axis indicate dark periods of the light/dark cycle. E, Cognitive flexibility measured during hours 51–61 of the reversal phase is reduced in aSOD2-KO males (p = 0.040) but not in females. F, Percentage (%) of incorrect entries (left + middle entries/total entries) calculated during hours 51–61 of the reversal phase is increased in males (p = 0.040) but not in females. G, Bar plot depicting no changes in the initial learning rate of males and females assessed using the PhenoTyper between aSOD2-KO and age-matched controls. H, Bar plots depicting the distanced moved of males (p = 0.033) and females during the dark phase of the reversal phase in the PhenoTyper. I, Bar plots depicting differences between groups in the velocity of males and females during the dark phase of the PhenoTyper. J–M, Survival graphs depicting the number of entries to reach 80% criteria in the acquisition phase and reversal phase for males (E, F; n = 7–11/group) and females (G, H; n = 9–11/group). Young controls (6 months of age; n = 12/sex) were used as reference for optimal performance. N, Total errors (number of entries into incorrect arms) plotted during acquisition (learning) and reversal learning in the radial arm water maze in males (n = 8-9/group) and females (n = 6-7/group). Male aSOD2-KO mice showed a significant decline in reversal learning (p = 0.0058) compared with controls. O, Distance moved (path length) plotted during acquisition (learning) and reversal learning in the radial arm water maze in males and females. Male aSOD2-KO showed an increase in reversal learning path length compared with controls (p = 0.051). P, Bar plots depicting the nonmoving duration (NMD) in the radial arm water maze showed no differences between aSOD2-KO and control in males (H; n = 8–9/group) and females (I; n = 6–7/group). Q, Bar plots depicting the latency to target showed no differences in the initial and reversal phases in either groups for males and females in the radial arm water maze (n = 8–9/group). For graphs I–Q, colored bars represent the following: males (blue), females (red), aSOD2-KO (shaded). Error bars depict the mean ± SEM. Significance was tested using unpaired Student's t test (*p < 0.05; **p < 0.01).
Figure 3.
Figure 3.
LTP at hippocampal CA1 synapses is impaired in aSOD2-KO male mice. A, Normalized fEPSP showing the induction of LTP in male aSOD2-KO mice (N = 12 recordings, n = 5; p = 0.012) compared with control mice (N = 11 recordings, n = 5). Representative traces show EPSPs before (color line) and after (black line) 3× 100 Hz (arrow) stimulation to induce LTP. Each data point represents the average of two successive test responses. Calibration: y, 500 µV; x = 50 ms. B, C, Graphs depicting the input–output curve amplitude of fEPSP evoked before (B) and after (C; p = 0.020) LTP in male mice. LTP from control (N = 9 recordings) and aSOD2-KO (n = 8 recordings) slices by stepwise increase in the stimulus from 5 to 100 µA. Both groups showed an increase in the fEPSP amplitudes after 1 h of LTP induction. Two-way ANOVA genotype × stimulation intensity interaction: F(19,300) = 1.819, p = 0.0204; genotype: F(1,300)= 284.9, p < 0.0001; stimulation intensity: F(19,300) = 26.54, p < 0.0001. D, Normalized fEPSP showing induction of LTP in female aSOD2-KO mice (N = 12 recordings, n = 5 compared with control mice; N = 14 recordings, n = 5). Representative traces show EPSPs before (color line) and after (black line) 3× 100 Hz (arrow) stimulation to induce LTP. Each data point represents the average of two successive test responses. Calibration: y = 500 µV; x = 50 ms. E, F, Graphs depicting the input–output curve amplitude of fEPSP evoked before (E; p = 0.0162) and after (F) LTP in female mice. LTP from control and aSOD2-KO slices by stepwise increase in the stimulus from 5 to 100 µA. Both groups showed an increase in the fEPSP amplitudes after 1 h of LTP induction. Two-way ANOVA genotype × stimulation intensity interaction: F(19,380) = 1.856, p = 0.0162; genotype: F(1,380)= 158.1, p < 0.0001; stimulation intensity: F(19,380) = 16.41, p < 0.0001. G, H, Paired-pulse facilitation in male (G; N = 18–21 recordings/group) and female (H; N = 13–14 recordings/group) control and aSOD2-KO mice with step-wise increase in interval in milliseconds between two pulses. I, The highest PPF values obtained at the 10 ms interval are plotted. For all graphs, colored points and bars represent the following: male-control, blue; male-aSOD2-KO, red; female-control, pink; female-aSOD2-KO, orange. Error bars depict the mean ± SEM. Significance was tested using unpaired Student's t test or two-way ANOVA (*p < 0.05). n = 5 animals/group, with N as listed per respective experiment.
Figure 4.
Figure 4.
AMPA receptor and NMDA receptor expression in aSOD2-KO brain tissue of both males and females. A, Blots representing the expression of AMPA (GluA1 and GluA2) and NMDA (GluN1, GluN2A, GluN2B, and GluN2C) receptor subunits in brain homogenates of male and female aSOD2-KO mice compared with controls (n = 4/group). Blots were normalized to H2B. B–G, Bar plots depicting quantification of GluN2A (B), GluN2B (C; p = 0.006), GluN2C (D; p = 0.012), GluA1 (E; p = 0.054), GluA2 (F; p = 0.067), and GluN1 (G) for male and female aSOD2-KO mice compared with controls. Blots were normalized to H2B. Colored bars represent the following: males, blue; females, red; aSOD2-KO, shaded. Error bars depict the mean ± SEM. Significance was tested using unpaired Student's t test (*p < 0.05; **p < 0.01).
Figure 5.
Figure 5.
Mitochondrial oxidative stress results in impaired d-serine availability in aSOD2-KO and cultured astrocytes. A, Bar plots depicting significant declines in d-serine levels in male and female aSOD2-KO hippocampi (male: n = 5; p = 0.041; female: n = 7; p = 0.047) relative to controls (male, n = 7; female, n = 9). B, No differences in total serine were detected in aSOD2-KO male or female hippocampi relative to controls (n = 3–5 animals/group). C, Bar plots and representative blot of SRR expression in hippocampal lysates show a significant reduction in SRR expression in aSOD2-KO males (n = 5–7/group; p = 0.041) and a significant increase in SRR expression in aSOD2-KO females relative to controls (n = 7–9/group; p = 0.047). Blot was normalized to GAPDH. D, E, Cultured primary mouse astrocytes (D; n = 6–7/group; p = 0.026) and human (E; n = 4–5/group; p = 0.025) astrocytes treated with MitoPQ (5 µm for 24 h) show a significant decline in d-serine levels compared with controls. F, G, Total serine of MitoPQ-treated (5 µm for 24 h) astrocytes cultured from C57BL/6J mice and human hippocampus. Total serine levels were unchanged in mouse astrocytes with MitoPQ treatment but were significantly reduced in human astrocytes compared with controls. H, I, Quantification and representatives blot of SRR protein expression normalized to H2B from mouse and human primary astrocytes. SRR expression showed a trending decline in mouse (n = 6/group, p = 0.188) and a significant decrease in human (n = 4/group; p = 0.048) astrocytes treated with MitoPQ compared with controls. J, Primary astrocytes cultures from Sod2f/f mice treated with AAV-Cre or -GFP showed significant reduction (n = 5/group; p = 0.023) in SOD2 levels in the knockout (CRE) relative to controls (GFP). Blot was normalized to H2B. K, L, Levels of d-serine and total serine were significantly reduced in SOD2 knock-out astrocytes (n = 5/group; p = 0.023 and p = 0.001). Colored bars represent the following: males, blue; females, red; primary mouse astrocytes, brown; human astrocytes, purple; Sod2f/f astrocyte cultures, gray. All shaded bars represent either SOD2-KO or MitoPQ-treated groups. Error bars depict the mean ± SEM. Significance was tested using unpaired two-tailed Student's t test (***p < 0.001; **p < 0.01; *p < 0.05). n as listed per respective experiment.
Figure 6.
Figure 6.
Astrocyte-specific SOD2-KO increases gliosis in the hippocampus of aSOD2-KO mice. A, Representative image montages of merged immunostained images labeled for GFAP (green; astrocytes), Iba1 (red; microglia), and DAPI (blue; nuclei) within the CA1 region of the hippocampus of male and female control and aSOD2-KO mice. Scale bar, 30 µm. B, Knockout of SOD2 in astrocytes produced a decrease in astrocyte spacing in stratum radiatum and stratum lacunosum (n = 4-5/group; p = 0.002 and p = 0.047) compared with control mice. C, No differences were detected in the mean distance between neighboring astrocytes in stratum oriens. D, Example of a GFAP-labeled astrocyte with superimposed concentric circles (step size, 1.5 µm) used for Sholl analysis. E, F, Quantification of the number of projection intersections plotted against radial distance from the soma shows no difference between aSOD2-KO and controls in males (E; N = 45 astrocytes/n, n = 4–5/group) and females (F; N = 45 astrocytes/n, n = 5/group). Clear circles represent controls, while colored squares represent aSOD2-KO for each sex, respectively. G, Representative Sholl plot of one astrocyte displaying the parameters of rmax, rcrit, and Nmax quantified in H–J. H, The rmax of astrocytic projections was decreased in aSOD2-KO males (N = 180–225 astrocytes, n = 4–5/group; p = 0.031) compared with controls while aSOD2-KO females had a trending decrease (N = 225 astrocytes, n = 5/group; p = 0.10) compared with controls. I, J, No changes were detected in the rcrit or the Nmax between aSOD2-KO males and females compared with respective controls. Colored bars represent the following: males, blue; females, red; aSOD2-KO, shaded. Error bars depict the mean ± SEM. Significance was tested using unpaired Student's t test (*p < 0.05; **p < 0.01).

References

    1. Billard JM (2015) D-Serine in the aging hippocampus. J Pharm Biomed Anal 116:18–24. 10.1016/j.jpba.2015.02.013 - DOI - PubMed
    1. Birben E, Sahiner UM, Sackesen C, Erzurum S, Kalayci O (2012) Oxidative stress and antioxidant defense. World Allergy Organ J 5:9–19. 10.1097/WOX.0b013e3182439613 - DOI - PMC - PubMed
    1. Bolanos JP (2016) Bioenergetics and redox adaptations of astrocytes to neuronal activity. J Neurochem 139 [Suppl 2]:115–125. - PMC - PubMed
    1. Bourgognon JM, Spiers JG, Robinson SW, Scheiblich H, Glynn P, Ortori C, Bradley SJ, Tobin AB, Steinert JR (2021) Inhibition of neuroinflammatory nitric oxide signaling suppresses glycation and prevents neuronal dysfunction in mouse prion disease. Proc Natl Acad Sci U|S|A 118:e2009579118. - PMC - PubMed
    1. Carvajal FJ, Mira RG, Rovegno M, Minniti AN, Cerpa W (2018) Age-related NMDA signaling alterations in SOD2 deficient mice. Biochim Biophys Acta Mol Basis Dis 1864:2010–2020. 10.1016/j.bbadis.2018.03.019 - DOI - PubMed

Publication types