. 2022 Jun 27;13(1):3678.
doi: 10.1038/s41467-022-31180-z.

POLYRETINA restores light responses in vivo in blind Göttingen minipigs

Affiliations

POLYRETINA restores light responses in vivo in blind Göttingen minipigs

Paola Vagni et al. Nat Commun. .

Abstract

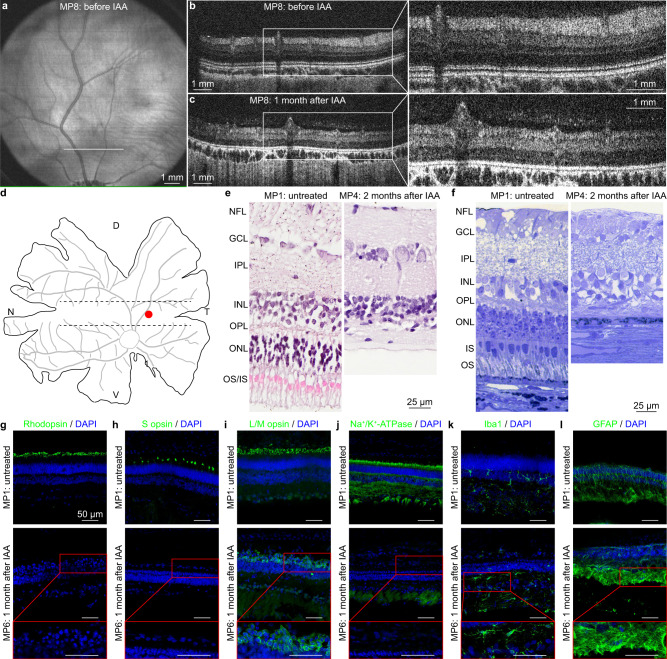
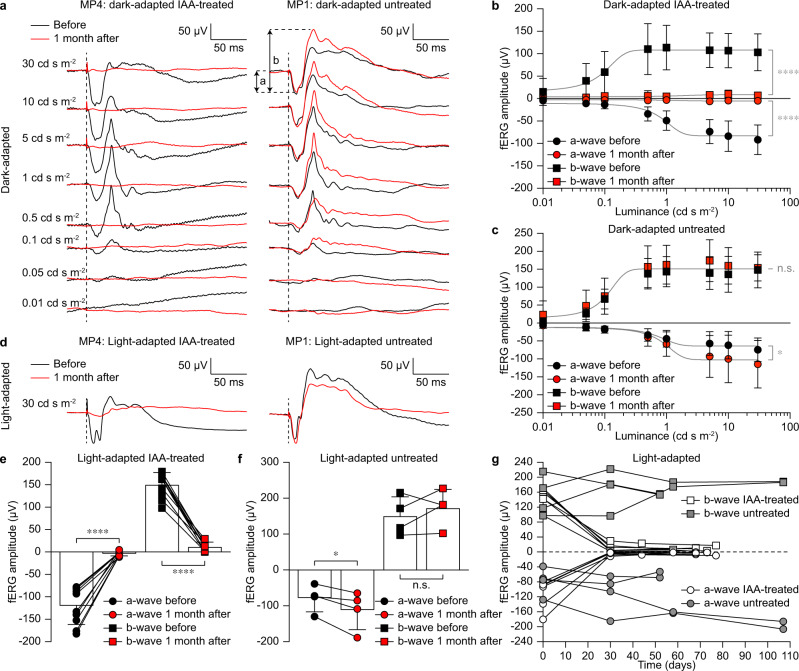
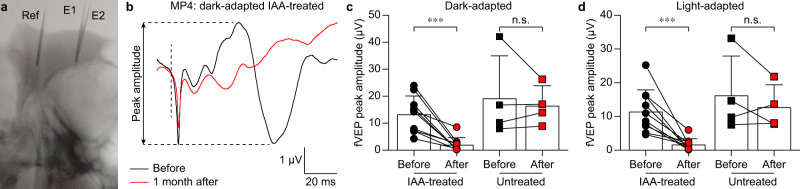
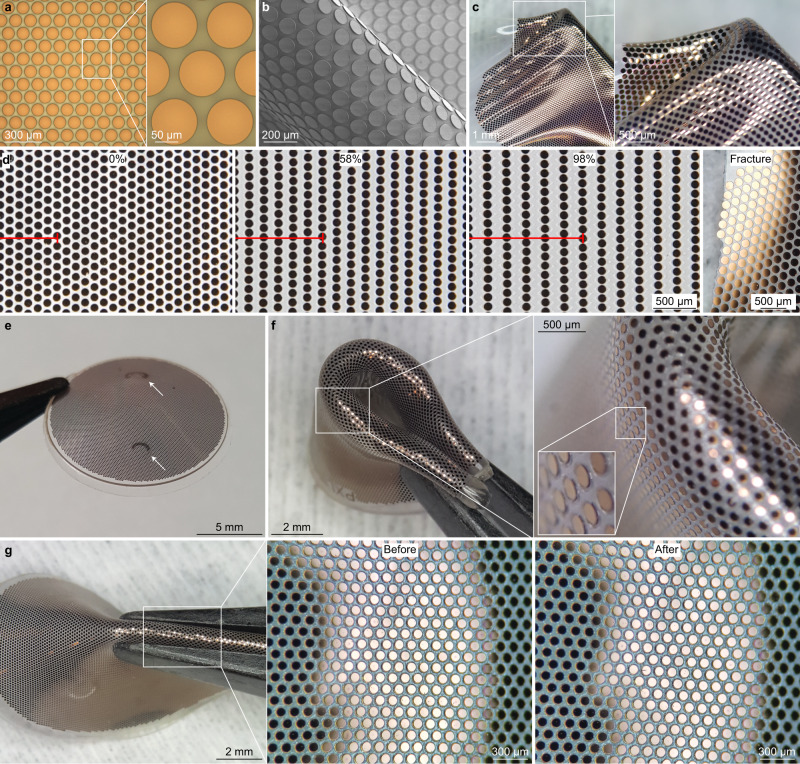
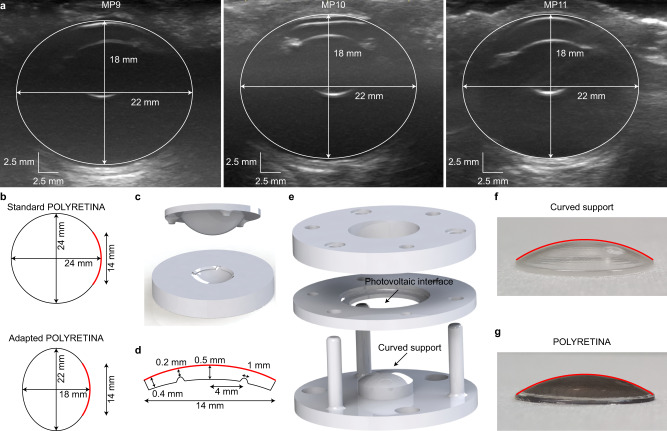
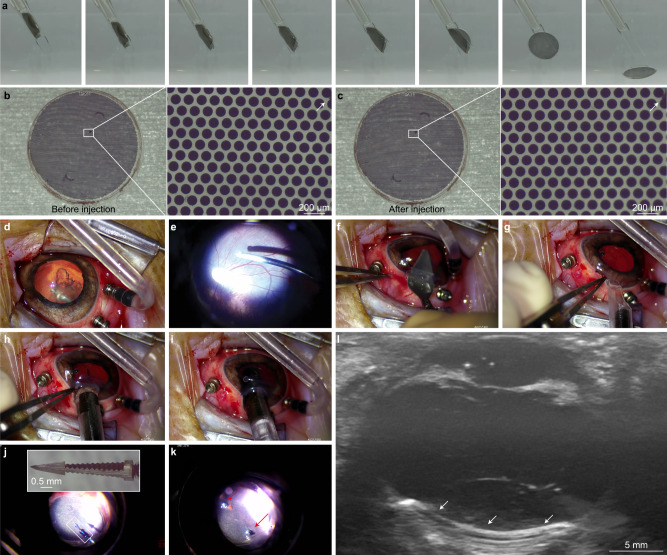
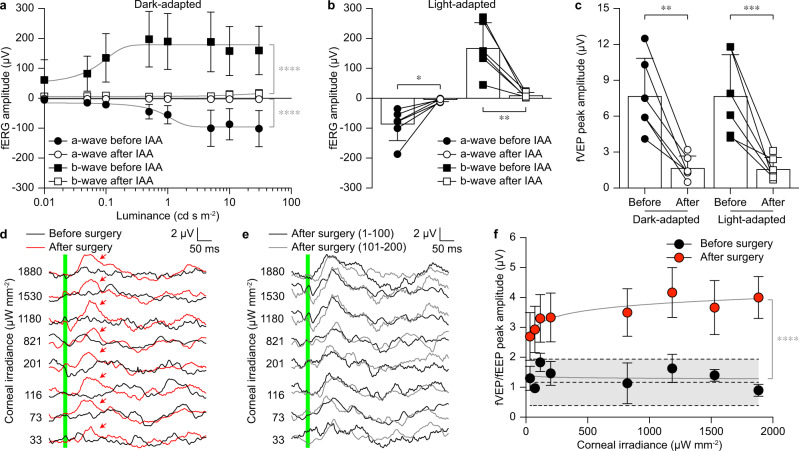
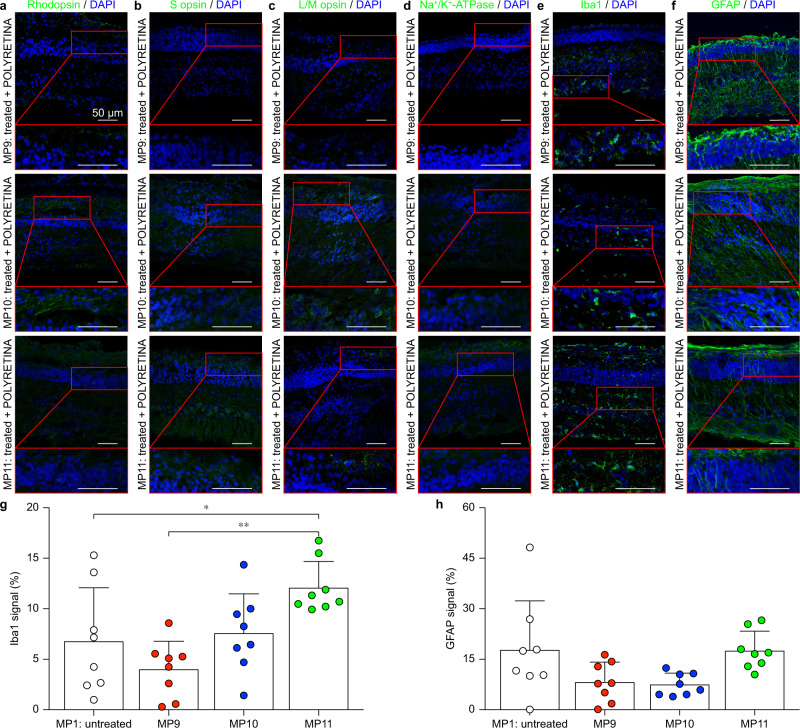
Retinal prostheses hold the potential for artificial vision in blind people affected by incurable diseases of the outer retinal layer. Available technologies provide only a small field of view: a significant limitation for totally blind people. To overcome this problem, we recently proposed a large and high-density photovoltaic epiretinal device, known as POLYRETINA. Here, we report the in vivo assessment of POLYRETINA. First, we characterise a model of chemically-induced blindness in Göttingen minipigs. Then, we develop and test a minimally invasive injection procedure to insert the large epiretinal implant into the eye. Last, we show that POLYRETINA restores light-evoked cortical responses in blind animals at safe irradiance levels. These results indicate that POLYRETINA holds the potential for artificial vision in totally blind patients affected by retinitis pigmentosa.


Conflict of interest statement

D.G. and M.J.I.A.L. are authors of a patent covering the POLYRETINA device [Applicants: École Polytechnique Fédérale de Lausanne; Inventors: Ghezzi Diego, Airaghi Leccardi Marta Jole Ildelfonsa and Ferlauto Laura; Application number: WO2018177547A1]. D.G., C.-H.V. and T.J.W. are authors of a patent covering the injector [Applicants: École Polytechnique Fédérale de Lausanne and Fondation Asile des Aveugles; Inventors: Ghezzi Diego, Wolfensberger Thomas and Vila Charles-Henri; Application number: WO2020229683A1]. The remaining authors declare no competing interests.

Figures

Fig. 1
Fig. 1. Retinal imaging in blind minipigs.
a Fundus image before IAA administration. b, c SD-OCT images of the retina before and 1 month after IAA administration, taken 2 mm above the optic disc (white line in panel a). The white boxes show a magnification of the retinal sections. Panels ac are from MP8. d, Drawing of a flattened retina. The dashed lines delimit the area centralis, while the red circle indicates the point in the area centralis (central temporal) corresponding to the images in panels el. D dorsal; T temporal; V ventral; N nasal. e H&E staining of a retinal section in the area centralis (red circle in d) before and 2 months after IAA administration. NFL nerve fibre layer; GCL ganglion cell layer; IPL inner plexiform layer; INL inner nuclear layer; OPL outer plexiform layer; ONL outer nuclear layer; IS inner segments; OS outer segments. f, Semithin optical image of a retinal section in the area centralis (red circle in d) before and 2 months after IAA administration. Images in panels e, f are from MP1 and MP4. gl IHC staining of a retinal section in the area centralis (red circle in d) against rhodopsin (g), S opsin (h), L/M opsin (i), Na+/K+-ATPase (j), Iba1 (k), and GFAP (l) before and 1 month after IAA administration. The red inserts show magnifications of the retinal sections 1 month after IAA administration. All scale bars in panels gl are 50 µm. Images in panels gl are from MP1 and MP6. H&E and IHC analyses have been performed at various time points (n = 1 eye from N = 1 minipig per time point).
Fig. 2
Fig. 2. fERGs in blind minipigs.
a Dark-adapted responses in an IAA-treated minipig before and 1 month after IAA administration and in an untreated minipig at matching time points. The dashed lines indicate the flash onset. The quantification of the a-wave and b-wave is indicated. b, c Quantification of the dark-adapted fERGs in IAA-treated (mean ± s.d., n = 10 eyes from N = 5 minipigs) and untreated (mean ± s.d., n = 4 eyes from N = 2 minipigs) animals. Grey lines are the logistic growth regressions for IAA-treated (a-wave before: R2 = 0.6973; a-wave after: R2 = 0.0975; b-wave before: R2 = 0.3972; b-wave after: R2 = 0.0723) and untreated (a-wave before: R2 = 0.5283; a-wave after: R2 = 0.5368; b-wave before: R2 = 0.7283; b-wave after: R2 = 0.6258) minipigs. Extra sum-of-squares F test; IAA-treated: p < 0.0001 (****) for both a-wave and b-wave; untreated: p = 0.0355 (*) for a-wave and p = 0.3235 (n.s.) for b-wave. d Light-adapted responses in an IAA-treated minipig before and 1 month after IAA administration and in an untreated minipig at matching time points. The dashed lines indicate the onset of the flash. e, f Quantification of the light-adapted fERGs in IAA-treated (mean ± s.d., n = 10 eyes from N = 5 minipigs) and untreated (mean ± s.d., n = 4 eyes from N = 2 minipigs) animals. Two-tailed paired t-test; IAA-treated: p < 0.0001 (****) and power 1.00 for both a-wave and b-wave; untreated: p = 0.0463 (*) and power 0.97 for a-wave and p = 0.4043 (n.s.) and power 0.71 for b-wave. g Quantification of the light-adapted fERGs in IAA-treated (n = 7 eyes from N = 5 minipigs) and untreated (n = 4 eyes from N = 2 minipigs) minipigs over time. IAA was administered on day 0 after the recordings. Data in panels a, d are from MP4 (IAA-treated) and MP1 (untreated). Data in panels b, c, eg are from MP4–8 (IAA-treated) and MP1–2 (untreated). Source data are provided as a Source Data file.
Fig. 3
Fig. 3. fVEPs in blind minipigs.
a Sagittal radiographic image of one minipig implanted with three electrodes for the recordings of fVEPs. Ref: reference electrode; E1: recording electrode 1; E2: recording electrode 2. b Dark-adapted fVEPs at 30 cd s m−2 in an IAA-treated minipig before and 1 month after IAA administration. The vertical dashed line indicates the onset of the flash. The quantification of the peak amplitude is indicated. Data were from MP4 (IAA-treated). c Quantification of the dark-adapted fVEPs at 30 cd s m−2 in IAA-treated minipigs (mean ± s.d.; n = 10 eyes from N = 5 minipigs) before and 1 month after IAA administration and in untreated minipigs (mean ± s.d.; n = 4 eyes from N = 2 minipigs) at matching time points. Two-tailed paired t-test; IAA-treated: p = 0.0005 (***) and power 1.00; untreated: p = 0.5835 (n.s.) and power 0.70. d Quantification of the light-adapted fVEPs at 30 cd s m−2 in IAA-treated minipigs (mean ± s.d.; n = 10 eyes from N = 5 animals) before and 1 month after IAA administration and in untreated minipigs (mean ± s.d.; n = 4 eyes from N = 2 minipigs) at matching time points. Two-tailed paired t-test; IAA-treated: p = 0.0008 (***) and power 0.99; untreated: p = 0.3900 (n.s.) and power 0.71. Data in panels c, d are from MP4–8 (IAA-treated) and MP1–2 (untreated). Source data are provided as a Source Data file.
Fig. 4
Fig. 4. Optimisation of the POLYRETINA device.
a Picture of the photovoltaic pixels (100-µm diameter and 120-µm pitch). b Scanning electron microscopy picture of the photovoltaic pixels released from the wafer and folded to obtain tilted views on the pixels. c Image of a photovoltaic interface stretched and wrinkled with tweezers. d Pictures of the photovoltaic interface taken at 0, 54 and 98% of strain, and after fracture during a stretching test. The red bar shows six rows of pixels in the stretching direction. e Picture of a POLYRETINA. The white arrows indicate the points where tacks will be inserted. f Picture of a POLYRETINA folded four times. Images at various magnifications show that the photovoltaic pixels are intact during folding. g Picture of a POLYRETINA during pinching with magnifications on the intact photovoltaic pixels before and after pinching. Experiments in panels d, fg have been reproduced in three replicates.
Fig. 5
Fig. 5. Adaptation of POLYRETINA to the eye of Göttingen minipigs.
a Echography of three minipig eyes. Images are from MP9–11. b Axial view of the standard POLYRETINA (top) and the POLYRETINA adapted to the ellipsoidal eye of Göttingen minipigs. The POLYRETINA is identified by the red line in both sketches. The black circle is the standard human eye (24 mm), and the black ellipse is the eye of Göttingen minipigs. c Three-dimensional model of the parts in poly(methyl methacrylate) used to produce the curved support by cast moulding. d Sketch of the cross-section of the curved support adapted to the minipig eye. The red lines correspond to the red line in b. The curved support has two indentations of 0.5 mm to identify the locations for the retinal tacks. e Three-dimensional model of the bonding setup. f, g Picture of the curved support (f) and the POLYRETINA (g) with the curvature of the curved support highlighted in red, showing that the curvature is not altered after bonding.
Fig. 6
Fig. 6. Surgical injection of POLYRETINA.
a Sequence of pictures showing POLYRETINA injection in saline (0.9% NaCl). When the implant is pushed towards the edge of the bevelled tube, the unfolding of the PDMS-based dome displaces the thin extensions that relieve the prosthesis. b, c POLYRETINA image before (b) and after (c) the injection procedure. The white arrows in the magnified views indicate a mark on the pixel to confirm that the image is from the same area. The experiment was reproduced in three replicates. dk, Sequence of pictures showing the main steps of the injection of POLYRETINA in a blind Göttingen minipig eye: vitrectomy (d, e), a corneal incision (f), POLYRETINA injection (gi) and POLYRETINA fixation with two retinal tacks (j, k). l Post-surgical echography of the implanted POLYRETINA (white arrows) showing its tight apposition to the retina. The experiment was reproduced in three replicates. Images in panels dl are from MP9.
Fig. 7
Fig. 7. Functional validation of POLYRETINA in blind minipigs.
a Quantification of the dark-adapted fERGs in IAA-treated minipigs before and after IAA administration (mean ± s.d., n = 6 eyes from N = 3 minipigs). Grey lines are the logistic growth regressions (a-wave before: R2 = 0.49543; a-wave after: R2 = 0.0231; b-wave before: R2 = 0.2587; b-wave after: R2 = 0.1300). Extra sum-of-squares F test; p < 0.0001 (****) for both a-wave and b-wave. b Quantification of the light-adapted fERGs before and after IAA administration (mean ± s.d., n = 6 eyes from N = 3 minipigs). Two-tailed paired t-test; a-wave: p = 0.0138 (*) and power 0.98; b-wave: p < 0.0053 (**) and power 1.00. c Quantification of the dark-adapted and light-adapted fVEPs in IAA-treated minipigs before and after IAA administration (mean ± s.d., n = 6 eyes from N = 3 minipigs). Two-tailed paired t-test; dark-adapted: p = 0.0012 (**) and power 1.00; light-adapted: p = 0.0008 (***) and power 0.99. d fVEPs and fEEPs were recorded immediately before (fVEPs, black) and immediately after (fEEPs, red) POLYRETINA implantation at increasing irradiance levels at the cornea. The green bar corresponds to the 10-ms long light pulse. Red arrows show the peak responses with POLYRETINA. e fEEPs recorded after POLYRETINA implantation were obtained from d by averaging two blocks of 100 consecutive responses. The green bar corresponds to the 10-ms long light pulse. f Quantification of the peak-to-peak amplitudes as a function of corneal irradiance before (black, fVEP) and after (red, fEEP) POLYRETINA implantation (mean ± s.d., n = 3 eyes from N = 3 minipigs). The grey area between dashed lines corresponds to the mean (±s.d.) biological noise obtained in each minipig from control trials without light stimulation. Grey lines are the semi-log regressions (before surgery: R2 = 0.0067; after surgery: R2 = 0.2847). Extra sum-of-squares F test; p < 0.0001 (****). Data in panels ac, f are from MP9–11. Data in panels d, e are from MP9. Source data are provided as a Source Data file.
Fig. 8
Fig. 8. Histological assessment of implanted blind minipigs.
af IHC staining against rhodopsin (a), S opsin (b), L/M opsin (c), Na+/K+-ATPase (d), Iba1 (e) and GFAP (f) 2 weeks after POLYRETINA implantation. Each row corresponds to one implanted minipig. The red inserts show magnifications of the retinal sections. All scale bars in panels af are 50 µm. g Quantification of the expression level for Iba1 in the three implanted minipigs and one untreated minipig (mean ± s.d., n = 8 points from 1 eye for each minipig). One-way ANOVA: p = 0.0022 and F = 6.263; Tukey’s multiple comparisons test: MP1 vs MP9 p = 0.4756, MP1 vs MP10 p = 0.9732, MP1 vs MP11 p = 0.0422 (*), MP9 vs MP10 p = 0.2569, MP9 vs MP11 p = 0.0011 (**), MP10 vs MP11 p = 0.1048. h Quantification of the expression level for GFAP in the three implanted minipigs and one untreated minipig (mean ± s.d., n = 8 points from 1 eye for each minipig). One-way ANOVA: p = 0.0271 and F = 3.548; Tukey’s multiple comparisons test: MP1 vs MP9 p = 0.1374, MP1 vs MP10 p = 0.0967, MP1 vs MP11 p > 0.9999, MP9 vs MP10 p = 0.9979, MP9 vs MP11 p = 0.1513, MP10 vs MP11 p = 0.1071). In g and h, for each minipig, data from images at eight locations have been averaged, corresponding to the peripheral nasal retina, the central nasal retina, the central temporal retina, and the peripheral temporal retina at the level of either the area centralis of the optic disc. Images in panels af are from MP9–11. Data in panels g, h are from MP1,9–11. Source data are provided as a Source Data file.

References

    1. Zrenner E. Fighting blindness with microelectronics. Sci. Transl. Med. 2013;5:210ps16–210ps16. - PubMed
    1. Ghezzi D. Retinal prostheses: progress toward the next generation implants. Front. Neurosci. 2015;9:290. - PMC - PubMed
    1. Edwards TL, et al. Assessment of the electronic retinal implant alpha AMS in restoring vision to blind patients with end-stage retinitis pigmentosa. Ophthalmology. 2018;125:432–443. - PMC - PubMed
    1. da Cruz L, et al. Five-year safety and performance results from the argus II retinal prosthesis system clinical trial. Ophthalmology. 2016;123:2248–2254. - PMC - PubMed
    1. Palanker D, Le Mer Y, Mohand-Said S, Muqit M, Sahel JA. Photovoltaic restoration of central vision in atrophic age-related macular degeneration. Ophthalmology. 2020;127:1097–1104. - PMC - PubMed

Publication types